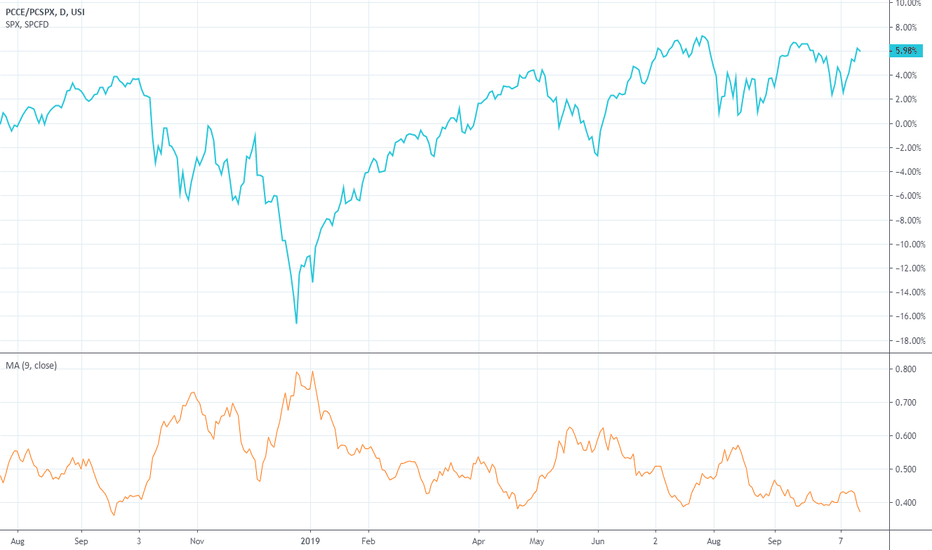
Equity put call ratio maybe early in the sell signalEquity options volume is generated mostly by nasdaq stocks, tesla and nvidia have been volume leaders for quite some time. When the macd signal line goes up through zero it generates a sell, this doesn't always work, so you must use this in conjunction with other indicators.
What is unusual now is that with a nasdaq drawdown is much deeper than the april drawdown, traders have been leaning heavily on the call side until now. Yes the market is oversold, the vix has broken out, but until traders start buying more puts I doubt we will see a durable bottom.
PCCE trade ideas
Equity Put Call ratio - thoughtsEquity Put Call Ratio spiked 5 times and remained above average for 28 trading days (or 38 calendar days) during the initial q1 2020 Covid sell off, Feb 24 to April 2nd.
Let the selling play out. Looks too early to turn bullish, but everyone appears to be rushing to the same side of the boat (and peering over the side saying that water looks cold and deep).
Exogenous events may generate one or more 3 sigma days
12/23 WATCHLIST + MARKET OUTLOOK (Warning!)** THIS IS PURELY MY OPINION AND I AM NOT LIABLE FOR YOUR TRADING DECISIONS **
Very interesting day today where even though we GOT the stimulus bill, the market did not seem satisfied. We remained under the major support (now resistance) trendline in red, which has served as support since the coronavirus low. There are 2 reasons this may have happened: (1)There is a big possibility that the market had fully priced in a large stimulus package, and is now asking "ok, what else can you feed me?" OR (2) Investors are scared of the covid mutation making its way through Europe.
Regardless of the reason, it is a particularly dangerous time for this to be happening because if you look at the put-to-call-equity ratio, it dropped to pretty much all time lows as soon as the stimulus bill was announced. This means that market participants are overleveraged on calls and expecting the market to continue going up (being greedy). While this is not a sell signal by itself, if the market starts to correct, we could see a big long squeeze as investors panic and offload their long positions. I would save the PCCE graph to your watchlist and check it frequently. It is essentially the chart that tells you when to be greedy vs. fearful according to the old adage: "When others are fearful, be greedy. When others are greedy, be fearful." A normal PCCE level is roughly indicated by the 2 white lines I've drawn on the graph.
My bias going into tomorrow is neutral. However, the market doesn't care about my opinion and will do what it wants, and I will trade what it gives me!
The watchlist from yesterday went absolutely nuts. Highly suggest finding your favorite setups and focusing on those. Don't worry about missing a play! There are opportunities every single day.
WATCHLIST 12/23
Recall that my trading style is short scalps and intraday options. These are not swing levels.
ZM calls over 409.1
BABA puts under 255.4
BLNK calls over 49
PENN calls over 96.65
PYPL calls over 244
SQ calls over 243.4
MRNA puts under 123
NVDA calls over 531.8
WKHS calls over 23.45
TWLO calls over 374.7
NFLX calls over 527.6
PCCE; Risk Assets "crash conditions" are met. Dump it all! SHORTHere it is, up cluse and personal.
This is the Put/Call Ratio 14 day RSI. - A highly reliable indicator of 93.8% accuracy.
Dump ALL risk assets - including the highly correlated Precious Metals!! - here!
The raw PCCE
Here is the VIX
... and the FAANGs
... and the AUDUSD
... and the USD (DXY)
... and Gold
Just how many more clues does one really need??... For real.
PUT/CALL RATIO EQUITY MARKET WARNING SIGNALHello,
Here I've analyzed the PCCE (Put/Call Ratio Equities) in the monthly time frame.
Something extremely concerning is taking place for the coming months. We are close to hitting .45 on the put/call ratio which is in extremely overbought territory. What this means is when we are in this level, all of the buying power in the market is already in the market. We need to blow off steam before we can continue higher. Typically we can expect extreme volatility in the coming months after the ratio gets to this level. I've marked out historic times where price got to this level to add clarity to the chart.
We've already sold off 10% in September when we almost touched. Now we are lower and can possibly touch .45 this month, if that does. Cash may gain value.
USI:PCCE
Equity Put/Call ratio Decade lowThe Equity Put/Call ratio has reached a low not seen in the last decade. The last 2 times it got close to this low the market corrected significantly beteween 25-30%.
This may be a strong indicator of a market top - valuations in tech companies and the S&P are extremely stretched.
S&P 500 - Options Trading Volume Reveal Exuberant SentimentThe CBOE 10D Put/Call sentiment shows very upbeat sentiment among market participants. They fear on missing out a year-end rally. Unfortunately, current readings coincided with those near tops during the past 42 months. Larger corrections unfolded shortly after the reading and further upside was limited at best.


