Hellena | Oil (4H): SHORT to support area of 65.944.Colleagues, I previously recommended moving trades to break-even, and for good reason. It is always necessary to hedge and reduce losses—this is part of professional work.
(Breakeven=Risk Free: Move Stop loss to the entry level).
The price has nevertheless shown a stronger correction, and I now bel
About CFDs on WTI Crude Oil
Crude Oil is a naturally occurring liquid fossil fuel resulting from plants and animals buried underground and exposed to extreme heat and pressure. Crude oil is one of the most demanded commodities and prices have significantly increased in recent times. Two major benchmarks for pricing crude oil are the United States' WTI (West Texas Intermediate) and United Kingdom's Brent. The differences between WTI and Brent include not only price but oil type as well, with WTI producing crude oil with a different density and sulfur content. The demand for crude oil is dependent on global economic conditions as well as market speculation. Crude oil prices are commonly measured in USD. Although there have been discussions of replacing the USD with another trade currency for crude oil, no definitive actions have been taken.

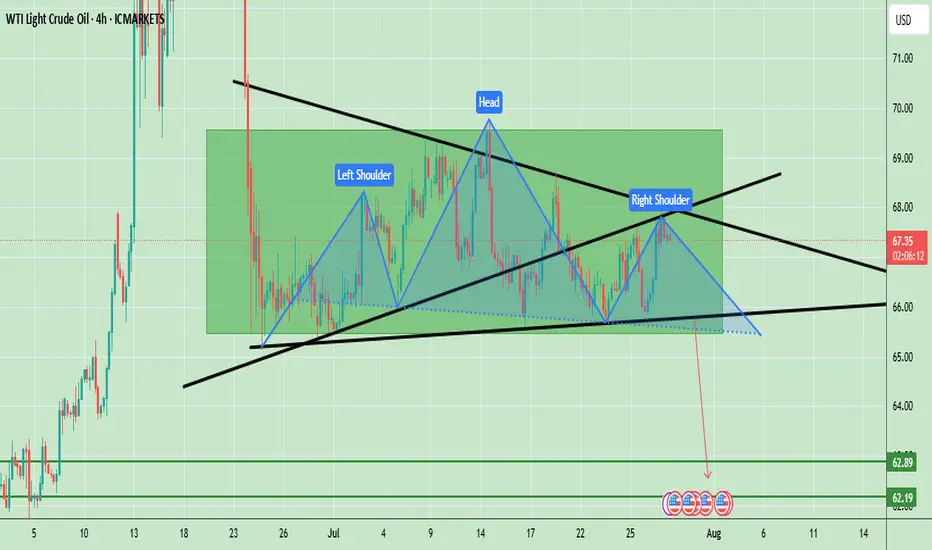
Oil Prices Form Bearish Head & Shoulders – Key Neckline in FocusWTI crude oil is showing a clear Head and Shoulders (H&S) pattern, which is a strong bearish reversal signal. The left shoulder formed in early July, followed by a higher peak forming the head in mid-July, and finally the right shoulder near the current levels, which is lower than the head. The neck
US CRUDE OIL(WTI): Consolidation ContinuesUSOIL is currently consolidating within a horizontal channel and has shown a bearish response at resistance,
The price formed a small double top pattern before declining.
There's a strong likelihood that the price will soon reach the 67.83 level.

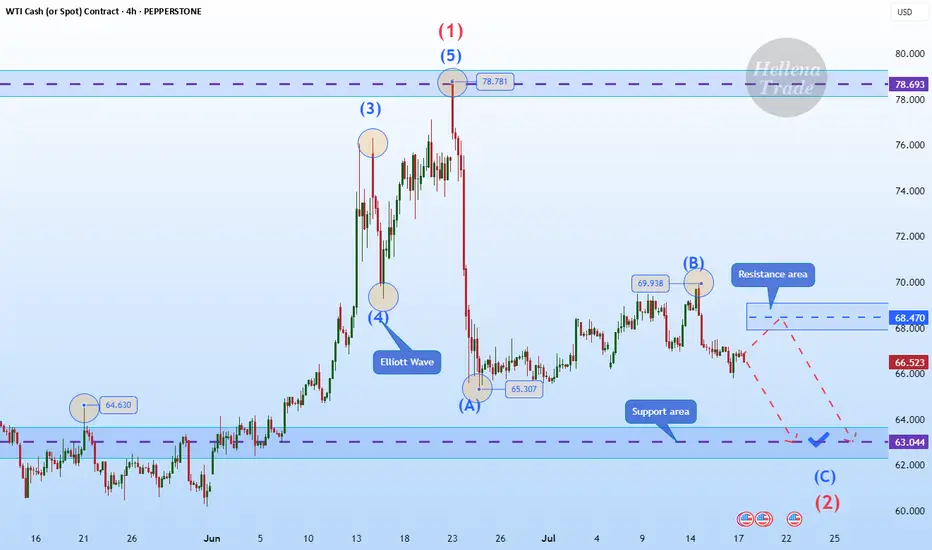
Hellena | Oil (4H): SHORT to support area of 63.000.Colleagues, I believe that wave “B” has formed at the level of 69.938, and now we expect the downward movement to continue with the aim of completing wave ‘C’ of the middle order and wave “2” of the higher order in the support area of 63,000.
It is quite possible that the price could reach the 60,0
Oil Faces Bearish Turn After Speculative SpikeOil Faces Bearish Turn After Speculative Spike
Since June 24, 2024, when oil prices reached $64 entered a 38-day bullish correction. Based on the chart, this move appears to be forming an ABC corrective pattern, which may now be nearing completion.
From here, a renewed decline is likely, with pot

Crude oil starts to rise, are you ready?
💡Message Strategy
Oil prices continued their upward trend amid rising geopolitical risks. US President Trump recently issued a tough statement, demanding Russia end the conflict with Ukraine within 10 to 12 days or face secondary sanctions.
Fears that Russian crude oil exports might be disrupte

USOIL Is Bearish! Short!
Please, check our technical outlook for USOIL.
Time Frame: 9h
Current Trend: Bearish
Sentiment: Overbought (based on 7-period RSI)
Forecast: Bearish
The market is approaching a significant resistance area 69.178.
Due to the fact that we see a positive bearish reaction from the underlined area, I

Crude Oil’s $70 Surge Still Faces 3-Year Channel ResistanceAlthough news points to a crude oil price surge, technical analysis indicates price cap risks remain within the borders of a 3-year descending channel.
Should a clear hold emerge above the $70 barrier, the bullish rebound in price action from the $64.40 zone, in line with the weekly RSI’s rebound

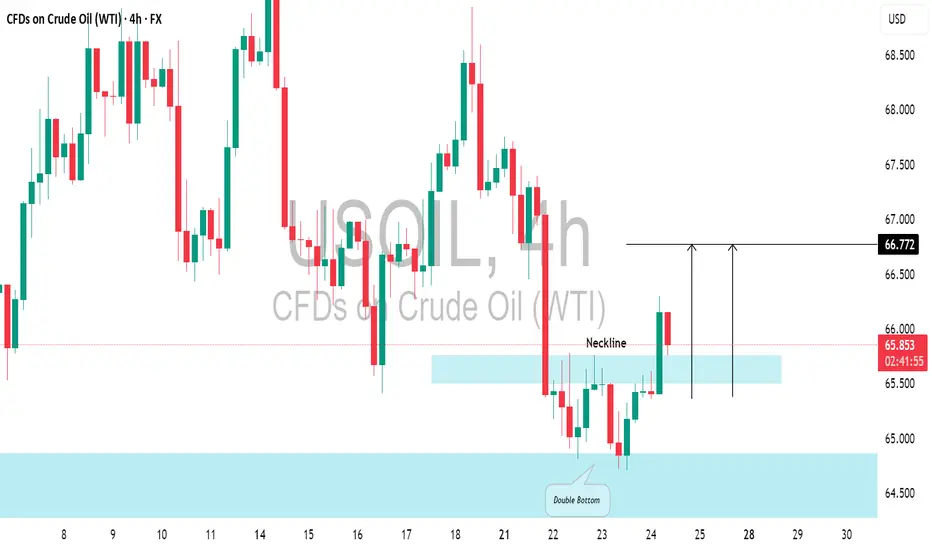
US CRUDE OIL (WTI): Pullback From Support📈USOIL responded well to the highlighted daily support level.
The price formed a double bottom pattern on that and broke above its neckline.
There's a strong likelihood that the price will continue to increase and reach 66.72 shortly.
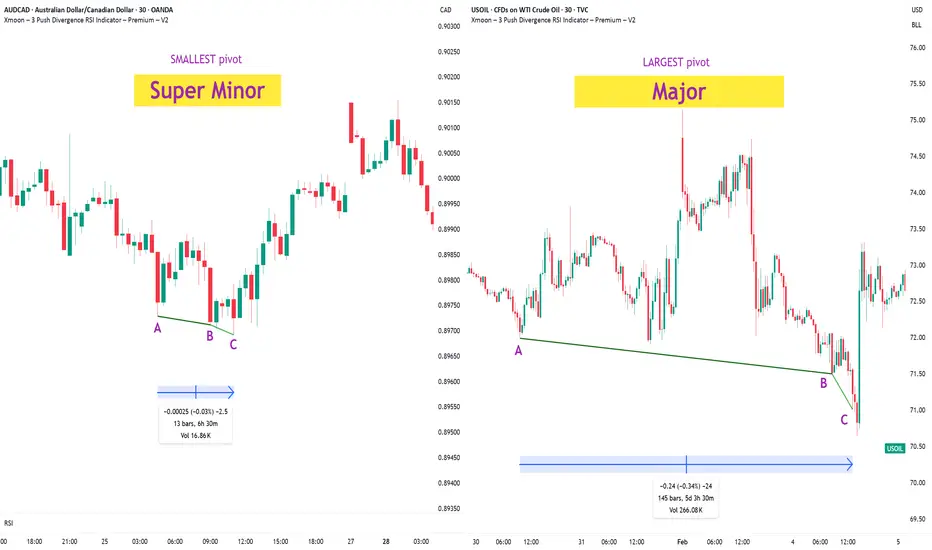
Xmoon Indicator Tutorial – Part 2 – Pivots🔻🔻🔻+ Persian translation below 🔻🔻🔻
🔹 What Is a Pivot?
In the Xmoon strategy, every high or low that forms on the chart is considered a pivot.
The number of candles between two highs or two lows defines the size of the pivot.
The more candles there are between them, the larger and more reliable
See all ideas
Displays a symbol's price movements over previous years to identify recurring trends.