Hellena | Oil (4H): SHORT to support area of 61.937 (Fibo lvl).Hello, colleagues!
Well, I think that the previous scenario is still relevant and the “ABC” correction is developing according to the scenario.
At the moment, I see a five-wave structure in the downward wave “C”. I expect a small correction to the area of 67.287, then a continuation of the downward movement to the area between 61.8% and 100% of the levels of Fibonacci extension - the support area of 61.937.
Manage your capital correctly and competently! Only enter trades based on reliable patterns!
USOIL trade ideas

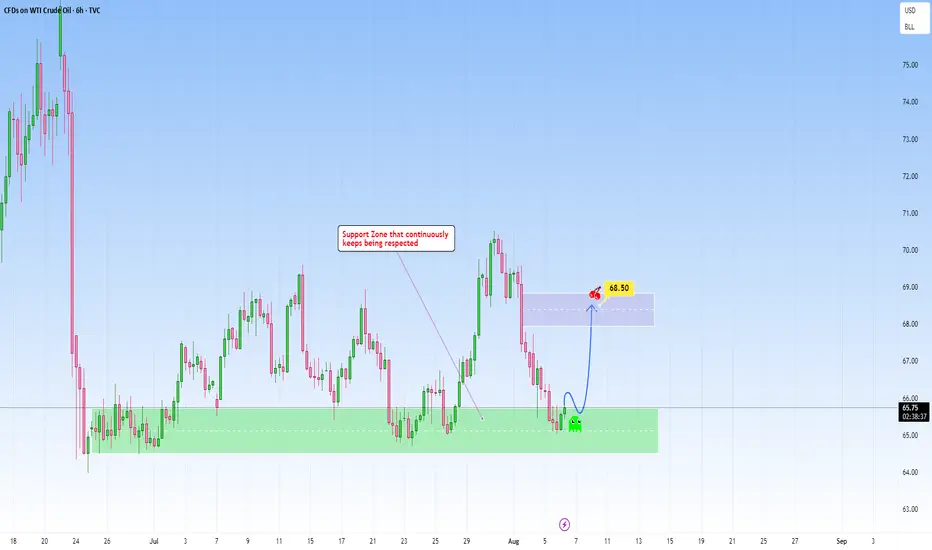
USOIL: Respecting support, repeating opportunity The chart on USOIL presents a compelling technical setup that blends structure, behavioral dynamics. The core technical analysis here lies in this support zone that is well-defined area that has been tested multiple times and consistently held, suggesting strong demand.
The narrative structure is one of rebound. Every time price approaches the support zone, the reaction is not only immediate but also structured, price responds with conviction.
So I am recognizing the strength of the reaction and forecasting an upward move to the 68.50 level.
The target at 68.50 is achievable, acting as both a profit objective and a psychological level, round enough to attract attention and previously strong enough to cause a drop. If momentum sustains, a breakout from there would depend on volume confirmation and structure shifts, but for now, the play back into that range makes sense and respects both the chart’s geometry and price action logic.
Not reacting to noise, but to repeatable high-probability zones.
USOILUSOIL price is now testing the support zone of 64.72-63.88. If the price cannot break through the 63.88 level, it is expected that the price will rebound. Consider buying in the red zone.
🔥Trading futures, forex, CFDs and stocks carries a risk of loss.
Please consider carefully whether such trading is suitable for you.
>>GooD Luck 😊
❤️ Like and subscribe to never miss a new idea!
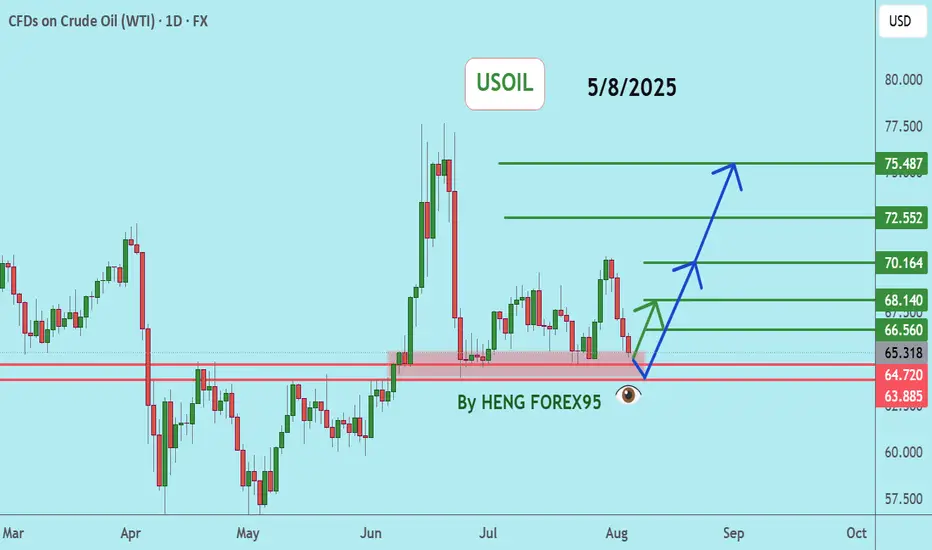
Crude oil next move (expecting mild bullish move) (08-08-2025)Go through the analysis carefully, and do trade accordingly.
Anup 'BIAS for the mid term (08-08-2025)
Current price- 63.400
"if Price stay above 62.00 then next target is 64.400, 66.00 and 70.00 and below that 58.00"
-POSSIBILITY-1
Wait (as geopolitical situation are worsening )
-POSSIBILITY-2
Wait (as geopolitical situation are worsening)
Best of luck
Never risk 2% of principal to follow any position.
Support us by liking and sharing the post.

US CRUDE OIL(WTI): Important Breakout📉USOIL has fallen and closed below a significant daily support level,
which has now become a strong resistance.
I anticipate a downward trend towards the support level at 60.76.

USOIL: Eyes on 64.10 as Geopolitics Take Center Stage!!In today’s session, we’re watching USOIL for a potential short setup around the 64.10 zone. Price action remains in a broader downtrend, with the current move looking like a corrective retracement into a key support turned resistance area.
From a fundamental perspective, all eyes are on the scheduled August 15 meeting between Donald Trump and Vladimir Putin. A ceasefire agreement could fuel bearish momentum, potentially accelerating the sell-off. On the other hand, if talks collapse, renewed geopolitical tension could keep oil prices bid in the short term.
Technically, 64.10 is the battleground a decisive rejection here could offer an attractive risk reward for sellers aligned with the dominant trend.

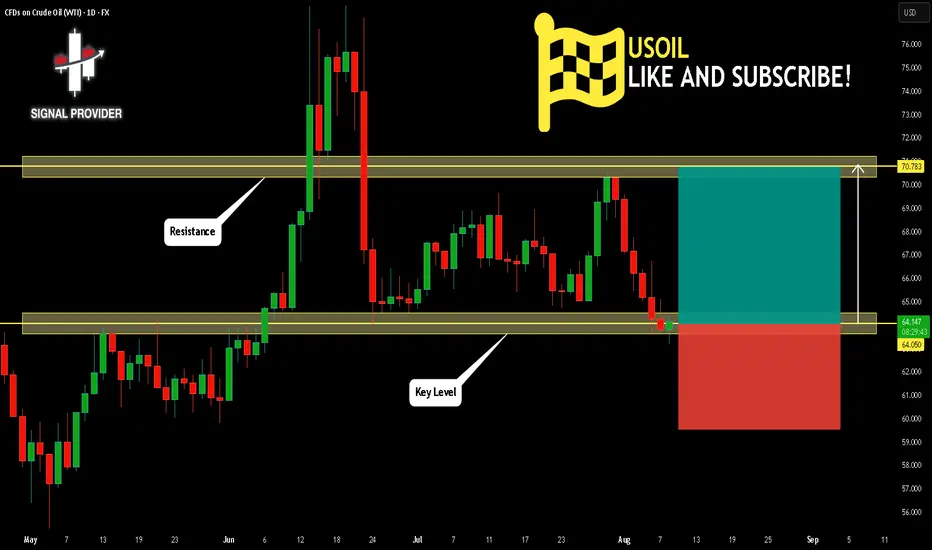
USOIL Is Going Up! Buy!
Take a look at our analysis for USOIL.
Time Frame: 1D
Current Trend: Bullish
Sentiment: Oversold (based on 7-period RSI)
Forecast: Bullish
The market is approaching a key horizontal level 64.050.
Considering the today's price action, probabilities will be high to see a movement to 70.783.
P.S
Please, note that an oversold/overbought condition can last for a long time, and therefore being oversold/overbought doesn't mean a price rally will come soon, or at all.
Disclosure: I am part of Trade Nation's Influencer program and receive a monthly fee for using their TradingView charts in my analysis.
Like and subscribe and comment my ideas if you enjoy them!
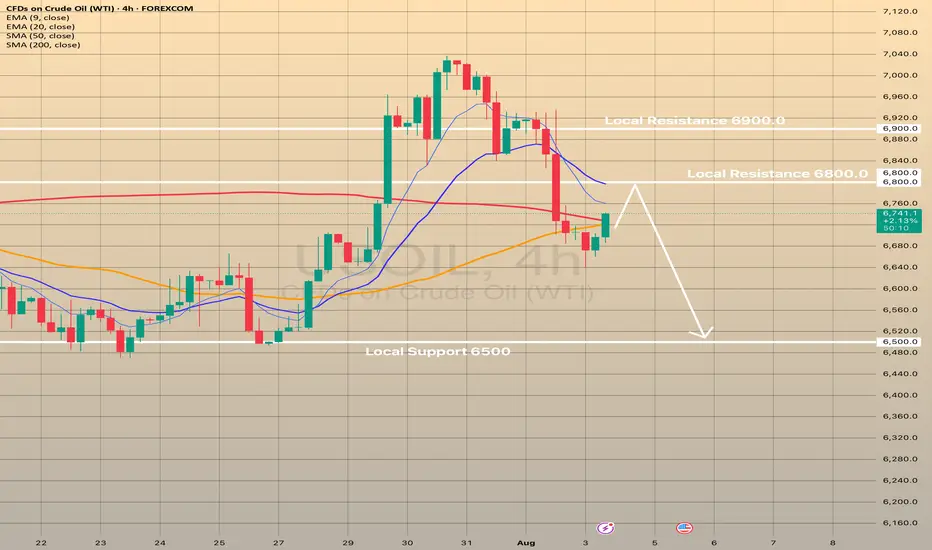
USOIL declines for the 3 days in a row. What's next?USOIL declines for the 3 days in a row. What's next?
Since the last post the USOIL has already declined on 2.5%, currently rebounding from SMA50 on 4-h chart. 2 main reasons are behind this.
On August 3, the Organization of the Petroleum Exporting Countries and their partners, collectively known as OPEC+, decided to increase oil production by 547,000 barrels per day in September, the latest in a series of swift production boosts aimed at regaining market share. They cited a robust economic outlook and low inventories as the reasons for their decision. However, Friday NFP report may signal of a potential recession risk in the United States, the biggest oil consumer in the world. Here is what the Goldman Sachs writes down in x.com: "The decline in employment growth over the previous two months in the July report was one of the largest since 1960 and was accompanied by several months of similar revisions earlier. Corrections of this magnitude are extremely rare outside of the recession period."
So, fundamentals don't favor oil and despite the current rebound from SMA50, there are low chances of developing some bullish momentum here. The pullback from 6,800.00 is expected with the following decline towards 6,500.00
WTI , begging to see SKY WTI is now in weekly demand zone and brooked trend line,
shows that bad news is coming to the world !!!
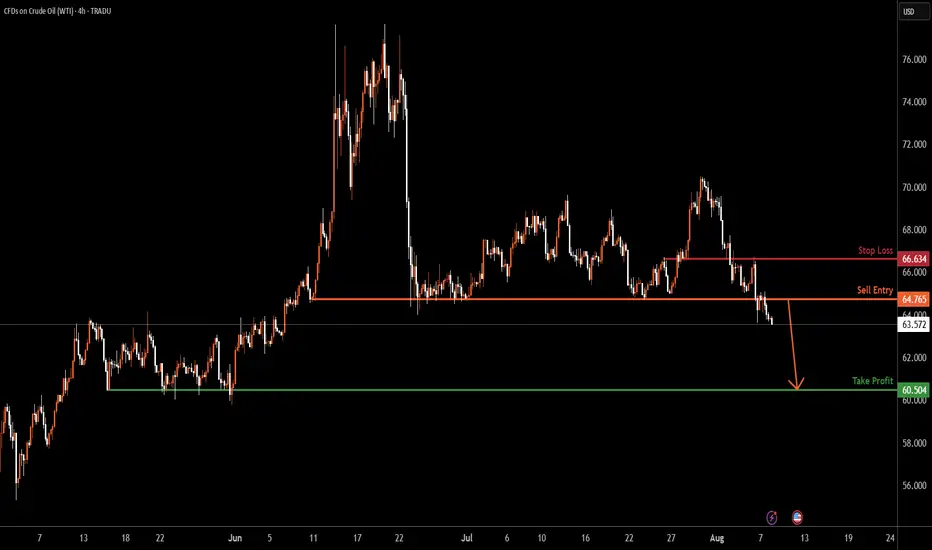
USOIL H4 | Potential bearish dropUSOIL has rejected the sell entry which has been identified as a pullback resistance and could drop from this level to the downside.
Sell entry is at 64.76, which is a pullback resistance.
Stop loss is at 66.63, which is an overlap resistance.
Take profit is at 60.50, which is a multi-swing low support.
High Risk Investment Warning
Trading Forex/CFDs on margin carries a high level of risk and may not be suitable for all investors. Leverage can work against you.
Stratos Markets Limited (tradu.com ):
CFDs are complex instruments and come with a high risk of losing money rapidly due to leverage. 65% of retail investor accounts lose money when trading CFDs with this provider. You should consider whether you understand how CFDs work and whether you can afford to take the high risk of losing your money.
Stratos Europe Ltd (tradu.com ):
CFDs are complex instruments and come with a high risk of losing money rapidly due to leverage. 66% of retail investor accounts lose money when trading CFDs with this provider. You should consider whether you understand how CFDs work and whether you can afford to take the high risk of losing your money.
Stratos Global LLC (tradu.com ):
Losses can exceed deposits.
Please be advised that the information presented on TradingView is provided to Tradu (‘Company’, ‘we’) by a third-party provider (‘TFA Global Pte Ltd’). Please be reminded that you are solely responsible for the trading decisions on your account. There is a very high degree of risk involved in trading. Any information and/or content is intended entirely for research, educational and informational purposes only and does not constitute investment or consultation advice or investment strategy. The information is not tailored to the investment needs of any specific person and therefore does not involve a consideration of any of the investment objectives, financial situation or needs of any viewer that may receive it. Kindly also note that past performance is not a reliable indicator of future results. Actual results may differ materially from those anticipated in forward-looking or past performance statements. We assume no liability as to the accuracy or completeness of any of the information and/or content provided herein and the Company cannot be held responsible for any omission, mistake nor for any loss or damage including without limitation to any loss of profit which may arise from reliance on any information supplied by TFA Global Pte Ltd.
The speaker(s) is neither an employee, agent nor representative of Tradu and is therefore acting independently. The opinions given are their own, constitute general market commentary, and do not constitute the opinion or advice of Tradu or any form of personal or investment advice. Tradu neither endorses nor guarantees offerings of third-party speakers, nor is Tradu responsible for the content, veracity or opinions of third-party speakers, presenters or participants.
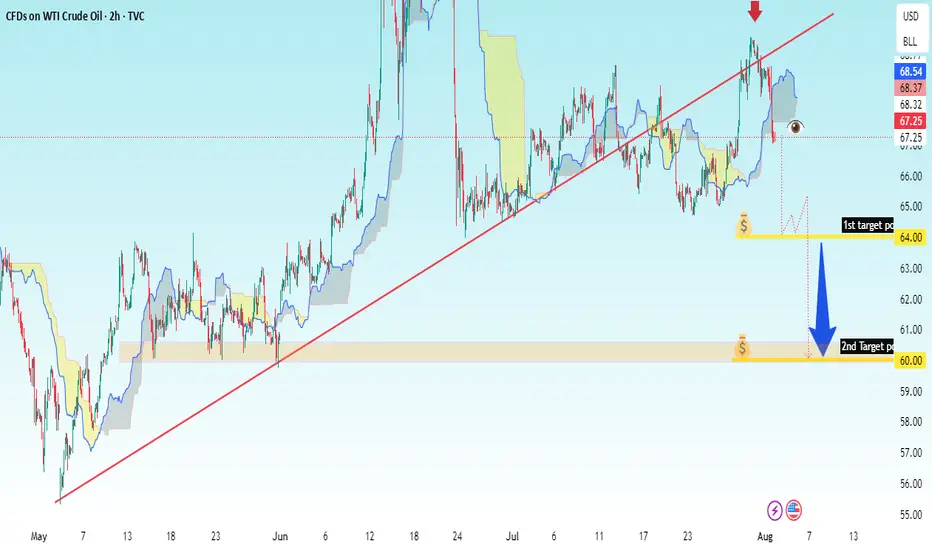
USOIL 2H – Trendline Break Sell Setup✅ Key Observations:
1. Chart Type: Candlestick chart (2h interval).
2. Trend Line: An uptrend line (red) is drawn, now broken to the downside.
3. Ichimoku Cloud: Price has broken below the Ichimoku cloud, signaling potential bearish momentum.
4. Red Arrow: Indicates a potential short entry point where price broke below the trendline.
5. Downside Targets:
1st Target Point: $64.00
2nd Target Point: $60.00
6. Bearish Projection: A large blue arrow pointing downward from the breakdown level implies a strong sell setup.
---
🎯 Your Trade Setup (based on chart):
Entry (Sell): Around $67.25–$67.50
Stop Loss: Above recent high or Ichimoku resistance, approx $68.70
Target 1: $64.00
Target 2: $60.00
Risk-Reward Ratio: Favorable, around 1:2.5 or better depending on entry
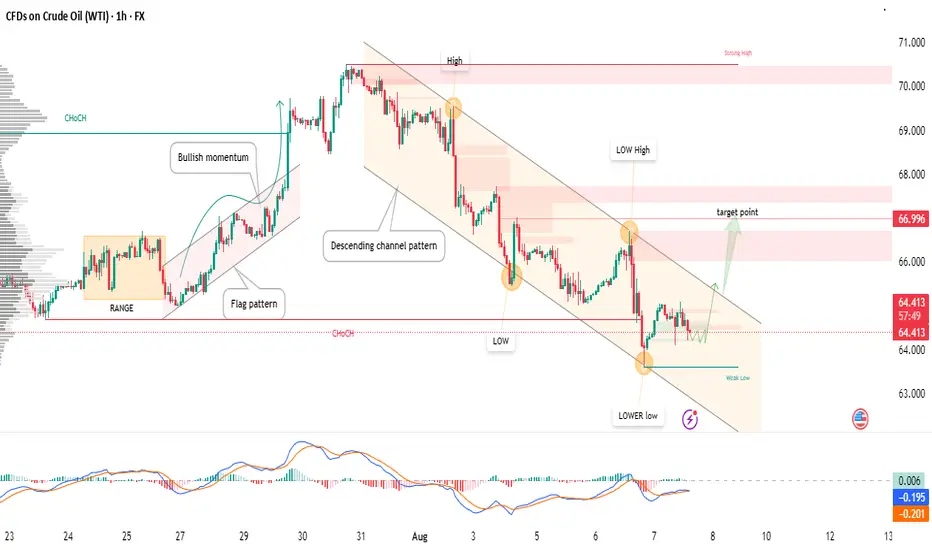
USOIL - Potential Bullish Reversal Inside Descending Channel!📉 After a significant bearish move from the recent high, USOIL is trading within a well-defined descending channel pattern.
🔍 Key observations:
Price has printed a lower low into a weak low area, showing signs of seller exhaustion.
A potential reversal pattern is forming at channel support.
MACD shows bullish momentum divergence, hinting at a short-term reversal.
Targeting the supply zone near 66.99, aligning with the previous low high and key structure zone.
🟢 Trade Idea:
Looking for bullish confirmation to trigger a long setup.
Target: 66.99 (near upper channel boundary and previous structure)
Manage risk carefully with a stop below the recent low.
⚠️ Disclaimer: This is a technical analysis-based idea, not financial advice. Always do your own research and manage risk accordingly.
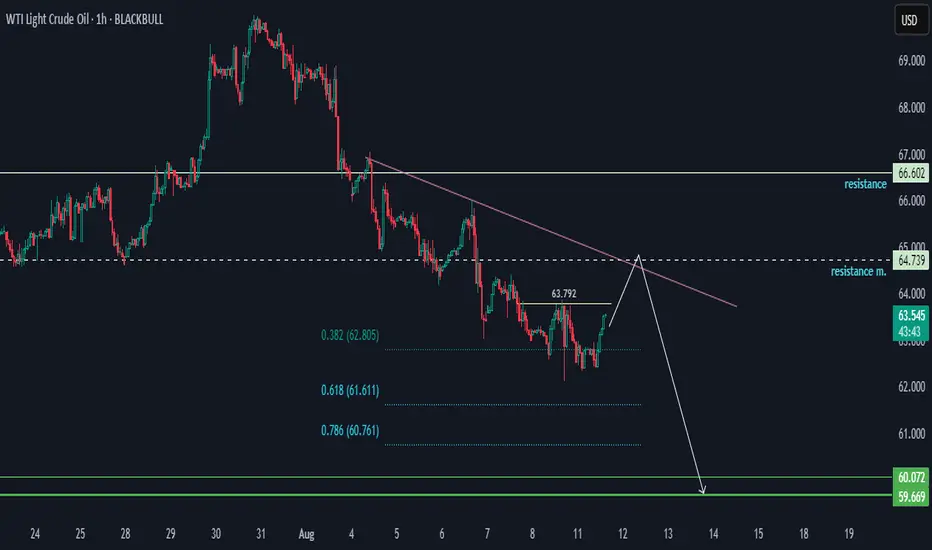
WTI In a Bearish Trend.WTI is in a bearish trend, but on the daily timeframe, buyers are attempting to push against the bearish pressure at 65 and are facing immediate resistance at 63.792. Overall, the price has the potential to pulse and pull back into the bearish momentum.
We have two target support areas for a bias of 60.072–59.669, with a minor support level worth noting at 62.805.
Happy Trading,
Khiwe.
Not trading advice
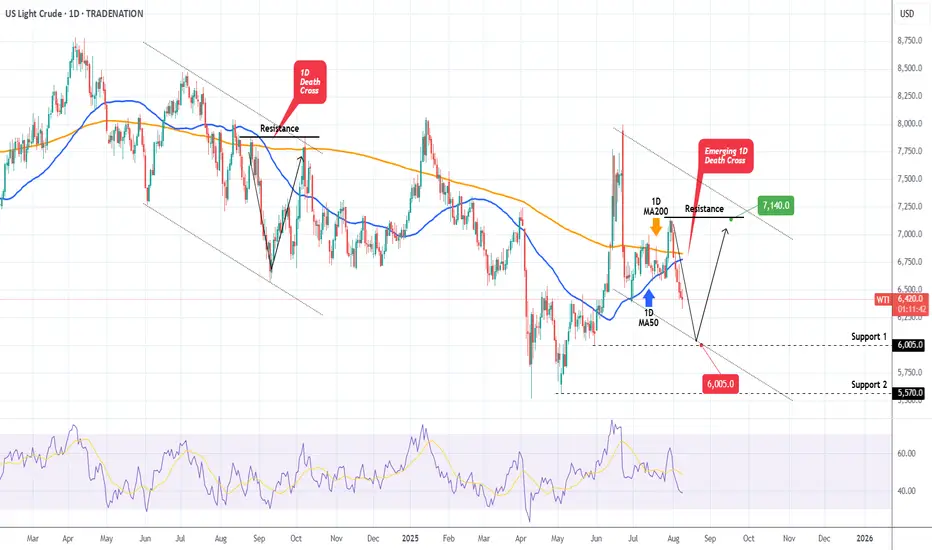
WTI OIL on its first 1D Death Cross since Sep 2024!WTI Oil (USOIL) is on the decline and is about to form a 1D Death Cross for the first time since September 06 2024! That is technically a bearish signal but last time once completed, the market formed a bottom 2 days later.
As a result, we expect a max drop to Support 1 ($60.05) but then more likely a rebound back to the Resistance ($71.40), especially given the fact that the 1D RSI will almost get oversold (>30.00).
-------------------------------------------------------------------------------
** Please LIKE 👍, FOLLOW ✅, SHARE 🙌 and COMMENT ✍ if you enjoy this idea! Also share your ideas and charts in the comments section below! This is best way to keep it relevant, support us, keep the content here free and allow the idea to reach as many people as possible. **
-------------------------------------------------------------------------------
Disclosure: I am part of Trade Nation's Influencer program and receive a monthly fee for using their TradingView charts in my analysis.
💸💸💸💸💸💸
👇 👇 👇 👇 👇 👇
70 Incoming Short closed Friday.. Bounce incoming now . Be careful with shorts now.. Good luck and safe trade

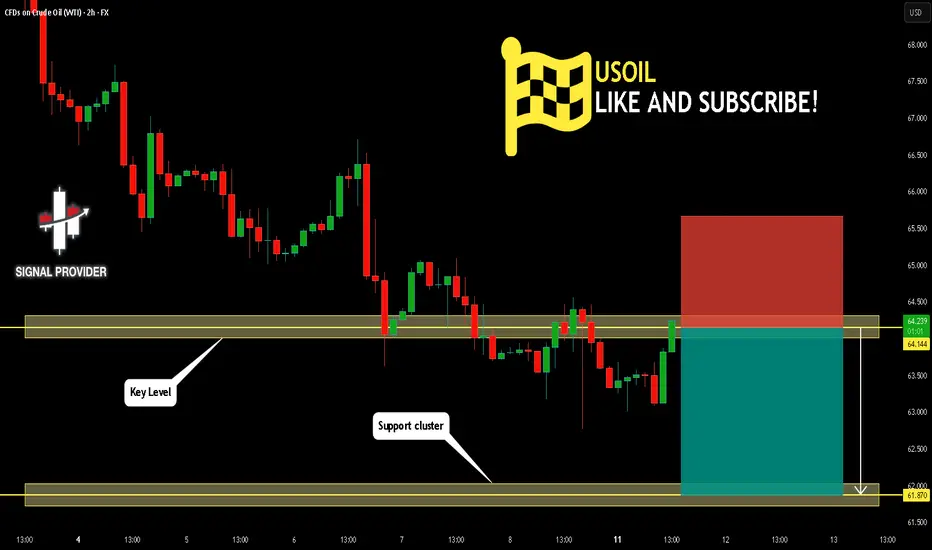
USOIL Is Going Down! Sell!
Take a look at our analysis for USOIL.
Time Frame: 2h
Current Trend: Bearish
Sentiment: Overbought (based on 7-period RSI)
Forecast: Bearish
The price is testing a key resistance 64.144.
Taking into consideration the current market trend & overbought RSI, chances will be high to see a bearish movement to the downside at least to 61.870 level.
P.S
Overbought describes a period of time where there has been a significant and consistent upward move in price over a period of time without much pullback.
Disclosure: I am part of Trade Nation's Influencer program and receive a monthly fee for using their TradingView charts in my analysis.
Like and subscribe and comment my ideas if you enjoy them!
USOIL Long trade Risking 1% to make 1.6% ProfitTVC:USOIL Long trade, with my back testing of this strategy, USOIL is long.
This is good trade.
Don't overload your risk like Greedy gambler!!!
Be Disciplined Trader, what what you can afford.
Use proper risk management
Looks like good trade.
Lets monitor.
Use proper risk management.
Disclaimer: only idea, not advice
USOIL LONG FROM SUPPORT
USOIL SIGNAL
Trade Direction: short
Entry Level: 62.65
Target Level: 68.77
Stop Loss: 58.58
RISK PROFILE
Risk level: medium
Suggested risk: 1%
Timeframe: 1D
Disclosure: I am part of Trade Nation's Influencer program and receive a monthly fee for using their TradingView charts in my analysis.
✅LIKE AND COMMENT MY IDEAS✅

OIL BUYIndia's purchases of Russian oil might come at a steep price if President Trump goes ahead with the implementation of extra 25% tariffs on New Delhi's goods. "Countries facing this potential secondary tariff must weigh the benefits of buying discounted Russian crude against the potential cost to trade with the U.S.," ING's Warren Patterson says. Indian exports to the U.S. amount to around $87 billion, while savings from discounted Russian oil would be around $6 billion, according to the firm. "While comments from India suggest that the country will do what's best for its citizens, reducing or stopping Russian oil purchases makes more sense," the head of commodities strategy says.

Oil continues to decline due to geopolitics optimismOil continues to decline due to geopolitics optimism
A Kremlin official announced that Presidents Trump and Putin will hold a summit soon, their first since 2021, with a White House source suggesting it could occur as early as next week. Optimism surrounding potential U.S.-Russia discussions on the Ukraine conflict has alleviated concerns about oil supply disruptions, despite U.S. sanctions targeting India for its continued Russian crude imports. Trump introduced a 25% tariff on Indian goods and signaled possible additional tariffs on China. However, increased OPEC production and ongoing trade tensions remain key concerns, raising fears of slower economic growth and reduced demand.
Technically, USOIL trades just above the 6,300.00 support level. Insignificant rebound from this level is expected with possible decline towards crucial 6,000.00 support level.

Market Analysis: WTI Crude Oil Struggles In RedMarket Analysis: WTI Crude Oil Struggles In Red
WTI Crude oil is also down and remains at risk of more losses below $62.00.
Important Takeaways for WTI Crude Oil Price Analysis Today
- WTI Crude oil prices extended losses below the $65.00 support zone.
- A major bearish trend line is formed with resistance at $63.05 on the hourly chart of XTI/USD.
WTI Crude Oil Price Technical Analysis
On the hourly chart of WTI Crude Oil, the price struggled to continue higher above $66.00 against the US Dollar. The price formed a short-term top and started a fresh decline below $65.00.
There was a steady decline below the $64.50 pivot level. The bears even pushed the price below $63.50 and the 50-hour simple moving average. Finally, the price tested the $62.15 zone, and the price is now consolidating losses.
On the upside, immediate resistance is near the 23.6% Fib retracement level of the downward move from the $65.98 swing high to the $62.15 low at $63.05. There is also a major bearish trend line at $63.05 and the 50-hour simple moving average.
The main hurdle is $63.50. A clear move above the $63.50 zone could send the price toward the 61.8% Fib retracement level at $64.50.
The next key resistance is near $66.00. If the price climbs further higher, it could face sellers near $68.00. Any more gains might send the price toward the $70.00 level.
Immediate support is near the $62.15 level. The next major level on the WTI crude oil chart is near $61.20. If there is a downside break, the price might decline toward $60.00. Any more losses may perhaps open the doors for a move toward the $55.00 zone.
This article represents the opinion of the Companies operating under the FXOpen brand only. It is not to be construed as an offer, solicitation, or recommendation with respect to products and services provided by the Companies operating under the FXOpen brand, nor is it to be considered financial advice.

Hellena | Oil (4H): SHORT to support area of 65.944.Colleagues, I previously recommended moving trades to break-even, and for good reason. It is always necessary to hedge and reduce losses—this is part of professional work.
(Breakeven=Risk Free: Move Stop loss to the entry level).
The price has nevertheless shown a stronger correction, and I now believe that the medium-term “ABC” waves have not yet formed, nor has the large “Y” wave.
This means that I expect the completion of wave “B” and then a continuation of the downward movement in wave “C.”
I consider the support area of 65.944 to be the minimum target.
Manage your capital correctly and competently! Only enter trades based on reliable patterns!

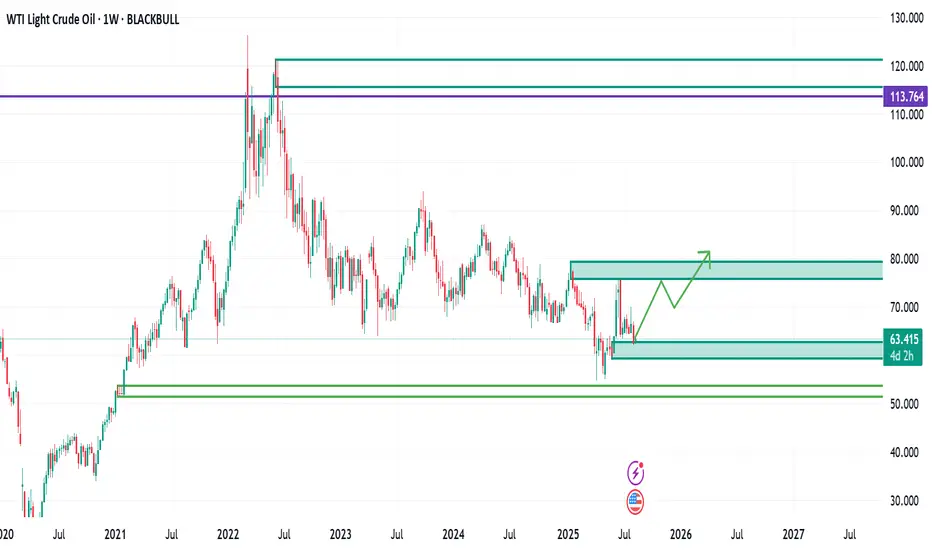
WTI Crude Oil Analysis – Is a Major Wave 3 About to Begin?🛢 WTI Crude Oil Analysis – Is a Major Wave 3 About to Begin? 🚀
According to Elliott Wave count, it appears that the corrective Wave 2 has either completed or is in its final stages. The (ABC) corrective structure, combined with reactions to key Fibonacci levels, suggests a potential end to the correction and the start of a powerful Wave 3.
Key Fibonacci Support Levels:
📍 $60.39 – 50% retracement
📍 $58.84 – 78.6% retracement
As long as price holds above these levels, the bullish structure remains intact, with the ultimate target for Wave 3 projected well above the previous all-time highs.
💬 What’s your view? Is crude oil ready for a historic move, or is there still room for more correction?
✅ Save this idea & follow for future updates.
-------------------------------------------------------------------------------------------------------------------
🚀 Who am I?
I'm Mahdi, a prop firm trader with 7+ years of experience in technical analysis, mainly focusing on Smart Money Concepts and Elliott Wave theory.
I specialize in delivering high-quality trading signals, market insights, and educational content tailored for serious traders and investors.
📊 My Tools: SMC, Elliott Wave, Fibonacci, Liquidity Grabs, Order Blocks
💼 Prop Challenge Passed: Yes | Funded Account: In Progress
🔗 Follow for consistent updates and trading insights.
