Hellena | Oil (4H): SHORT to support area of 58.00.Colleagues, the previous forecast did not meet expectations for too long, and the price has been in a prolonged sideways movement.
In this regard, I decided to slightly revise the waves and make a new forecast.
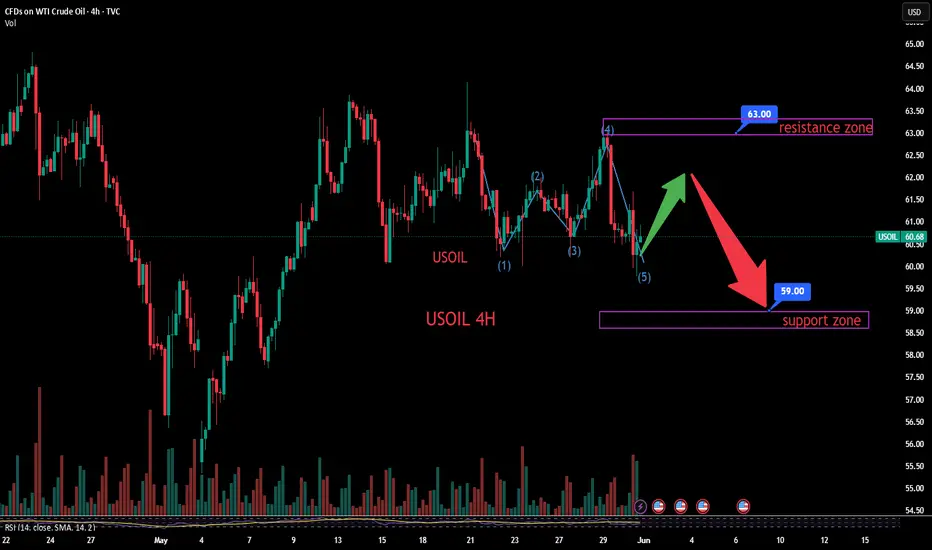
At the moment, I believe that the price will resume its downward movement in the medium-term wave “3.” The complex configuration of the correction makes it difficult to fully understand whether it is a combined correction or a five-wave movement.
In either case, I expect the price to reach the support area of 58.00.
Manage your capital correctly and competently! Only enter trades based on reliable patterns!
USOIL trade ideas

Oil Price Stuck Near $60 Amid Geopolitical TensionsOil Price Stuck Near $60 Amid Geopolitical Tensions
Oil prices remain near $60, driven by global uncertainty. In the Middle East, tensions persist as Israel continues its military actions in Gaza. Meanwhile, the war between Ukraine and Russia continues despite U.S. efforts to mediate. Reports indicate that Russia has used North Korean weapons to intensify missile strikes on Ukrainian infrastructure, raising concerns about Moscow’s reliance on Pyongyang.
Adding to the uncertainty, Trump’s tariff policies are creating instability for major economies. However, OPEC+ has pledged to increase oil production in July, which could push prices lower.
For now, $60 remains a strong support level. If the price breaks below this barrier, further declines could follow, as indicated on the chart.
You may find more details in the chart!
Thank you and Good Luck!
❤️PS: Please support with a like or comment if you find this analysis useful for your trading day❤️

USOIL Today's Trading Strategy Hope this helps you
### Factors Influencing Long Positions in Crude Oil
#### Seasonal Demand Growth
Summer typically sees a surge in crude oil demand as increased travel and industrial activities drive up consumption. For example, gasoline demand in the U.S. rises significantly during summer due to higher public travel, providing support for crude oil prices and creating opportunities for long positions.
#### Geopolitical Factors
Conflicts, political instability, or sanctions in major oil-producing regions can disrupt or reduce crude oil supply, pushing prices higher. Although Middle Eastern tensions have eased recently, news of a potential Israeli attack on Iranian nuclear facilities previously caused oil prices to jump 3%. Escalating geopolitical tensions would favor long positions in crude oil.
#### Inventory Levels
A decline in crude oil inventories signals tighter supply, which may drive price increases. When inventory data falls below expectations, market concerns about supply shortages intensify, pushing prices higher and creating opportunities for long positions.
USOIL Today's Trading Strategy Hope this helps you
USOIL BUY@60.5~61
SL:59.5
TP:62~62.5

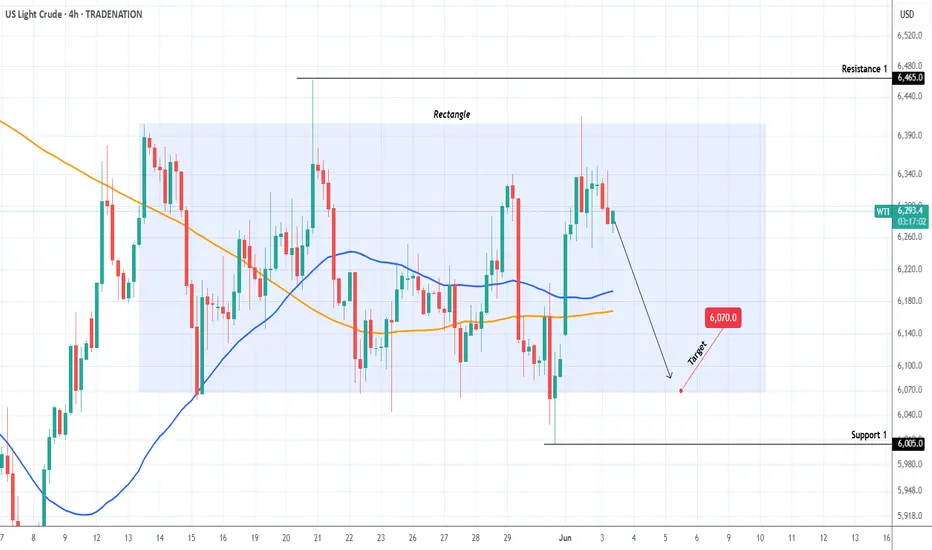
WTI OIL The perfect scalping Rectangle.WTI Oil (USOIL) has been trading within a 3-week Rectangle pattern since the May 13th High and yesterday it got rejected on its top. This is a technical sell signal, with it natural target being the bottom of the pattern at $60.70.
-------------------------------------------------------------------------------
** Please LIKE 👍, FOLLOW ✅, SHARE 🙌 and COMMENT ✍ if you enjoy this idea! Also share your ideas and charts in the comments section below! This is best way to keep it relevant, support us, keep the content here free and allow the idea to reach as many people as possible. **
-------------------------------------------------------------------------------
Disclosure: I am part of Trade Nation's Influencer program and receive a monthly fee for using their TradingView charts in my analysis.
💸💸💸💸💸💸
👇 👇 👇 👇 👇 👇
USOIL next week trend analysis, hope it helps youLimited support on the demand side
- Seasonal factors: The U.S. summer travel peak has begun, with gasoline demand increasing by approximately 3% month-on-month, but warm winter conditions have caused heating oil consumption to decline by 5% year-on-year .
- Economic outlook: Expectations for a slowdown in global economic growth have intensified, with the International Monetary Fund (IMF) latest report cutting its 2025 global GDP growth forecast to 2.8%. Downgraded growth expectations for major economies may curb crude oil consumption potential .
- New energy substitution: Global new energy vehicle sales grew by 25% year-on-year in 2025, and combined with improvements in fuel efficiency, the elasticity of crude oil demand continues to decline.
USOIL next week trend analysis, hope it helps you
USOIL SELL@61~60.5
SL:62
TP:60~59.5

USOIL next week trend analysis, hope it helps you
US WTI crude oil rose more than 4.5% in May, but OPEC+ agreed on Saturday to continue increasing oil production by 411,000 barrels per day for the third consecutive month. The market is preparing for a new round of supply injection from OPEC+, with hedge funds accelerating bearish bets on oil prices. Bearish bets on Brent crude have reached their highest level since October last year. In the week ending May 27, money managers increased their short positions in Brent crude futures by 16,922 lots to 130,019 lots; meanwhile, CFTC data showed that bearish bets on WTI crude also rose to a three-week high. Even during the summer driving season, bearish bets on gasoline rose to a four-week high.
Under the dual impact of increased supply and weak demand, investors lack confidence in the crude oil market. The market is shrouded in thick bearish sentiment, with a large number of investors choosing to sell crude oil-related assets. This selling behavior can form a chain reaction, further pushing down crude oil prices. As long as the fundamentals of supply and demand do not improve significantly, market pessimism will continue to dominate, creating conditions for a downward trend in crude oil prices.
based on the current situation of surging supply-side pressure, weak demand, and thick bearish sentiment in the crude oil market, crude oil prices have significant downside potential and offer certain short-selling opportunities.
USOIL next week trend analysis, hope it helps you
USOIL SELL@61~60.5
SL:62
TP:60~59.5

WTI Crude Oil sideways consolidation capped at 6360Trend: The sentiment remains bearish, in line with the prevailing downward trend.
Recent Movement: Price is currently in a sideways consolidation, suggesting indecision near short-term lows.
Key Levels
Resistance:
6360 – Key resistance and prior consolidation zone.
Above that: 6440, then 6530 – Next upside targets if breakout occurs.
Support:
6020 – Initial downside target.
Below that: 5940, then 5820 – Deeper support levels if bearish momentum resumes.
Trading Scenarios
Bearish Continuation:
A rally to 6360 followed by rejection could lead to a drop toward 6020, 5940, and 5820.
Bullish Breakout:
A daily close above 6360 would negate the bearish setup and open the path for a recovery toward 6440, then 6530.
Conclusion
WTI Crude Oil remains under bearish pressure, but is currently range-bound. A rejection at 6360 would confirm downside continuation. A breakout above that level would shift bias to bullish, targeting higher resistance zones. Watch 6360 as the key pivot.
This communication is for informational purposes only and should not be viewed as any form of recommendation as to a particular course of action or as investment advice. It is not intended as an offer or solicitation for the purchase or sale of any financial instrument or as an official confirmation of any transaction. Opinions, estimates and assumptions expressed herein are made as of the date of this communication and are subject to change without notice. This communication has been prepared based upon information, including market prices, data and other information, believed to be reliable; however, Trade Nation does not warrant its completeness or accuracy. All market prices and market data contained in or attached to this communication are indicative and subject to change without notice.

Crude oil is moving upward again, testing 63 today
💡Message Strategy
The Organization of the Petroleum Exporting Countries and its allies (OPEC+) met at their headquarters in Vienna on Wednesday to assess the current oil market situation. WTI crude oil prices climbed above $62 as OPEC+ said there would be no immediate change to current production policies.
📊Technical aspects
From the daily chart level, the medium-term moving average system suppresses the rebound of oil prices, and the medium-term objective trend is downward. After the oil price hit the low point of 55.20, the frequent alternation of long and short positions formed, and the embryonic form of a falling flag relay appeared from the shape. Pay attention to the strength of the oil price testing the upper edge of the flag. It is expected that after the medium-term trend fluctuates, it will still rise to the 64 position.
The short-term (1H) trend of crude oil fluctuates upward, and the oil price breaks through the 62.5 resistance level. The moving average system diverges and arranges upward, and the short-term objective trend direction is upward. In terms of momentum, the MACD indicator is above the zero axis and the golden cross opens upward, and the bullish momentum is sufficient. It is expected that the crude oil trend will continue to rise within the day.
💰 Strategy Package
Long Position: 61.20-62.00

USOIL Today's Trading Strategy Hope this helps you
The situation in the Middle East remains highly tense, with the Iran nuclear negotiations stalled and U.S. sanctions against Iran still in place. The two sides have significant differences on key issues such as nuclear facility inspections and conditions for lifting sanctions. Israel's military threats against Iran's nuclear facilities have continued to escalate, repeatedly stating publicly that it does not rule out launching military strikes against Iran. In the event of a conflict, as a major crude oil producer, Iran's crude oil production and exports would be severely disrupted, and oil transportation routes in the Middle East could also be blocked, creating a huge gap in global crude oil supply. At the same time, the geopolitical rivalry between Russia and Western countries in the energy sector has intensified, and geopolitical conflicts could lead Russia to adjust its crude oil export strategy, further exacerbating supply tensions in the global crude oil market and driving oil prices sharply higher.
Although OPEC+ accelerated production increases by 822,000 barrels per day in May-June, the remaining production capacity of major producers such as Saudi Arabia has fallen below 1.5 million barrels per day, making it difficult to effectively fill the supply gap left by Iran. Moreover, the production increase plan will be completed by October 2025, one year ahead of the original schedule, indicating concerns about long-term weak demand, which could instead undermine market confidence in supply flexibility.
USOIL Today's Trading Strategy Hope this helps you
USOIL BUY@60.5~61
SL:59.5
TP:62~62.5

USOIL Expected Growth! BUY!
My dear subscribers,
My technical analysis for USOIL is below:
The price is coiling around a solid key level - 60.68
Bias - Bullish
Technical Indicators: Pivot Points Low anticipates a potential price reversal.
Super trend shows a clear buy, giving a perfect indicators' convergence.
Goal - 61.41
My Stop Loss - 60.25
About Used Indicators:
By the very nature of the supertrend indicator, it offers firm support and resistance levels for traders to enter and exit trades. Additionally, it also provides signals for setting stop losses
Disclosure: I am part of Trade Nation's Influencer program and receive a monthly fee for using their TradingView charts in my analysis.
———————————
WISH YOU ALL LUCK

Market Analysis: WTI Crude Oil Price Could Gain Bullish PaceMarket Analysis: WTI Crude Oil Price Could Gain Bullish Pace
WTI Crude Oil is gaining bullish momentum and might even test $62.75.
Important Takeaways for WTI Crude Oil Price Analysis Today
- WTI Crude Oil climbed above the $60.50 and $60.80 resistance levels.
- There was a break above a key bearish trend line with resistance at $60.80 on the hourly chart of XTI/USD at FXOpen.
WTI Crude Oil Price Technical Analysis
On the hourly chart of WTI Crude Oil at FXOpen, the price started a fresh upward move from $59.45 against the US Dollar. The price gained bullish momentum after it broke the $60.00 resistance.
The bulls pushed the price above the 50% Fib retracement level of the downward move from the $62.76 swing high to the $59.45 low. The price even climbed above the 50-hour simple moving average. Besides, there was a break above a key bearish trend line with resistance at $60.80.
It tested the $61.50 resistance zone and the 61.8% Fib retracement level of the downward move from the $62.76 swing high to the $59.45 low.
The RSI is now near the 50 level and the price could aim for more gains. If the price climbs higher again, it could face resistance near $62.00. The next major resistance is near the $62.75 level. Any more gains might send the price toward the $63.45 level or even $65.00.
Conversely, the price might correct gains and test the $60.80 support level. The next major support on the WTI Crude Oil chart is near the $59.45 zone, below which the price could test the $58.00 zone.
If there is a downside break, the price might decline toward $56.50. Any more losses may perhaps open the doors for a move toward the $55.50 support zone.
This article represents the opinion of the Companies operating under the FXOpen brand only. It is not to be construed as an offer, solicitation, or recommendation with respect to products and services provided by the Companies operating under the FXOpen brand, nor is it to be considered financial advice.

USOIL BEARS ARE GAINING STRENGTH|SHORT
USOIL SIGNAL
Trade Direction: short
Entry Level: 63.56
Target Level: 56.12
Stop Loss: 68.51
RISK PROFILE
Risk level: medium
Suggested risk: 1%
Timeframe: 1D
Disclosure: I am part of Trade Nation's Influencer program and receive a monthly fee for using their TradingView charts in my analysis.
✅LIKE AND COMMENT MY IDEAS✅

USOIL:Sharing of the Trading Strategy for Next WeekAll the trading signals this week have resulted in profits!!! Check it!!!👉👉👉
Fundamental Analysis:
Uncertainty over the OPEC+ production increase plan continues to unsettle markets. If the 增产 (production hike) is implemented, increased supply will pressure oil prices.
Meanwhile, uneven global economic recovery has impacted crude oil demand expectations.
Technical Analysis:
Daily candlestick charts show prices oscillating within a $59–$63 range. The MACD indicator remains below the zero line, with bearish signals persisting.
The 50-day moving average forms strong resistance near $63, while $58.9 serves as key support.
Trading Strategy:
Await rebounds to initiate short positions.
Trading Strategy:
Sell@63-62
TP:60-59
Share accurate trading signals daily—transform your life starting now!
👇 👇 👇 Obtain signals👉👉👉
WTI CRUDE OIL: Repeated rejections on the 1D MA50.WTI Crude Oil is neutral on its 1D technical outlook (RSI = 46.483, MACD = -0.530, ADX = 16.270) as it is trading sideways for the past 2 weeks, unable however to cross above the 1D MA50, which along with the LH trendline, keep the trend bearish. Sell and aim for thr S1 level (TP = 56.00). Emerging Bearish Cross also on the 1D MACD.
## If you like our free content follow our profile to get more daily ideas. ##
## Comments and likes are greatly appreciated. ##

USOIL next week trend analysis, hope it helps youOPEC+ confirmed at its meeting on May 31 that eight oil-producing countries under its mechanism will continue to increase production by 411,000 barrels per day (bpd) in July, maintaining the same pace as in May and June. Although the market had partially priced in this expectation, the continuation of the production increase plan has strengthened the long-term logic of loose supply. It is worth noting that this production increase is not a unified action by the entire alliance but rather the result of core members such as Saudi Arabia and Russia voluntarily exiting production cuts, reflecting cautious attitudes within OPEC+ toward demand prospects. With oil prices currently breaking below the key psychological threshold of $60 per barrel, if the production increase plan continues into the second half of the year, it may further suppress the upside room for oil price rebounds.
USOIL next week trend analysis, hope it helps you
USOIL SELL@61~60.5
SL:62
TP:60~59.5

WTI OIL Rejection on 1D MA50 aims at $56.50.WTI Oil (USOIL) has been trading within a 13-month Channel Down pattern and is currently under heavy pressure by multiple Resistance levels.
The immediate one is the 1D MA50 (blue trend-line), which has its most recent rejection last Wednesday (May 21) and as you can see, the price has failed to break above it, even though it's been trading directly below it.
As long as the 1D MA50 holds, we expect a test of the lower Support Zone at $56.50, similar to the September - December 2024 Support Zone, which was tested continuously after several 1D MA50 rejections.
-------------------------------------------------------------------------------
** Please LIKE 👍, FOLLOW ✅, SHARE 🙌 and COMMENT ✍ if you enjoy this idea! Also share your ideas and charts in the comments section below! This is best way to keep it relevant, support us, keep the content here free and allow the idea to reach as many people as possible. **
-------------------------------------------------------------------------------
💸💸💸💸💸💸
👇 👇 👇 👇 👇 👇

WTI Crude Oil 4H Chart – Bullish Setup from Demand Zone📈 Current Price: $61.74
🔵 Key Zones & Levels
🔹 Demand Zone (Buy Area):
🟦 $59.48 – $61.39
→ Price expected to bounce here
→ 🔄 Potential reversal zone
🔹 Entry Point:
🎯 $61.39
→ Ideal level to enter LONG
→ Just above demand zone
🔹 Stop Loss:
🛑 Below $59.48
→ Exit if price drops here
→ Protects capital
🔹 Target Point:
🚀 $67.00
→ Profit-taking zone
→ Strong resistance zone nearby:
* 66.63
* 66.75
* 67.60
📊 Indicators
📍 EMA (70): 🔴 61.40
→ Price trading above = bullish signal
→ EMA acting as support
📏 Trendline Channel:
🔼 Higher highs & higher lows
→ Supports uptrend continuation
📌 Trade Plan Summary
* Bias: 📈 Bullish
* Buy: At 61.39
* Stop: Below 59.48 🛑
* Target: 67.00 🎯
* Risk-Reward: ✔️ Favorable (~1:3)
🔍 What to Watch
* ✅ Bullish candles in demand zone
* 🔁 Retest of EMA or lower channel
* ❌ Avoid if it breaks below $59.48

USOIL SELLERS WILL DOMINATE THE MARKET|SHORT
USOIL SIGNAL
Trade Direction: short
Entry Level: 61.25
Target Level: 56.17
Stop Loss: 64.55
RISK PROFILE
Risk level: medium
Suggested risk: 1%
Timeframe: 1D
Disclosure: I am part of Trade Nation's Influencer program and receive a monthly fee for using their TradingView charts in my analysis.
✅LIKE AND COMMENT MY IDEAS✅

Potential bullish rise?WTI Oil (XTI/USD) has bounced off the pivot and could rise the 1st resistance which is a pullback resistance.
Pivot: 61.68
1st Support: 60.72
1st Resistance: 63.49
Risk Warning:
Trading Forex and CFDs carries a high level of risk to your capital and you should only trade with money you can afford to lose. Trading Forex and CFDs may not be suitable for all investors, so please ensure that you fully understand the risks involved and seek independent advice if necessary.
Disclaimer:
The above opinions given constitute general market commentary, and do not constitute the opinion or advice of IC Markets or any form of personal or investment advice.
Any opinions, news, research, analyses, prices, other information, or links to third-party sites contained on this website are provided on an "as-is" basis, are intended only to be informative, is not an advice nor a recommendation, nor research, or a record of our trading prices, or an offer of, or solicitation for a transaction in any financial instrument and thus should not be treated as such. The information provided does not involve any specific investment objectives, financial situation and needs of any specific person who may receive it. Please be aware, that past performance is not a reliable indicator of future performance and/or results. Past Performance or Forward-looking scenarios based upon the reasonable beliefs of the third-party provider are not a guarantee of future performance. Actual results may differ materially from those anticipated in forward-looking or past performance statements. IC Markets makes no representation or warranty and assumes no liability as to the accuracy or completeness of the information provided, nor any loss arising from any investment based on a recommendation, forecast or any information supplied by any third-party.

USOIL – Reclaiming the Energy Narrative | WaverVanir Macro Rever📉 Chart Thesis:
After nearly three years of structural decline from the $129 peak, crude oil (USOIL) is approaching a confluence zone of historic Fibonacci support ($56–$60) and a multi-year descending trendline.
This zone may mark the bottom of a long-term accumulation phase.
🧠 Strategic Perspective (WaverVanir View):
“It’s time to take back our resource. Not just politically—but economically, institutionally, and structurally.”
WaverVanir International LLC sees this setup as a rare macro pivot. This isn’t about short-term fluctuations—it’s about the global realignment of resource value in a world where:
Central banks are overleveraged
Strategic petroleum reserves are drawn down
War premium is mispriced
Real assets are undervalued
📊 Key Levels:
Support Zone: $56.04 (historical institutional buy zone)
Breakout Trigger: Trendline above $67.00
Target 1: $101.35 (0.786 Fib)
Target 2: $129.42 (1.0 Fib)
Target 3: $160.58 (1.236 Fib projection)
⚠️ Risk Disclosure:
We are not yet capitalized but actively building a legally compliant funding vehicle. No capital is currently allocated. This post is part of our vision publication cycle to build trust and transparency in WaverVanir’s thesis.
📌 Follow WaverVanir International LLC for conviction-based macro trade ideas at the intersection of data science, price action, and risk strategy.
#USOIL #MacroTrading #Commodities #WaverVanir #TradingView #QuantMacro #EnergyRevolution #FibonacciAnalysis #MarketStructure #EmergingFund

WTI Crude Returns to $63Over the past two trading sessions, WTI crude oil has gained more than 5%, as confidence has temporarily returned to the market following the latest OPEC+ announcements. The organization recently announced a new production increase of 411,000 barrels per day starting in July, but the volume was lower than anticipated, which has been interpreted as a positive signal for short-term price behavior. This has helped sustain a consistent bullish bias in recent sessions.
Bearish Trend Remains Intact
Since early January, crude oil has followed a steady bearish trend. Currently, the price is approaching the resistance marked by the trendline, and if buying pressure holds in the short term, the bearish formation could come under threat in the upcoming trading sessions.
MACD
At the moment, the MACD histogram shows slight oscillations above the neutral line (0), but it has not yet indicated a decisive market impulse. As a result, a strong sense of short-term neutrality persists, as the price approaches key resistance levels.
RSI
The Relative Strength Index (RSI) is showing a similar pattern: the line is starting to rise, but it is flattening out, which could be weakening the current buying momentum and signaling a possible sideways movement in the short term.
Key Levels to Watch:
$63 – Current Barrier: Aligns with the bearish trendline and could be where price indecision intensifies, leading to continued consolidation.
$57 – Major Support: A recent low. If the price returns to this level, it could reactivate the bearish trend and lead to a deeper sell-off.
$68 – Key Resistance: Located around the 200-period moving average. A breakout above this level could mark the beginning of a new long-term bullish trend.
Written by Julian Pineda, CFA – Market Analyst

USOIL - Bullish Double BottomHello Traders !
The USOIL price formed a double bottom pattern.
Currently, The neckline is broken !
So, I expect a bullish move🚀
_______________
TARGET: 63.49🎯

CRUDE OIL Swing Short! Sell!
Hello,Traders!
USOIL keeps growing
And Oil is locally overbought
So after the price hit a very
Strong resistance level
Around 65.00$ we will be
Expecting a pullback and
A local bearish correction
Sell!
Comment and subscribe to help us grow!
Check out other forecasts below too!
Disclosure: I am part of Trade Nation's Influencer program and receive a monthly fee for using their TradingView charts in my analysis.
