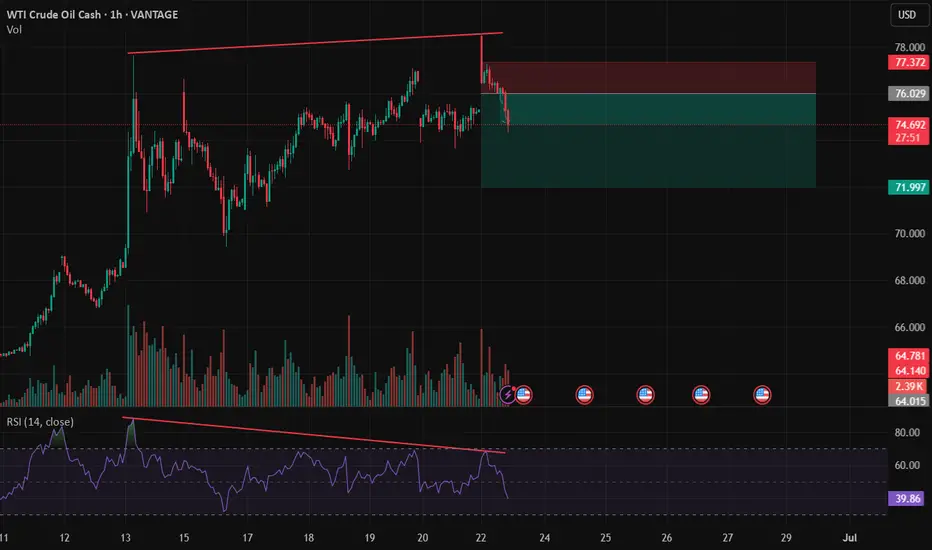
Crude oil is displaying serious weaknessCrude oil is trapped in a descending triangle after a blow off top. might take some time to play out but target for crude oil based on the triangle is 42-40 crude oil.
USOIL trade ideas

Today's crude oil trading strategy, I hope it will be helpful toThree Driving Logics Behind Oil Price Collapse: From Geopolitical Ebb to Supply Loosening
(1) The "Security Pledge" for Strait of Hormuz Materializes
As the "lifeblood" for 30% of global seaborne crude oil, blockade expectations for the Strait of Hormuz were the core support for oil prices above $75. However, during the recent attacks, Iran deliberately avoided the strait's vicinity and even issued navigation safety bulletins via the International Maritime Organization (IMO)—this explicit signal of "no supply disruption" eliminated market panic over a "11 million bpd supply outage." Historical parallels show that after Iran attacked U.S. bases in 2020, oil prices surged 4.5% before rapidly reversing to a 1% decline due to the same "uninterrupted supply" logic—a pattern repeating today.
(2) OPEC+ Production Hike Expectations "Undercut the Foundation"
Despite escalating geopolitical tensions, OPEC+ has stuck to its plan to increase output by 411,000 bpd in July, with producers like Saudi Arabia hinting at "further capacity releases if necessary." This combination of "production pledge + supply stability" directly hedges against geopolitical risk premiums. More crucially, while U.S. crude inventories dropped by 11.47 million barrels last week, strategic reserve replenishment demand remains uninitiated, leaving markets focused on potential "oversupply" from OPEC+'s actual production increases.
(3) Aftermath of Trump's "Ceasefire Smokescreen"
Trump's earlier announcement of a "comprehensive Israel-Iran ceasefire"—though unconfirmed by official sources—planted expectations of "conflict resolution" in the market. When Iran opted for "symbolic attacks" over all-out retaliation, capital accelerated its exit from geopolitical risk exposures: data shows WTI net long positions have dropped from 179,100 contracts to 123,000 contracts, with the rapid exodus of speculative capital amplifying price declines.
Today's crude oil trading strategy, I hope it will be helpful to you
USOIL sell@64~64.5
SL:66
TP1:63.5~63

WTI Wave Analysis – 23 June 2025
WTI: ⬇️ Sell
- WTI reversed from the resistance area
- Likely to fall to support level 65.00
WTI crude oil recently reversed down from the resistance area located between the pivotal resistance level 76.45 (which has been reversing the price from the middle of last year), the upper weekly Bollinger Band and the resistance trendline of the weekly down channel from 2024.
The downward reversal from this resistance zone stopped the C-wave of the earlier weekly ABC correction (4) from April.
Given the clear weekly downtrend, WTI crude oil can be expected to fall to the next support level 65.00 (a former yearly low from 2024).

Crude Oil Trade Setup – Macro Narrative Aligned | WaverVanir DSS📍Instrument: WTI Crude Oil (USOIL)
📊Timeframe: 15M | Methodology: Smart Money Concepts + Fibonacci + Volume Profile + ORB
🔍Framework: VolanX DSS | WaverVanir International LLC
📈 Trade Thesis
While much of the world remains fixated on short-term rate expectations and gold/oil volatility, this chart reflects clear SMC structure aligned with the macro backdrop:
Geopolitical Tensions in the Middle East and strategic energy hoarding by global players continue to apply pressure to oil supply narratives.
Inventories remain tight while BRICS+ nations move toward commodity-backed currency talks—oil being the anchor.
The Fed’s neutral stance combined with softening global PMIs points to a fragile growth phase, supporting rebalancing trades into tangible assets like oil.
🧠 Technical Breakdown
Premium/Discount Model in Play:
Current price retraced after rejecting the premium zone at 77.10 with strong bearish volume and confluence at the 1.0 Fib level.
Buy Zone 1:
Around 75.26, near 0.618 retracement—ideal for short-term scalpers with tight invalidation.
Buy Zone 2:
74.18–73.85 marked as Discount OB zone + ORB LOD + VWAP deviation.
Liquidity engineered below BOS—favorable risk-reward for swing re-entry.
Volume Spike Confirmation near 73.90 during London session sweep = high-probability demand.
🧭 Trade Plan
✅ Entry #1: 75.26 – Speculative order flow entry
✅ Entry #2: 74.18 – Confirmed bullish OB zone
🛑 SL: Below 73.70 (invalidates BOS reclaim + OB)
🎯 TP: 77.10 (weak high) and partials at 76.00–76.50
⚠️ Trailing stop after reclaiming 75.70
🧠 Narrative Alignment
As the world shifts toward resource realism, oil becomes more than a trade—it's a proxy for power, policy, and protectionism. This isn’t just a chart—it's a window into the realignment of global influence.
📌 Volatility will be harvested. Order will emerge from imbalance.
—
#CrudeOil #SmartMoneyConcepts #WTI #MacroTrading #WaverVanir #VolanX #OrderFlow #EnergyMarkets #BRICS #FibonacciStrategy #LiquiditySweep #TradingView #TraderMindset

USOIL: Target Reached!Noice! I mean my dss is fully functional and working ! This is going to be my permanant edge.

Oil’s Reaction to Geopolitical DevelopmentsOil’s Reaction to Geopolitical Developments
We must be cautious when trading oil.
Despite the unexpected attack by Israel on Iran last week, gold prices did not rise beyond $77.50.
In my view, oil prices remain largely under the influence of the U.S. and OPEC+, with Trump opposing any significant price increase.
Iran ranks as one of the world's top oil producers, holding the fifth position in daily output. However, it is surprising that prices did not exceed $77.50, especially considering past instances of major price surges during the Russia-Ukraine war.
Even if oil rebounds toward $80, this movement could be purely speculative, with a high likelihood of a pullback, as indicated by the technical chart.
Key target zones: 67.00 ; 64 and 56.50
You may find more details in the chart!
Thank you and Good Luck!
❤️PS: Please support with a like or comment if you find this analysis useful for your trading day❤️

Is the oil market signalling de-escalation?After an initial 6% spike at the open, U.S. crude oil futures reversed sharply—falling into negative territory—as markets priced in the possibility that Iran's latest retaliation may be more symbolic than escalatory.
According to President Donald Trump, Iran gave advance notice before launching missiles at a U.S. base in Qatar, allowing defences to intercept the attack and resulting in no reported casualties.
While Tehran publicly described the strike as “devastating and powerful,” the lack of impact on the ground and the pre-warning have fuelled speculation that Iran was aiming to save face without triggering a broader conflict.
The swift reversal in oil prices reflects that sentiment. For now, the market appears to be signaling that escalation may pause here.

WTI CRUDE OIL: Massive 4H MA50 bearish breakout.WTI Crude Oil has turned neutral again on its 1D technical outlook (RSI = 48.933, MACD = 2.900, ADX = 47.682) as it just broke with force under the 4H MA50. Every time this has taken place in the recent past, a strong downtrend followed. The last such selling sequence dropped by -23.71%. The 4H RSI is on the exact same spot as then. We are bearish, TP = 59.00.
See how our prior idea has worked out:
## If you like our free content follow our profile to get more daily ideas. ##
## Comments and likes are greatly appreciated. ##

US CRUDE OIL LONG RESULT Crude Oil price has been in an overall bullish trend and after it broke out of the previously formed symmetrical triangle.
Tried to get in earlier but wasn't getting enough pullback levels tapped.
Almost got our S.l hit and also missed the Tp but still managed to close in profits.
_THE_KLASSIC_TRADER_.

Predicted with good analysisIn light of the world global chaos, the markets reacted accordingly. The analysis, speaks for itself. Be vigilant and manage risk accordingly - always.

KOG - OILQuick look at Oil. There is a pivot here in the golden zone around the 70.5 level which we can dip into. Above that level, we would be looking for higher oil with the potential target level on the chart. Note, oil is due a huge pull back, so rejection from one of these resistance levels can give us that pull back in order to get better pricing to long.
We've added the red boxes from the indicator to help you navigate the move.
Please do support us by hitting the like button, leaving a comment, and giving us a follow. We’ve been doing this for a long time now providing traders with in-depth free analysis on Gold, so your likes and comments are very much appreciated.
As always, trade safe.
KOG

BEARISH BAT ON USOIL was a huge successWhat a successful trading opportunity on usoil, the bearish bat pattern was in alignment with the weekly order block. A full video breakdown of this trade and more will be posted soon, and the link is attached to this video for you all to learn.

USOIL - BullishUSOIL is testing its support level after a good retracement. This is also a trend line support. Buying at current level with stop loss below support level.

Crude Oil Strategy LayoutThe rise in oil prices on Monday will not only push up household daily expenses such as fuel and heating costs, but also increase corporate operating costs, which may in turn suppress consumption and investment activities. Ellen Zentner, Chief Economic Strategist at Morgan Stanley, pointed out in a Sunday analysis that against the backdrop of the Trump administration's high tariff policies, the U.S. economy was already facing pressure from a slowdown in growth, and the further increase in oil prices would exert "powerful pressure" on household consumption capacity. This may not only weaken consumers' willingness to purchase, but also drag down the pace of overall economic growth.
Crude oil showed a gap-up and then decline trend today, falling sharply from around $77.7. Oil prices gradually corrected today, with the lowest point touching around $72.5 and hovering there. Currently, oil prices are hovering above the support level of 72.0, which is expected to be the bottom support of the box movement. Taken together, crude oil is in a high-range consolidation. In terms of operation, it is considered to lay out long positions on pullbacks.
you are currently struggling with losses,or are unsure which of the numerous trading strategies to follow,You have the option to join our VIP program. I will assist you and provide you with accurate trading signals, enabling you to navigate the financial markets with greater confidence and potentially achieve optimal trading results.
Trading Strategy:
buy@72.0-72.5
TP:75.0-75.5

Crude Oil Eyes 3-Year Channel BreakoutCrude Oil trades between Israel-Iran-Conflict supply risks, overbought momentum, and the potential for a 3-year channel breakout.
While upside risks from a possible Strait of Hormuz closure remain uncertain, a firm hold above $78 could extend gains toward $80 and $83.50, keeping oil on a bullish edge for H2 2025.
A pullback into the channel may ease inflation concerns and reassert bearish pressure below the $80 mark. Key support lies at $72 for a potential downside resumption.
- Razan Hilal, CMT

Crude Oil Declines After $78.00 Rejection: Eyes on ReboundFenzoFx—Oil is declining after being rejected from $78.00, heading toward key support at $73.86—an area backed by high volume and demand.
If $73.86 holds, a bullish move toward $78.00 and potentially $82.00 could follow.

USOIL Is Very Bullish! Long!
Take a look at our analysis for USOIL.
Time Frame: 1D
Current Trend: Bullish
Sentiment: Oversold (based on 7-period RSI)
Forecast: Bullish
The market is on a crucial zone of demand 73.546.
The oversold market condition in a combination with key structure gives us a relatively strong bullish signal with goal 79.365 level.
P.S
We determine oversold/overbought condition with RSI indicator.
When it drops below 30 - the market is considered to be oversold.
When it bounces above 70 - the market is considered to be overbought.
Disclosure: I am part of Trade Nation's Influencer program and receive a monthly fee for using their TradingView charts in my analysis.
Like and subscribe and comment my ideas if you enjoy them!

WTI Crude Oil (USOIL) Technical Analysis: Bullish Reversal FacesOf course. Here is a detailed analysis of the provided financial chart for USOIL (WTI Crude Oil).
### Executive Summary
This is a **weekly (1W) Heikin Ashi chart** for CFDs on WTI Crude Oil (USOIL). The chart displays a long-term view, with a prominent downtrend from a peak in 2022. However, there has been a very strong bullish reversal in the most recent weeks. The analysis points to a critical juncture where the price is testing a key long-term resistance level. The bullish momentum is strong, but it faces significant hurdles ahead.
### Detailed Breakdown
#### 1. Asset and Chart Type
* **Asset:** USOIL (WTI Crude Oil), traded as a Contract for Difference (CFD).
* **Timeframe:** 1W (Weekly). Each candle represents one week of price action. This chart is used for analyzing long-term trends.
* **Chart Type:** Heikin Ashi. Unlike standard candlesticks, Heikin Ashi candles are calculated using averages, which smooths out price action and makes trends easier to identify. Long green candles with no lower wicks indicate strong buying pressure, while long red candles with no upper wicks indicate strong selling pressure.
#### 2. Current Price Action
* The last visible candle is a **strong green Heikin Ashi candle**, indicating significant bullish momentum during that week.
* The data for this candle shows: **Open 69.22, High 77.10, Low 69.22, Close 75.41**. This represents a gain of **+4.19%** for the week.
* The price has bounced sharply from a recent low and is now in its third consecutive week of gains.
#### 3. Key Technical Indicators
**a) Fibonacci Retracement:**
* This tool is drawn from a significant low (marked as 1 at **$68.01**) to a major high (marked as 0 at **$123.24**). It's used to identify potential support and resistance levels.
* The price has been trading between the 0.618 and 1 levels for a prolonged period.
* The recent low was found just below the `1` level ($68.01), indicating a potential double-bottom or failure to break lower.
* The price has since reclaimed the `0.786` level ($79.83) and is currently trading around the **$75.41** mark. The next major resistance levels based on this tool are:
* **0.786:** $79.83
* **0.618:** $89.11
* **0.5:** $95.63
**b) Moving Average (MA):**
* A **50-period Moving Average (MA 50)** is present on the chart (the blue line), with a current value of **69.89**.
* On a weekly chart, the 50-week MA is a critical long-term trend indicator.
* The price has been consistently below the 50-week MA since late 2022, confirming the long-term bearish trend.
* **Crucially, the current price is attempting to break above this moving average.** A sustained close above the 50-week MA would be a strong bullish signal. Conversely, if this level acts as resistance and the price is rejected, it could signal a continuation of the downtrend.
**c) Relative Strength Index (RSI):**
* The RSI (14) is shown at the bottom. The purple line (RSI) is currently at **63.33** and its moving average (yellow line) is at **41.95**.
* The RSI is pointing upwards and has decisively crossed above its moving average, indicating **building bullish momentum**.
* It is not yet in the "overbought" territory (typically above 70), which suggests there could be more room for the price to move higher before becoming extended.
**d) Fibonacci Time Zones:**
* The vertical blue lines numbered 0, 1, 2, 3, 5, 8 are Fibonacci Time Zones. They are used to forecast potential turning points in the market based on time intervals.
* The recent major low occurred very close to the "8" time zone marker, which may have contributed to the timing of this reversal.
### Synthesis and Potential Scenarios
* **Bullish Scenario:** The combination of strong green Heikin Ashi candles, a rising RSI, and a bounce from a key long-term low points to strong short-term bullish momentum. If the price can decisively break and hold above the **50-week MA (around $70)** and the **Fibonacci 0.786 level ($79.83)**, the next major target would be the **0.618 level at $89.11**.
* **Bearish Scenario:** The long-term trend remains bearish as long as the price is below the 50-week MA. This level, combined with the psychological resistance at $80, could prove to be a formidable barrier. If the price fails to break through, it could be rejected back down to test recent lows around the **$68.00** area.
In conclusion, the chart shows a classic battle between short-term bullish momentum and a long-term bearish trend. The price's interaction with the **50-week moving average** in the coming weeks will be critical in determining the next major directional move for WTI Crude Oil.

#USOIL - CUT n REVERSE region, still holds??#USOIL.. well guys in first go market perfectly holds our region then again n again..
Now again. Market is in our resistance region and if market hold again then again drop expected.
But
Keep in mind that above that region new will go for cut n reverse on confirmation .
Good luck
Trade wisely

Oil buy setup H1Hello! Friends,
Greetings. Please leave a Like if you like the idea.
Before start talking about technical Let's share your LOVE by giving me LIKES to support this work. Thanks in advance.

Double topDouble top with RSI divergency. If you have the strength to ride all the way down to neck line you going to be well rewarded.
USOIL Bullish breakout from symmetrical triangle pattern🚨 USOIL Breakout Alert! 🚨
1H Time Frame | Symmetrical Triangle Breakout
Crude oil (USOIL) has broken out bullishly from a symmetrical triangle pattern — confirming strong upward momentum. 📈
🎯 Entry Level: 74.20
📍 Technical Targets:
1st Resistance: 75.70
2nd Resistance: 76.80
This setup signals a potential continuation of bullish momentum. Keep an eye on volume confirmation and price action near resistance levels.
💬 Drop your thoughts in the comments!
📲 Like, follow, and join us for more real-time market insights.
Trade smart
,
– Livia 😜

WTI Oil H4 | Multi-swing-low support at 61.8% Fibo retracementWTI oil (USOIL) is falling towards a multi-swing-low support and could potentially bounce off this level to climb higher.
Buy entry is at 72.92 which is a multi-swing-low support that aligns with the 61.8% Fibonacci retracement.
Stop loss is at 69.10 which is a level that lies underneath a swing-low support.
Take profit is at 77.60 which is a multi-swing-high resistance.
High Risk Investment Warning
Trading Forex/CFDs on margin carries a high level of risk and may not be suitable for all investors. Leverage can work against you.
Stratos Markets Limited (tradu.com ):
CFDs are complex instruments and come with a high risk of losing money rapidly due to leverage. 63% of retail investor accounts lose money when trading CFDs with this provider. You should consider whether you understand how CFDs work and whether you can afford to take the high risk of losing your money.
Stratos Europe Ltd (tradu.com ):
CFDs are complex instruments and come with a high risk of losing money rapidly due to leverage. 63% of retail investor accounts lose money when trading CFDs with this provider. You should consider whether you understand how CFDs work and whether you can afford to take the high risk of losing your money.
Stratos Global LLC (tradu.com ):
Losses can exceed deposits.
Please be advised that the information presented on TradingView is provided to Tradu (‘Company’, ‘we’) by a third-party provider (‘TFA Global Pte Ltd’). Please be reminded that you are solely responsible for the trading decisions on your account. There is a very high degree of risk involved in trading. Any information and/or content is intended entirely for research, educational and informational purposes only and does not constitute investment or consultation advice or investment strategy. The information is not tailored to the investment needs of any specific person and therefore does not involve a consideration of any of the investment objectives, financial situation or needs of any viewer that may receive it. Kindly also note that past performance is not a reliable indicator of future results. Actual results may differ materially from those anticipated in forward-looking or past performance statements. We assume no liability as to the accuracy or completeness of any of the information and/or content provided herein and the Company cannot be held responsible for any omission, mistake nor for any loss or damage including without limitation to any loss of profit which may arise from reliance on any information supplied by TFA Global Pte Ltd.
The speaker(s) is neither an employee, agent nor representative of Tradu and is therefore acting independently. The opinions given are their own, constitute general market commentary, and do not constitute the opinion or advice of Tradu or any form of personal or investment advice. Tradu neither endorses nor guarantees offerings of third-party speakers, nor is Tradu responsible for the content, veracity or opinions of third-party speakers, presenters or participants.
