Heading into 61.8% Fibonacci resistance?WTI Oil (XTI/USD) is risng towards the pivot which has been identified as a pullback resistance and could reverse to the 1st suport which acts as a pullback support.
Pivot: 65.64
1st Support: 57.71
1st Resistance: 71.18
Risk Warning:
Trading Forex and CFDs carries a high level of risk to your capital and you should only trade with money you can afford to lose. Trading Forex and CFDs may not be suitable for all investors, so please ensure that you fully understand the risks involved and seek independent advice if necessary.
Disclaimer:
The above opinions given constitute general market commentary, and do not constitute the opinion or advice of IC Markets or any form of personal or investment advice.
Any opinions, news, research, analyses, prices, other information, or links to third-party sites contained on this website are provided on an "as-is" basis, are intended only to be informative, is not an advice nor a recommendation, nor research, or a record of our trading prices, or an offer of, or solicitation for a transaction in any financial instrument and thus should not be treated as such. The information provided does not involve any specific investment objectives, financial situation and needs of any specific person who may receive it. Please be aware, that past performance is not a reliable indicator of future performance and/or results. Past Performance or Forward-looking scenarios based upon the reasonable beliefs of the third-party provider are not a guarantee of future performance. Actual results may differ materially from those anticipated in forward-looking or past performance statements. IC Markets makes no representation or warranty and assumes no liability as to the accuracy or completeness of the information provided, nor any loss arising from any investment based on a recommendation, forecast or any information supplied by any third-party.
USOILSPOT trade ideas

USOIL-crude about to resume lower?WTI formed a large bearish engulfing candle on its daily chart yesterday near the key $65 resistance level. Was that an indication that prices have ended their corrective bounce? Time will tell, but today's oil prices have bounced back. With the trade uncertainty in the background, demand concerns remain high.
So, I wouldn't be surprised if prices were to resume lower from here. The trend is clearly bearish with the moving averages all pointing lower, not to mention the lower highs and lower lows.
If the selling resumes, watch for possible bounces at the next key round handles like $62, $61 and $60. But there is always the possibility of a sweep below this month's earlier lows if macro concerns intensify.
Meanwhile, the bullish idea is off the table for me for now until we see some progress in US-China trade talks at least, or if prices show a major bullish reversal signal.

Bullish on USOILAs the chart shows, in the 1 - hour timeframe, USOIL is in an upward - trending channel 📈. The price fluctuates upwards between two trendlines. Despite pullbacks, the uptrend persists, suggesting short - term bullish dominance. Still, the frequent swings reveal ongoing bull - bear market battles.📈
⚡⚡⚡ USOIL ⚡⚡⚡
🚀 Buy@61.5 - 62.0
🚀 TP 63.5 - 65.0
Accurate signals are updated every day 📈 If you encounter any problems during trading, these signals can serve as your reliable guide 🧭 Feel free to refer to them! I sincerely hope they'll be of great help to you 🌟

USOIL: Bearish Forecast & Outlook
The recent price action on the USOIL pair was keeping me on the fence, however, my bias is slowly but surely changing into the bearish one and I think we will see the price go down.
Disclosure: I am part of Trade Nation's Influencer program and receive a monthly fee for using their TradingView charts in my analysis.
❤️ Please, support our work with like & comment! ❤️

USIOL: Trading Strategy for Next WeekAfter reaching the key resistance level, USOIL started to decline. In the trading next week, when it reaches the vicinity of the resistance level of $64.5, you can continue to go short.
All the signals I sent have been profitable, and I will continue to send accurate signals.
USOIL Trading Strategy:
usoil sell@64.5-65
tp:63-61

USOIL Opening Trends and Trading Strategies Next WeekTrend Analysis
As shown in the chart, in the 1 - hour time frame, USOIL is moving within an upward - trending channel 📈. This channel is defined by two trendlines, and the price is fluctuating upwards within it. Although there have been pullback trends during this period, the overall trend remains upward. This indicates that in the short term, the bullish forces are relatively dominant, driving the price to gradually climb 📈. However, the frequent price fluctuations also reflect a certain degree of game - playing between the bulls and bears in the market 🤺.
⚡⚡⚡ USOIL ⚡⚡⚡
🚀 Buy@61.5 - 62.0
🚀 TP 63.5 - 65.0
Accurate signals are updated every day 📈 If you encounter any problems during trading, these signals can serve as your reliable guide 🧭 Feel free to refer to them! I sincerely hope they'll be of great help to you 🌟

CRUDE OIL Move Down Ahead! Sell!
Hello,Traders!
USOIL was making a
Bullish correction but
It is in the downtrend
Overall, so as the price
Is hovering beneath the
Horizontal resistance
Of 64.80$ from where
We will be expecting a
Local bearish correction
Sell!
Comment and subscribe to help us grow!
Check out other forecasts below too!
Disclosure: I am part of Trade Nation's Influencer program and receive a monthly fee for using their TradingView charts in my analysis.

USOIL: Bears Are Winning! Short!
My dear friends,
Today we will analyse USOIL together☺️
The market is at an inflection zone and price has now reached an area around 63.133 where previous reversals or breakouts have occurred.And a price reaction that we are seeing on multiple timeframes here could signal the next move down so we can enter on confirmation, and target the next key level of 62.366..Stop-loss is recommended beyond the inflection zone.
❤️Sending you lots of Love and Hugs❤️

WTI: B- tradeA page from my trading journal. Please take it with a grain of salt, as I’m still learning and growing 🌟
Bias balance
• Short (Fade 64.50)
– Risk: Small SL (tight)
– Reward: 3–4 points
– Probability: High
– Setup Grade: B
• Long (Breakout > 64.50)
– Risk: Moderate
– Reward: 3–5 points
– Probability: Medium
– Setup Grade: B-

USOIL Potential UpsidesHey Traders, in today's trading session we are monitoring USOIL for a buying opportunity around 60.80 zone, USOIL is trading in an uptrend and currently is in a correction phase in which it is approaching the trend at 60.80 support and resistance area.
Trade safe, Joe.

SHORT OIL Break of support and retest**Oil Sell Setup:**
1. **Entry:**
- Sell at rejection of 0.50 daily Fib + 20 MA confluence
- Wait for bearish confirmation candle
2. **Stop Loss:**
- Place above recent swing high
3. **Take Profit:**
- Target 1: Recent swing low
- Target 2: Previous major swing low
- Target 3: Major support level from higher timeframe
4. **Confirmations:
- Rejection candles at confluence zone
- Failed attempts to close above 20 MA
5. **Management:**
- Scale out at targets
- Move stop to breakeven at first target


Head and shoulder - sellThis is a possible head and shoulder pattern, one neckline is broken and price is creating another shoulder aka pullback before heading down in a reversal after price attempted to push up.

CRUDE OIL BEARISH WEDGE|SHORT|
✅CRUDE OIL has formed a
Bearish wedge pattern and
Then made a breakout and a
Pullback so we are locally
Bearish biased and we will
Be expecting a further
Bearish move down
SHORT🔥
✅Like and subscribe to never miss a new idea!✅
Disclosure: I am part of Trade Nation's Influencer program and receive a monthly fee for using their TradingView charts in my analysis.

USOIL ANALYSISHello friends
Everything is clear on the chart for you, our probability is price growth to the specified areas.
Be sure to observe risk and capital management.
*Trade safely with us*

OIL...SHORT BLACKBULL:WTI
is approaching the key resistance zone at .
I'm watching closely for a valid reaction before considering any position.
***If the level breaks and price retests it successfully, I may consider a counter-directional setup.

Long trade
30min TF overview
🛢 WTICOUSD – Buy-Side Trade
📅 Date: Thursday, 24th April 2025
🕘 Time: 9:00 AM (New York Time)
📍 Session: London AM
📊 Entry Timeframe: (5m)
Trade Parameters
Entry Price: 63.238
Take Profit: 66.619 (+5.54%)
Stop Loss: 63.036 (–0.32%)
Risk-Reward Ratio (RR): 16.74
Reasoning - Narrative
This WTI Crude Oil long trade was initiated during the London AM session, a time when commodity markets often see increased activity and institutional positioning. The trade followed a sharp reaction off a discounted price zone, which aligned with a previously unmitigated bullish order block on the intraday chart.
Before entry, price performed a liquidity sweep below 63.10, triggering stops from earlier long positions and clearing out sell-side pressure

WTI crude about to resume lower?WTI formed a large bearish engulfing candle on its daily chart yesterday near the key $65 resistance level. Was that an indication that prices have ended their corrective bounce? Time will tell, but today's oil prices have bounced back. With the trade uncertainty in the background, demand concerns remain high.
So, I wouldn't be surprised if prices were to resume lower from here. The trend is clearly bearish with the moving averages all pointing lower, not to mention the lower highs and lower lows.
If the selling resumes, watch for possible bounces at the next key round handles like $62, $61 and $60. But there is always the possibility of a sweep below this month's earlier lows if macro concerns intensify.
Meanwhile, the bullish idea is off the table for me for now until we see some progress in US-China trade talks at least, or if prices show a major bullish reversal signal.
By Fawad Razaqzada, market analyst with FOREX.com

USOILThis chart for WTI Crude Oil presents a bullish continuation setup following a rebound from the support level around 61.50. After breaking above a minor consolidation range, price is now retracing slightly before potentially continuing its upward movement.
The chart highlights a target at63.95, just below the upper resistance zone, which previously acted as a strong supply area.
Technical Breakdown:
- Support Level: Firm bounce near 61.50, confirming demand.
- Minor Breakout: Price broke above local structure and retesting for continuation.
- Resistance Zone: Located near64.00, target aligns with historical supply.
- Next Target: 63.95
Volume spikes during the bounce suggest strong buyer interest. A clean break and hold above 63.00 could open the path toward the $63.95 target. Traders may look for bullish price action confirmation for entry.

Join me in being bearish on crude oil
Dear traders, remember to bask in the sun when your mood is moldy. Throw away what you should throw away, and don't think about the people you have missed. Life is boring, so make yourself relaxed and happy.
Crude oil has been running up recently. Yesterday, the daily line had a technical retracement under the pressure of 65.00. Today, we are still bearish. Let's continue to go short on the rebound. There is still a lot of room for crude oil shorts to fall. Today's crude oil rebounded near 64.00. If it breaks below 60.00, it will open up a new space for a big drop. The recent data and fundamentals of crude oil are suppressing it. Bulls predict a big rebound today.
Fundamental analysis
Operational suggestions
Crude oil------short near 64.00, target 63.00-62.00
Hello traders, if you have better ideas and suggestions, welcome to leave a message below, I will be very happy

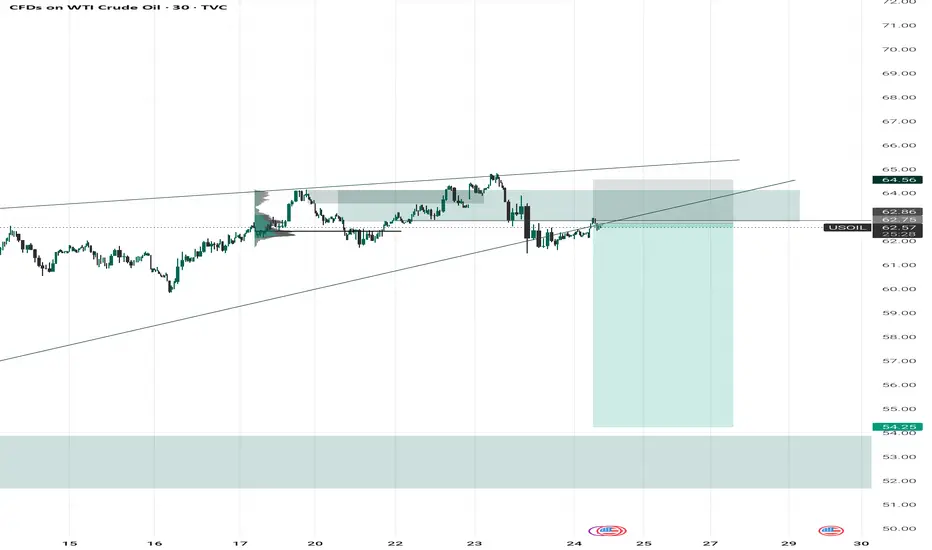
USOIL – Wedge Whisper Turned Rejection Roar
Crude just whispered its next move — and it’s not looking bullish.
After a clean rising wedge breakdown, price is now retesting the underside of the structure, right inside a high-volume supply zone (62.75 - 64.50). This zone screams rejection, especially with that wick-heavy rejection candle teasing a deeper move.
This setup aligns with classic market psychology — buyers trapped at the top, smart money looking for that short squeeze to the downside.
Short Bias Activated
Sell Zone: 62.75 - 64.50
Target: 54.25
Invalidation: Break and close above 64.60
If this plays out, it’s a straight-up slide to the next major demand zone. Eyes on volume and rejection confirmations!
OIL buy setup H1Hello! Friends,
Greetings. Please leave a Like if you like the idea.
Before start talking about technical Let's share your LOVE by giving me LIKES to support this work. Thanks in advance.

Crude sell trade Crude oil can be sold when price reaches supply zone . Sl above the zone target demand zone . Small sl call
