USOIL REBOUND AHEAD|LONG|
✅CRUDE OIL is set to retest a
Strong support level below at 60.20$
After trading in a local downtrend from some time
Which makes a bullish rebound a likely scenario
With the target being a local resistance above at 61.43$
LONG🚀
✅Like and subscribe to never miss a new idea!✅
Disclosure: I am part of Trade Nation's Influencer program and receive a monthly fee for using their TradingView charts in my analysis.
USOUSD trade ideas

USOIL - Bullish Double BottomHello Traders !
The USOIL price formed a double bottom pattern.
Currently, The neckline is broken !
So, I expect a bullish move🚀
_______________
TARGET: 63.49🎯

USOIL:First go short, then go long
USOIL: There are still signs of a pullback on an hourly basis after oil prices climbed to near 63 after OPEC+ said there would be no immediate changes to current production policies.
So the trading strategy :SELL@62.5-62.8 TP@61.6-61.3
After stepping back to the point can not break a wave of rebound, the target can look at 63 again
↓↓↓ More detailed strategies and trading will be notified here →→→
↓↓↓ Keep updated, come to "get" →→→

USOIL:Long thinking, target 62.5
USOIL: Same idea, the front 61.3-61.5 has been given to the entry point, it is slowly rising, the upper target is still seen near 62.5.
So strategically, stay long and wait for the rally, TP@62.5
Tip: It is always right to sell when there is a profit, according to individual risk appetite.
↓↓↓ More detailed strategies and trading will be notified here →→→
↓↓↓ Keep updated, come to "get" Or just find me→→→

Potential bullish rise?WTI Oil (XTI/USD) has bounced off the pivot and could rise the 1st resistance which is a pullback resistance.
Pivot: 61.68
1st Support: 60.72
1st Resistance: 63.49
Risk Warning:
Trading Forex and CFDs carries a high level of risk to your capital and you should only trade with money you can afford to lose. Trading Forex and CFDs may not be suitable for all investors, so please ensure that you fully understand the risks involved and seek independent advice if necessary.
Disclaimer:
The above opinions given constitute general market commentary, and do not constitute the opinion or advice of IC Markets or any form of personal or investment advice.
Any opinions, news, research, analyses, prices, other information, or links to third-party sites contained on this website are provided on an "as-is" basis, are intended only to be informative, is not an advice nor a recommendation, nor research, or a record of our trading prices, or an offer of, or solicitation for a transaction in any financial instrument and thus should not be treated as such. The information provided does not involve any specific investment objectives, financial situation and needs of any specific person who may receive it. Please be aware, that past performance is not a reliable indicator of future performance and/or results. Past Performance or Forward-looking scenarios based upon the reasonable beliefs of the third-party provider are not a guarantee of future performance. Actual results may differ materially from those anticipated in forward-looking or past performance statements. IC Markets makes no representation or warranty and assumes no liability as to the accuracy or completeness of the information provided, nor any loss arising from any investment based on a recommendation, forecast or any information supplied by any third-party.

Crude oil rebounds after encountering 60 support
📊Technical aspects
Due to concerns that global supply growth may exceed demand growth, WTI prices fell slightly and rebounded slightly after hitting the 60 mark.
From the daily chart level, the medium-term trend moving average system suppresses the rebound of oil prices, and the medium-term objective trend direction is downward. After the oil price hit the low of 55.20, the frequent alternation of long and short formed, and the embryonic form of the falling flag relay appeared from the shape. Pay attention to the strength of the oil price testing the upper edge of the flag. It is expected that after the medium-term trend fluctuates, it will still rise to the 64 position.
The short-term (1H) trend of crude oil fell and touched the key support of 60, then rose slightly. The moving average system turned to divergent upward arrangement, and the short-term objective trend direction was upward. The MACD indicator fast and slow lines crossed the zero axis, and the bullish momentum was sufficient. It is expected that the trend of crude oil will continue to rise during the day, and the probability of breaking through the 63 resistance and moving upward is relatively high.
💰 Strategy Package
Long Position: 60.5-61.5

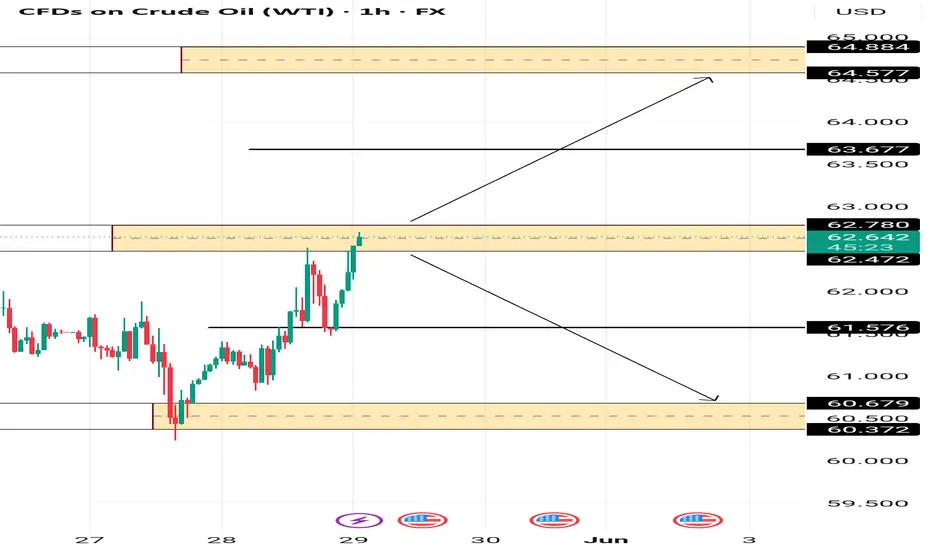
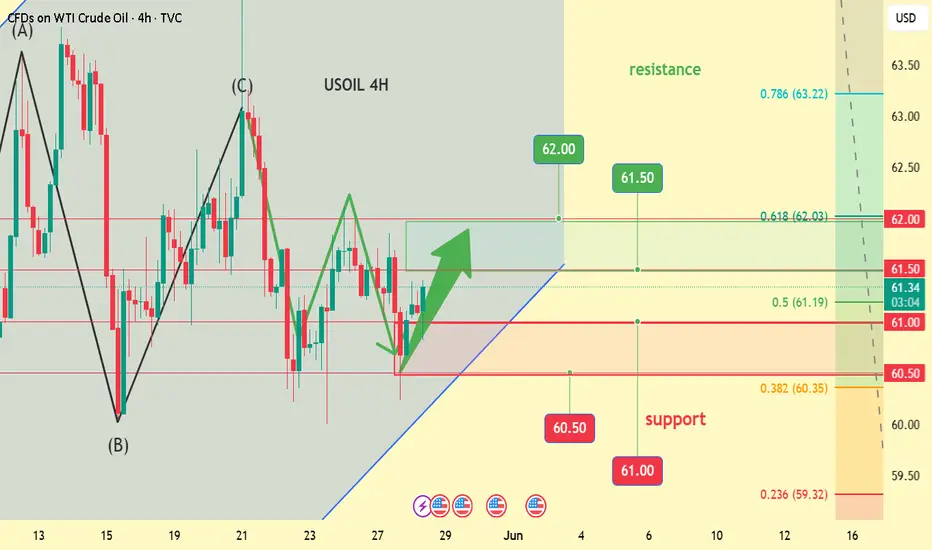
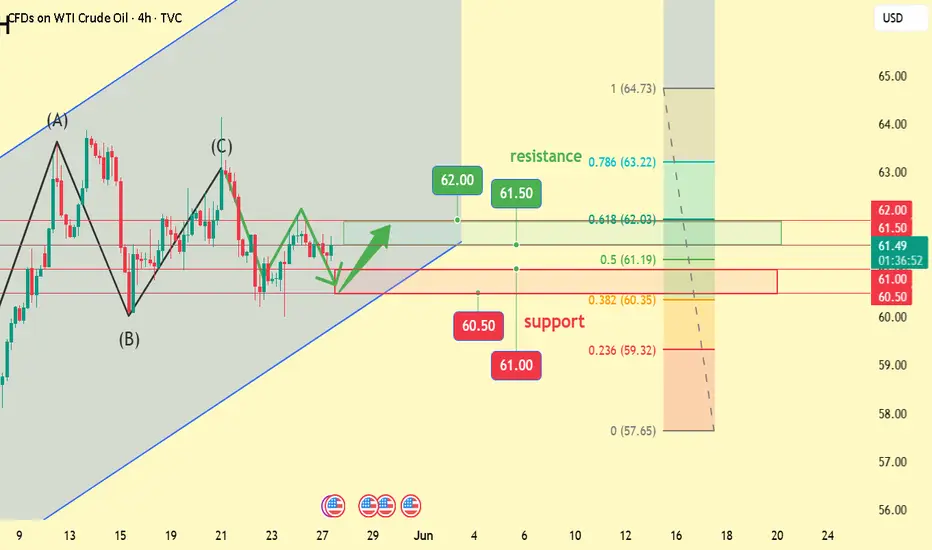
US CRUDE OIL PIVOT AREAUS OIL has formed a good base of support after the decent decline in the previous weeks.
The break of our intraday pivot area could keep the Bullish bias with targets of 63.67 and 64.57 in the near sight.
However failure to break above could bring prices down to 61.57 and 60.67
USOIL Today's Trading Strategy Hope this helps you
### Factors Influencing Long Positions in Crude Oil
#### Seasonal Demand Growth
Summer typically sees a surge in crude oil demand as increased travel and industrial activities drive up consumption. For example, gasoline demand in the U.S. rises significantly during summer due to higher public travel, providing support for crude oil prices and creating opportunities for long positions.
#### Geopolitical Factors
Conflicts, political instability, or sanctions in major oil-producing regions can disrupt or reduce crude oil supply, pushing prices higher. Although Middle Eastern tensions have eased recently, news of a potential Israeli attack on Iranian nuclear facilities previously caused oil prices to jump 3%. Escalating geopolitical tensions would favor long positions in crude oil.
#### Inventory Levels
A decline in crude oil inventories signals tighter supply, which may drive price increases. When inventory data falls below expectations, market concerns about supply shortages intensify, pushing prices higher and creating opportunities for long positions.
USOIL Today's Trading Strategy Hope this helps you
USOIL BUY@60.5~61
SL:59.5
TP:62~62.5

WTI OIL Rejection on 1D MA50 aims at $56.50.WTI Oil (USOIL) has been trading within a 13-month Channel Down pattern and is currently under heavy pressure by multiple Resistance levels.
The immediate one is the 1D MA50 (blue trend-line), which has its most recent rejection last Wednesday (May 21) and as you can see, the price has failed to break above it, even though it's been trading directly below it.
As long as the 1D MA50 holds, we expect a test of the lower Support Zone at $56.50, similar to the September - December 2024 Support Zone, which was tested continuously after several 1D MA50 rejections.
-------------------------------------------------------------------------------
** Please LIKE 👍, FOLLOW ✅, SHARE 🙌 and COMMENT ✍ if you enjoy this idea! Also share your ideas and charts in the comments section below! This is best way to keep it relevant, support us, keep the content here free and allow the idea to reach as many people as possible. **
-------------------------------------------------------------------------------
💸💸💸💸💸💸
👇 👇 👇 👇 👇 👇

Oil Buy analysis/ideaThis trade is based on the Daily and 4-hour timeframes and executed using reversal trading and trend formation. Complete explanation in the video!

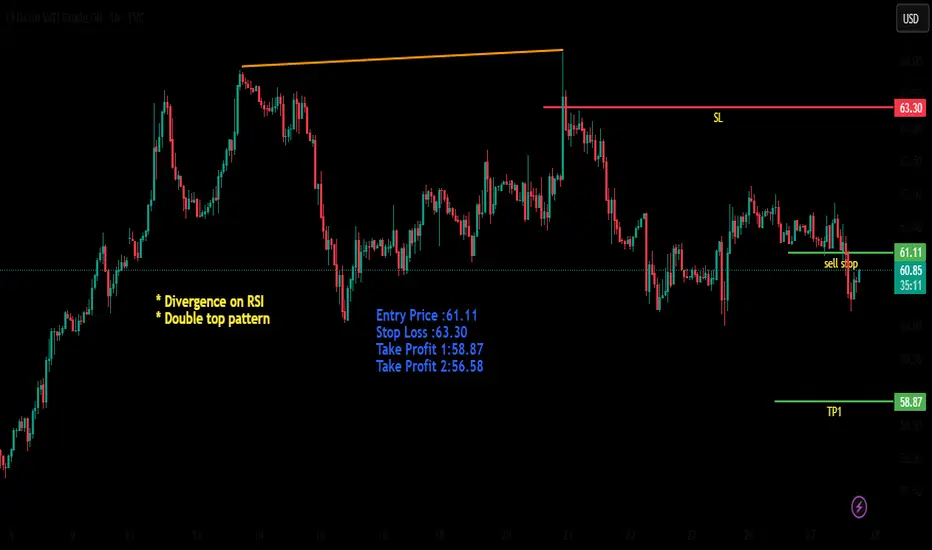
Crude Oil (WTI) Technical Analysis – Bearish Harmonic Pattern 🛢️ Crude Oil (WTI) Technical Analysis – Bearish Harmonic Pattern Completion
Pattern Overview:
A Bearish Harmonic Pattern has been identified and completed.
The final leg (point D) has touched the 50% Fibonacci retracement of the previous XA leg, which validates the pattern's structure.
Key Observations:
Price has reversed from the D point, suggesting potential downside continuation.
Confirmation is observed with minor rejection wicks at the D zone.
The harmonic pattern indicates trend exhaustion and a reversal probability.
Price Action:
The current market level is near $61.75.
Price is expected to follow the projected zig-zag bearish path towards the target zone around $60, with further possible extension down to $58.90.
Technical Conclusion:
✅ Harmonic pattern completed
🔻 Bearish sentiment initiated post-pattern
🎯 Target zone: $60–$58.90
Trading Insight:
If price sustains below point D with weak bullish response, shorts will get initiated with tight stop-loss above D-point highs. Strong follow-through could bring a quick drop towards the projected support levels.
⚠️ Disclaimer:
This analysis is for educational and informational purposes only. It does not constitute financial advice or a trading recommendation. Please conduct your own research or consult with a financial advisor before making any trading decisions.

USOIL Today's Trading Strategy Hope this helps youAlthough OPEC+ plans to significantly increase production in July and August, the actual implementation is uncertain. Some member states may struggle to meet production targets due to their own capacity, technical, or financial limitations, which could result in the actual supply increase being lower than expected. For example, in some small and medium oil-producing countries, aging equipment and backward mining technologies make it difficult to truly implement production increase plans even if they exist. The U.S. shale oil industry is facing the dual challenges of rising equipment costs and low oil prices, with many small and medium-sized drilling companies struggling to survive and even possibly shutting down some oil wells due to continuous losses. This means that U.S. shale oil production may not only fail to grow but could also decline, thereby reducing global crude oil supply and supporting oil prices.
As the "heartland" of global crude oil supply, the Middle East has always been in a tense situation. The Iranian nuclear issue remains unresolved, relations between the U.S. and Iran are highly strained, and Israel is also eyeing Iran's nuclear facilities. Once a conflict breaks out, Iran's crude oil production and exports will be hindered, and oil transportation channels in the Middle East may also be affected, leading to a significant reduction in global crude oil supply and triggering a sharp rise in oil prices. This potential geopolitical risk could(at any time) become a catalyst for driving oil prices higher.
USOIL Today's Trading Strategy Hope this helps you
USOIL BUY@60.5~61
SL:59.5
TP:61.5~62

WTI Crude Oil INTRADAY consolidation capped at 6360Trend: The sentiment remains bearish, in line with the prevailing downward trend.
Recent Movement: Price is currently in a sideways consolidation, suggesting indecision near short-term lows.
Key Levels
Resistance:
6360 – Key resistance and prior consolidation zone.
Above that: 6440, then 6530 – Next upside targets if breakout occurs.
Support:
6020 – Initial downside target.
Below that: 5940, then 5820 – Deeper support levels if bearish momentum resumes.
Trading Scenarios
Bearish Continuation:
A rally to 6360 followed by rejection could lead to a drop toward 6020, 5940, and 5820.
Bullish Breakout:
A daily close above 6360 would negate the bearish setup and open the path for a recovery toward 6440, then 6530.
Conclusion
WTI Crude Oil remains under bearish pressure, but is currently range-bound. A rejection at 6360 would confirm downside continuation. A breakout above that level would shift bias to bullish, targeting higher resistance zones. Watch 6360 as the key pivot.
This communication is for informational purposes only and should not be viewed as any form of recommendation as to a particular course of action or as investment advice. It is not intended as an offer or solicitation for the purchase or sale of any financial instrument or as an official confirmation of any transaction. Opinions, estimates and assumptions expressed herein are made as of the date of this communication and are subject to change without notice. This communication has been prepared based upon information, including market prices, data and other information, believed to be reliable; however, Trade Nation does not warrant its completeness or accuracy. All market prices and market data contained in or attached to this communication are indicative and subject to change without notice.

USOIL Today's Trading Strategy Hope this helps youThe situation in the Middle East remains tense. Although progress has been made in the Iranian nuclear negotiations, the outcome of the negotiations is full of uncertainties. There are numerous contradictions between the United States and Iran, and Israel is also eyeing Iran's nuclear facilities. Once a conflict breaks out, Iran's crude oil production and exports will be hindered, and oil transportation channels in the Middle East may also be affected, leading to a significant reduction in global crude oil supply. As a result, oil prices will likely rise rapidly. Such potential geopolitical risks provide room for imagination for the rise in crude oil prices.
USOIL Today's Trading Strategy Hope this helps you
USOIL BUY@60.5~61
SL:59.5
TP:61.5~62
usoil buy tradeThe Relative Strength Index (RSI) is showing an upward trend, indicating increasing momentum. Additionally, the Moving Average Convergence Divergence (MACD) is showing a bullish crossover, further supporting the potential for an upward move.

usoil starts longusoil is close to the support area below, and you can start to go long when it reaches the support position
usoil trading strategy today
usoil buy@60-61
tp:62-63

USOIL MONTHLYUSOIL,oil is on a demand floor and will continue to upswing into 70-69 dollar zone ,am holding oil buy till 70$ per barrel
at 70$ zon,e buyers will face supply roof ,a critical make or break zone ,if they break the structure ,oil will fly higher and if they respect the supply roof, we sell on the fundamentals of a broken SR/RS RULE..35$ zone will be watched in a bearish scenario.
Relationship Between US Oil Prices (USOIL), Bond Yields, and Interest Rates
1. General Correlation Between Oil Prices and Bond Yields
Over recent years, US crude oil prices and 10-year US Treasury bond yields have shown a strong positive correlation, often moving in tandem.
When oil prices rise, it typically signals stronger economic activity and higher inflation expectations, which tend to push bond yields higher as investors demand greater compensation for inflation risk and growth prospects.
Conversely, falling oil prices often correlate with lower bond yields due to expectations of weaker growth and reduced inflationary pressure.
2. Oil Prices Leading Bond Yield Movements
Short-term trend changes in crude oil prices often lead changes in bond yields by a few weeks, meaning oil price movements can be a useful indicator for bond market trends.
For example, a sustained rise in oil prices due to supply constraints or geopolitical tensions often precedes an increase in Treasury yields.
3. Recent Divergences and Market Dynamics
Recently, the usual positive relationship between oil prices and bond yields has broken down temporarily, reflecting unusual market conditions such as US fiscal uncertainties and changing safe-haven dynamics.
For instance, oil prices dropped due to expectations of increased production, while US bond yields increased following economic data releases, showing a temporary divergence.
4. Impact of Oil Prices on Interest Rates and Inflation Expectations
Rising oil prices contribute to higher inflation expectations, which in turn can lead to higher nominal bond yields as investors seek compensation for inflation risk.
Central banks, including the Federal Reserve, may respond to sustained high oil prices and inflation by maintaining or raising interest rates, which also pushes bond yields higher.
Conversely, falling oil prices can act as a disinflationary force, potentially easing pressure on interest rates and bond yields, though recent market behavior shows this effect can be muted by other factors.
5. Economic Implications
Higher oil prices combined with rising bond yields and a strengthening dollar can act as a "tax" on the US economy, potentially slowing growth and increasing recession risks.
The interplay of oil prices and bond yields is a key factor in assessing the economic outlook, inflation trajectory, and monetary policy stance.
Summary Table
Factor Relationship / Impact
Oil Price ↑ Bond yields ↑ (due to inflation & growth expectations)
Oil Price ↓ Bond yields ↓ (due to lower inflation & growth fears)
Oil price trend leads bond yields Oil price changes precede bond yield changes by weeks
Recent divergence Temporary breakdown due to fiscal concerns, policy uncertainty
Inflation expectations Higher oil → higher inflation expectations → higher yields
Economic growth impact Higher oil + yields = economic headwind (stagflation risk)
Conclusion
The relationship between US oil prices (USOIL) and bond yields is generally positive and significant, with oil price movements often leading bond yield trends. Rising oil prices tend to push bond yields and interest rates higher through increased inflation expectations and stronger economic activity signals. However, recent market conditions have caused some temporary divergences due to fiscal uncertainties and changing safe-haven demand. Monitoring oil prices is crucial for anticipating bond market movements and understanding the broader macroeconomic environment.
#usoil #dollar #oil

WTI Crude Oil Testing Make-or-Break Support ZoneWTI crude is grinding into a pivotal horizontal support near 6,020 after another sharp rejection near the 50-day SMA:
Support at Risk: Price is pressing into the horizontal support zone formed by May’s lows (~6,020). A clean break below would shift momentum back decisively to the downside.
Bearish Structure: Price remains well below both the 50- and 200-day SMAs, which are angled downward—consistent with a medium-term downtrend.
Momentum Fading: MACD is negative and turning lower again, while RSI is stuck near 45 and showing no bullish divergence.
Next Support: If support fails, next downside level is likely around the YTD low near 5,400.
As it stands, bears remain in control unless bulls can defend this floor and drive a breakout back above the 50-day SMA.
-MW

Potential crash on USPOILEntry: Current level or pullback retest of broken support
Stop Loss: Above swing high 64.443
Take Profit: floating due to potential crash on oil, move SL to break even
Set up: Triple confluence - Major trend break, MA rejection and bearish candle on weekly

USOIL Today's Trading Strategy Hope this helps you
On the supply side, although OPEC+ has a production increase plan, there are differences in the implementation efforts among member states. Some countries may be unable to fully implement the production increase target due to their own interests or production capacity limitations. In the case of U.S. shale oil, the current oil price is hovering near $60, close to the shale oil extraction cost line. If oil prices continue to fall, the production enthusiasm of U.S. shale oil enterprises will be dampened, and some oil wells may even be shut down, leading to a reduction in supply, which in turn will support oil prices.
On the demand side, the global economic recovery trend has gradually become clear. With the continuous implementation of economic stimulus policies by various countries, industrial production activities have increased, and the transportation industry has gradually recovered, leading to a steady growth trend in crude oil demand. In particular, emerging economies, with their fast economic growth rates and large demand gap for crude oil, have become an important force driving the growth of crude oil demand.
Geopolitical factors remain a key variable affecting oil prices. The situation in the Middle East is tense, the progress of the Iranian nuclear negotiations is slow, and the contradictions between Israel and Iran continue to escalate. Once a conflict breaks out, it will seriously affect crude oil production and transportation in the Middle East, leading to a global crude oil supply shortage and a inevitable sharp rise in oil prices.
USOIL Today's Trading Strategy Hope this helps you
USOIL BUY@60.5~61
SL:59.5
TP:61.5~62
WTI Consolidates and Holds Above 60Crude oil remains locked in a resilient sideways range, with strong support between $55 and $58, and a key resistance zone between $63 and $65. Momentum indicators are mixed:
• Daily RSI remains neutral, allowing for both bullish and bearish scenarios.
• Weekly RSI shows a clean bounce from 2020 extremes, suggesting underlying bullish potential.
Scenarios to Watch
Bullish Scenario:
A sustained move above $63.80–$65 could pave the way for gains toward $66.90, $69.20, and $71.
Bearish Scenario:
A decisive break below $58 would expose downside risk toward $56.70 and $55. In the case of extreme market turbulence, further losses toward $49 remain possible—potentially setting up for a new long-term bullish positioning.
- Razan Hilal, CMT

usoilusoil has made a good flag n pool pattren may be we can see good breakout in usoil if 15 min candle is given closing above the resistance which i have drawn on chart . the target foe this will be 62 .
