Crude oil: 63.00 resistance & 60.00 support keyPrices are currently testing the upper resistance at $63.00 📈. These levels are suppressing the price 🔻. A decisive breakthrough above this level may trigger a more intense upward rally 🔥. Meanwhile, recent selling pressure has pushed the price down to $60.60 📉. Watch the pivot support at $60.00, the real downward target 🎯
Crude oil surplus expanded in April, and imports increased, reaching multi - month highs from some countries 🌍. If global benchmark oil prices rise in the future, purchases may be reduced 📉.
Crude oil fell first and then rose today 📊. After a deep dive to $60.9, it stabilized and started to rise 🔼. After the previous price increase and adjustment, it remains to be seen if the upward momentum will continue and break through upwards 🔍.
Overall, on the delivery day, oil prices are volatile 🔼🔽. Watch the resistance at $63.0 on the upside and the support at $60.60 - $60.0 on the downside 👀.
⚡️⚡️⚡️ USOil ⚡️⚡️⚡️
🚀 Sell@ 62.50 - 62.30
🚀 TP 61.50 - 60.60
Accurate signals are updated every day 📈 If you encounter any problems during trading, these signals can serve as your reliable guide 🧭 Feel free to refer to them! I sincerely hope they'll be of great help to you 🌟 👇
USOUSD trade ideas

WTI OIL 1H Channel Up make or break Targets.WTI Oil (USOIL) has been trading within a Channel Up on the 1H time-frame that is supported by the 1H MA200 (orange trend-line). As long as this holds, we expect another +2.50% Bullish Leg (at least), which gives a Target of $63.55.
If the price breaks below the 1H MA200 though, we will take this small loss on the long and go short instead, targeting Support 1 at $60.60.
-------------------------------------------------------------------------------
** Please LIKE 👍, FOLLOW ✅, SHARE 🙌 and COMMENT ✍ if you enjoy this idea! Also share your ideas and charts in the comments section below! This is best way to keep it relevant, support us, keep the content here free and allow the idea to reach as many people as possible. **
-------------------------------------------------------------------------------
Disclosure: I am part of Trade Nation's Influencer program and receive a monthly fee for using their TradingView charts in my analysis.
💸💸💸💸💸💸
👇 👇 👇 👇 👇 👇

Crude Oil (WTI/USD) Short Setup🔻 Crude Oil (WTI/USD) Short Setup – Trend Exhaustion with Bearish Risk/Reward Play
Crude oil has shown weakness after failing to reclaim the $62.50–63.00 resistance zone. Price is now consolidating near the breakdown level, and early signs of bearish continuation are forming. SQZMOM histogram is flattening near zero, hinting at loss of bullish momentum. This setup offers a high-probability short with favorable downside extension.
📉 Entry: 61.97
🎯 Target: 57.83
🛑 Stop Loss: 63.87
📊 Risk/Reward Ratio: 2.18
📆 Expected Duration: ~5 days
📌 Technical Highlights:
Bearish Retest: Price is stalling at previous broken support turned resistance.
Trend Weakness: Lower highs forming after recent top at 63.87.
SQZMOM Indicator: Momentum stalling below zero, signaling a potential shift back to bearish pressure.
Support Gap: Clean range down to $58 with thin volume structure below $60.
💬 A break below 60.12 confirms momentum shift. A close above 62.50 invalidates the short.

Bullish momentum to extend?WTI Oil (XTI/USD) has bounced off the pivot and could rise to the 1st resistance, which lines up with the 61.8% Fibonacci projection.
Pivot: 60.08
1st Support: 57.68
1st Resistance: 64.63
Risk Warning:
Trading Forex and CFDs carries a high level of risk to your capital and you should only trade with money you can afford to lose. Trading Forex and CFDs may not be suitable for all investors, so please ensure that you fully understand the risks involved and seek independent advice if necessary.
Disclaimer:
The above opinions given constitute general market commentary, and do not constitute the opinion or advice of IC Markets or any form of personal or investment advice.
Any opinions, news, research, analyses, prices, other information, or links to third-party sites contained on this website are provided on an "as-is" basis, are intended only to be informative, is not an advice nor a recommendation, nor research, or a record of our trading prices, or an offer of, or solicitation for a transaction in any financial instrument and thus should not be treated as such. The information provided does not involve any specific investment objectives, financial situation and needs of any specific person who may receive it. Please be aware, that past performance is not a reliable indicator of future performance and/or results. Past Performance or Forward-looking scenarios based upon the reasonable beliefs of the third-party provider are not a guarantee of future performance. Actual results may differ materially from those anticipated in forward-looking or past performance statements. IC Markets makes no representation or warranty and assumes no liability as to the accuracy or completeness of the information provided, nor any loss arising from any investment based on a recommendation, forecast or any information supplied by any third-party.


USOILUSOIL (WTI Crude) Fundamentals – May 2025
1. Supply and Demand Dynamics
Global Oil Demand:
The International Energy Agency (IEA) projects global oil demand growth will slow from 990,000 barrels per day (bpd) in Q1 to around 650,000 bpd for the rest of 2025, reflecting economic headwinds and record-high efficiency gains.
The IEA’s latest report (May 2025) estimates total demand will rise by 741,000 bpd in 2025, reaching 103.9 million bpd, with emerging markets (China, India, Africa, Latin America, Middle East) driving most of the growth.
OECD demand is expected to decline, while non-OECD demand remains geographically diversified.
Global Oil Supply:
Global crude oil and liquids supply is forecast to average 104.4 million bpd in 2025, up 1.8 million bpd (+1.7%) from 2024.
Non-OPEC+ countries (U.S., Brazil, Guyana, Canada) are expected to contribute most of the supply growth, potentially resulting in a supply surplus.
OPEC+ extended its 3.7 million bpd supply cuts to the end of 2026, but voluntary cuts will be gradually phased out starting April 2025.
Supply-Demand Balance:
The EIA expects a supply surplus in 2025 as non-OPEC+ supply growth outpaces demand increases, especially with OPEC+ phasing out some cuts.
2. Inventory and Refinery Data
U.S. Inventories:
U.S. commercial crude oil inventories fell by 2.7 million barrels at the end of April, now about 6% below the five-year seasonal average.
Gasoline and distillate inventories remain below average, suggesting tightness in refined product markets.
U.S. refineries are operating at 88.6% capacity, with robust input and flat-to-lower gasoline production.
3. Geopolitical and Macro Factors
Trade Policy and Geopolitics:
Recent easing of U.S.-China trade tensions and progress in U.S.-Iran nuclear talks have improved risk sentiment and supported oil prices.
Hopes for a Russia-Ukraine ceasefire and de-escalation in the Middle East have reduced risk premiums, but the market remains sensitive to any setback in negotiations.
OPEC+ Compliance:
OPEC+ compliance with production cuts was high (112%) in March 2025, tightening supply and helping prices rebound from recent lows.
4. Price Trends and Outlook
Current Prices:
WTI crude is trading around $62.80–$63.50, rebounding from recent lows but still well below early 2025 peaks.
Price volatility remains high (Brent’s 30-day realized volatility peaked at 35%), reflecting sensitivity to geopolitical headlines and inventory data.
Forecasts:
J.P. Morgan maintains a Brent forecast of $66/bbl for 2025, with expectations for prices to remain under pressure due to supply surplus, but potential for mid-$70s if trade optimism and OPEC+ discipline persist.
Futures markets price WTI at an average of $75/bbl for 2025, though this is above current spot prices.
Summary Table
Factor Current Status/Impact (May 2025)
Global Demand Growth Slowing, driven by emerging markets
Global Supply Rising, led by non-OPEC+ (US, Brazil, Guyana)
OPEC+ Policy Extended cuts, gradual phase-out
US Inventories Below 5-year average, supporting prices
Geopolitical Risk Lower, but market remains headline-sensitive
WTI Price Range $62.80–$63.50 (recent), futures avg $75/bbl
Volatility High, driven by macro and geopolitical uncertainty
Conclusion
USOIL fundamentals for May 2025 reflect a market balancing slower demand growth, robust non-OPEC+ supply, and cautious optimism on geopolitics. Ongoing OPEC+ discipline and below-average inventories provide some support, but the risk of a supply surplus and persistent volatility keep prices capped. Watch for trade policy shifts, OPEC+ compliance, and inventory trends as key catalysts for the month.

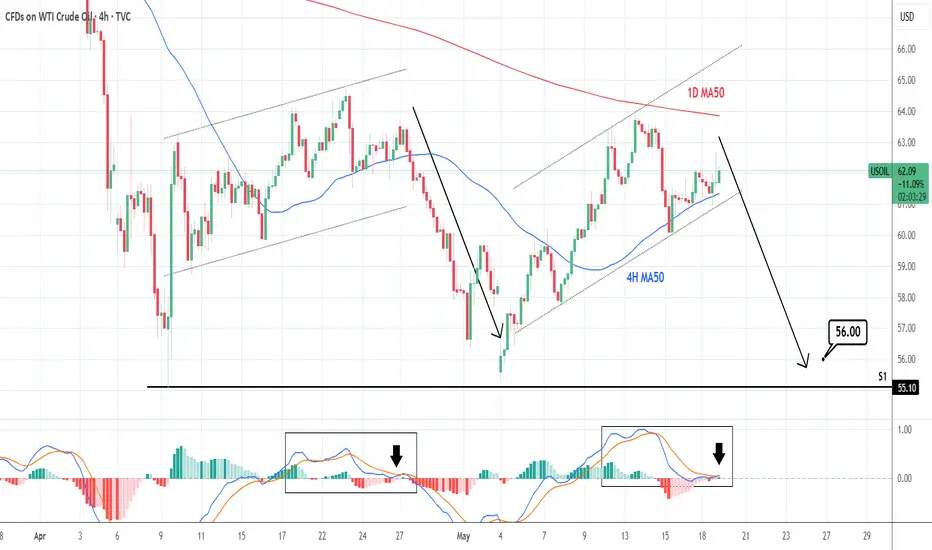
WTI CRUDE OIL: Mirror pattern calls for a sell.WTI Crude Oil is neutral on its 1D technical outlook (RSI = 50.222, MACD = -0.370, ADX = 25.154) as the price is just under the 1D MA50, where it got rejected last Tuesday. In the meantime, it has the support of the 4H MA50, hence stuck inside a neutral range. This pattern is however identical to April, after which the price declined aggressively to the S1 level. Sell, TP = 56.00.
See how our prior idea has worked out:
## If you like our free content follow our profile to get more daily ideas. ##
## Comments and likes are greatly appreciated. ##
The main strategy is to go long on pullbacksDuring the Asian trading session on Monday, Brent crude fell slightly by $0.05 to $65.15 per barrel; WTI crude was quoted at $61.76, while the more actively traded July contract dropped $0.04 to $61.93. Both benchmark oil prices recorded weekly gains of over 1% last week, mainly boosted by the easing of global trade sentiment. The market will closely monitor data to be released soon by a major Asian economy, including April industrial added value, fixed asset investment, and retail sales. ANZ Bank noted in a report that weak data from the major Asian economy could undermine the optimism brought by the tariff suspension, thereby pressing down oil prices.👉👉👉
The K-line closed as a yang line with a long lower shadow, indicating strong bullish momentum from buyers. The moving average system is gradually arranging in a bullish formation, relying on the oil price, and the short-term objective trend direction has turned upward. It is expected that the intraday crude oil trend will continue to rise, reaching near 63. Overall, in terms of crude oil trading strategies, it is recommended to focus on buying low on pullbacks and supplement with selling high on rebounds. In the short term, pay attention to the resistance at the 63.0-63.5 level above, and the support at the 61.0-60.5 level below.
Oil trading strategy:
buy @ 61.00-61.50
sl 60.00
tp 62.30-62.80
If you think the analysis helpful, you can give a thumbs-up to show your support. If you have different opinions, you can leave your thoughts in the comments. Thank you for reading!👉👉👉

WILL CRUDE OIL HOLD BULLISH PRESSURE!?NY Session
LONG entry
Retest and Bounce of POi (61.700) psychological level
5-15min break of previous structure]
15min break of 9 ema
+ 618 retracement level
looking for price to fill (63.838)TP
EASYMARKETS:OILUSD

Crude OilU.S Oil Index
- Rising Wedge as an corrective pattern in Short Time Frame
- Break of Structure
- Completed " 12345 " Impulsive Waves and " ABC " Corrective Waves
- Change of Characteristics
- RSI - Divergence

WTI Update | Oil CrashSince the last update we were able to perform about two to three swing trades. One from $70 - $79, and from $79 to $68. The next move I'm looking for is another short position from current market price ~($62) to swing to the next major low $33.
We saw a rejection last week and we're currently pulling back to retest the little selloff we had.
Could say this next local move will look to selloff mid week making its way back to $57 which would be a nice short term swing.
The $33 target would be the long term swing of course and moving on I would like to see a break below $57 and a retest.


WTI Crude Oil Price Targets Fresh GainsWTI Crude Oil Price Targets Fresh Gains
WTI Crude oil prices are gaining bullish momentum and might even test $63.50.
Important Takeaways for WTI Crude Oil Price Analysis Today
- WTI Crude climbed above the $60.90 and $61.50 resistance levels.
- There is a key rising channel forming with support at $61.30 on the hourly chart of XTI/USD at FXOpen.
WTI Crude Oil Price Technical Analysis
On the hourly chart of WTI Crude Oil at FXOpen, the price started a fresh upward move from $60.10 against the US Dollar. The price gained bullish momentum after it broke the $60.90 resistance.
The bulls pushed the price above the 50% Fib retracement level of the downward move from the $63.45 swing high to the $60.08 low. The price even climbed above the 50-hour simple moving average.
It tested the $62.15 resistance zone and the 61.8% Fib retracement level of the downward move from the $63.45 swing high to the $60.08 low. There is now a key rising channel forming with support at $61.30.
The RSI is now near the 50 level and the price could aim for more gains. If the price climbs higher again, it could face resistance near $62.15. The next major resistance is near the $62.65 level. Any more gains might send the price toward the $63.45 level or even $65.00.
Conversely, the price might correct gains and test the $61.30 support level. The next major support on the WTI crude oil chart is near the $60.90 zone, below which the price could test the $60.10 zone.
If there is a downside break, the price might decline toward $58.50. Any more losses may perhaps open the doors for a move toward the $55.50 support zone.
This article represents the opinion of the Companies operating under the FXOpen brand only. It is not to be construed as an offer, solicitation, or recommendation with respect to products and services provided by the Companies operating under the FXOpen brand, nor is it to be considered financial advice.

WTIFrom the channel ceiling, it can go back to the midline and the channel floor...
something it has followed so far, and the support levels are also lower.

Hellena | Oil (4H): SHORT to support area of 56,339.Colleagues, I was watching the price and was expecting a pattern for a reversal downtrend. I still expect a downward movement and believe that the price is in a combined correction.
This means that wave “B” has been formed and I expect wave “C” to reach at least the 56,339 area.
Manage your capital correctly and competently! Only enter trades based on reliable patterns!

WTI Oil H4 | Potential bullish bounceWTI oil (USOIL) is falling towards an overlap support and could potentially bounce off this level to climb higher.
Buy entry is at 60.44 which is an overlap support that aligns with the 38.2% Fibonacci retracement.
Stop loss is at 57.60 which is a level that lies underneath a swing-low support and the 61.8% Fibonacci retracement.
Take profit is at 63.68 which is a multi-swing-high resistance.
High Risk Investment Warning
Trading Forex/CFDs on margin carries a high level of risk and may not be suitable for all investors. Leverage can work against you.
Stratos Markets Limited (tradu.com):
CFDs are complex instruments and come with a high risk of losing money rapidly due to leverage. 63% of retail investor accounts lose money when trading CFDs with this provider. You should consider whether you understand how CFDs work and whether you can afford to take the high risk of losing your money.
Stratos Europe Ltd (tradu.com):
CFDs are complex instruments and come with a high risk of losing money rapidly due to leverage. 63% of retail investor accounts lose money when trading CFDs with this provider. You should consider whether you understand how CFDs work and whether you can afford to take the high risk of losing your money.
Stratos Global LLC (tradu.com):
Losses can exceed deposits.
Please be advised that the information presented on TradingView is provided to Tradu (‘Company’, ‘we’) by a third-party provider (‘TFA Global Pte Ltd’). Please be reminded that you are solely responsible for the trading decisions on your account. There is a very high degree of risk involved in trading. Any information and/or content is intended entirely for research, educational and informational purposes only and does not constitute investment or consultation advice or investment strategy. The information is not tailored to the investment needs of any specific person and therefore does not involve a consideration of any of the investment objectives, financial situation or needs of any viewer that may receive it. Kindly also note that past performance is not a reliable indicator of future results. Actual results may differ materially from those anticipated in forward-looking or past performance statements. We assume no liability as to the accuracy or completeness of any of the information and/or content provided herein and the Company cannot be held responsible for any omission, mistake nor for any loss or damage including without limitation to any loss of profit which may arise from reliance on any information supplied by TFA Global Pte Ltd.
The speaker(s) is neither an employee, agent nor representative of Tradu and is therefore acting independently. The opinions given are their own, constitute general market commentary, and do not constitute the opinion or advice of Tradu or any form of personal or investment advice. Tradu neither endorses nor guarantees offerings of third-party speakers, nor is Tradu responsible for the content, veracity or opinions of third-party speakers, presenters or participants.

USOIL Weekly Analysis – Major Breakdown and Retest in PlayAfter several months of holding firm, USOIL has finally broken below its key support zone around $67–$70, which had acted as a floor since mid-2021 . This is a significant technical development, and the current price action is showing a classic bearish retest of that broken structure.
Technical Breakdown:
Support Broken:
The $67–$70 zone was tested multiple times over the past 2 years. Price has now cleanly broken through it and is struggling to reclaim it.
Retest in Progress:
Price is currently hovering around $62.36 and failing to push back above the broken support. This retest is textbook and could confirm further downside.
Market Structure:
Lower highs and lower lows dominate the weekly chart = clear bearish trend.
Bearish Targets:
Target 1: $53.50 – Previous minor demand zone from 2021.
Target 2: $41.50 – Strong historical support and potential major bounce area.
Invalidation Zone:
If price closes above $70 on the weekly chart, the breakdown would be invalidated and we’ll reconsider our bias.
Confluence:
Broken multi-year support
Bearish retest on weekly timeframe
Clear downside liquidity below
Summary:
Bias: Bearish
Setup: Short on confirmation of rejection below $67
Timeframe: Weekly / Daily
This is a high-probability setup if the rejection continues. Look for further bearish price action on the daily or 4H chart for refined entries. As always, manage risk carefully .
Like & Follow for more clean, high-timeframe breakdowns!

USOIL BEST PLACE TO SELL FROM|SHORT
USOIL SIGNAL
Trade Direction: short
Entry Level: 61.86
Target Level: 55.95
Stop Loss: 65.80
RISK PROFILE
Risk level: medium
Suggested risk: 1%
Timeframe: 1D
Disclosure: I am part of Trade Nation's Influencer program and receive a monthly fee for using their TradingView charts in my analysis.
✅LIKE AND COMMENT MY IDEAS✅

USCRUDEOIL - Potential Sell (Day Trading)Hi traders,
Next week I am looking to SELL CMCMARKETS:USCRUDEOIL .
Price Action Analysis:
4hr Chart: Price has been forming higher highs and higher lows, but has now broken a key support level (previous buyer zone), which may indicate a shift to seller control. We need to check the lower time frames to confirm if this supports a bearish bias.
1hr Chart: After breaking the buyer zone, price has started forming a new bullish structure. If this structure fails, it could confirm a sell setup. Stay on standby.
Lower timeframe: Timing for entry
Good Luck
STUDY, STUDY, STUDY. Lorenzo Tarati :)

USOIL: Continue to shortThe upper resistance of crude oil is 64.5. If it reaches 63-64, you can continue to short. The downward trend is about to begin.
Accurate signals are sent every day, all profitable and free. Account management services are also provided.
usoil sell@63-64
tp:62-60

Oil has confirmed resuming of uptrend.Oil has confirmed resuming of uptrend. Next tp is 65$. We can also see nice harmonical bullish bat pattern.

USOIL: Will Keep Falling! Here is Why:
The charts are full of distraction, disturbance and are a graveyard of fear and greed which shall not cloud our judgement on the current state of affairs in the USOIL pair price action which suggests a high likelihood of a coming move down.
Disclosure: I am part of Trade Nation's Influencer program and receive a monthly fee for using their TradingView charts in my analysis.
❤️ Please, support our work with like & comment! ❤️

usoil on 1 hr usoil continues taking resistance from trendline now it has give closing at trendline if u notice on chart whenever usoil come at trendline it goes in consolidation zone and fall down now its doing same thing so plan for monday if usoil breaking rang down side and 15 min candle is giving closing below 62.300 then it a good short opportunity till target of 61.786 to 60.248 and for we have to wait price to given closing 62.800
