WTI Oil D1 | Approaching a swing-high resistanceWTI oil (USOIL) could rise towards a swing-high resistance and potentially reverse off this level to drop lower.
Sell entry is at 62.71 which is a swing-high resistance.
Stop loss is at 66.00 which is a level that sits above the 61.8% Fibonacci retracement and a pullback resistance.
Take profit is at 58.18 which is a swing-low support.
High Risk Investment Warning
Trading Forex/CFDs on margin carries a high level of risk and may not be suitable for all investors. Leverage can work against you.
Stratos Markets Limited (tradu.com):
CFDs are complex instruments and come with a high risk of losing money rapidly due to leverage. 63% of retail investor accounts lose money when trading CFDs with this provider. You should consider whether you understand how CFDs work and whether you can afford to take the high risk of losing your money.
Stratos Europe Ltd (tradu.com):
CFDs are complex instruments and come with a high risk of losing money rapidly due to leverage. 63% of retail investor accounts lose money when trading CFDs with this provider. You should consider whether you understand how CFDs work and whether you can afford to take the high risk of losing your money.
Stratos Global LLC (tradu.com):
Losses can exceed deposits.
Please be advised that the information presented on TradingView is provided to Tradu (‘Company’, ‘we’) by a third-party provider (‘TFA Global Pte Ltd’). Please be reminded that you are solely responsible for the trading decisions on your account. There is a very high degree of risk involved in trading. Any information and/or content is intended entirely for research, educational and informational purposes only and does not constitute investment or consultation advice or investment strategy. The information is not tailored to the investment needs of any specific person and therefore does not involve a consideration of any of the investment objectives, financial situation or needs of any viewer that may receive it. Kindly also note that past performance is not a reliable indicator of future results. Actual results may differ materially from those anticipated in forward-looking or past performance statements. We assume no liability as to the accuracy or completeness of any of the information and/or content provided herein and the Company cannot be held responsible for any omission, mistake nor for any loss or damage including without limitation to any loss of profit which may arise from reliance on any information supplied by TFA Global Pte Ltd.
The speaker(s) is neither an employee, agent nor representative of Tradu and is therefore acting independently. The opinions given are their own, constitute general market commentary, and do not constitute the opinion or advice of Tradu or any form of personal or investment advice. Tradu neither endorses nor guarantees offerings of third-party speakers, nor is Tradu responsible for the content, veracity or opinions of third-party speakers, presenters or participants.
USOUSD trade ideas


Heading into 61.8% Fibonacci resistance?WTI Oil (XTI/USD) is rising towards the pivot which has been identified as a pullback resistance and could reveres to the 1st support which is a pullback support.
Pivot: 65.90
1st Support: 54.96
1st Resistance: 71.31
Risk Warning:
Trading Forex and CFDs carries a high level of risk to your capital and you should only trade with money you can afford to lose. Trading Forex and CFDs may not be suitable for all investors, so please ensure that you fully understand the risks involved and seek independent advice if necessary.
Disclaimer:
The above opinions given constitute general market commentary, and do not constitute the opinion or advice of IC Markets or any form of personal or investment advice.
Any opinions, news, research, analyses, prices, other information, or links to third-party sites contained on this website are provided on an "as-is" basis, are intended only to be informative, is not an advice nor a recommendation, nor research, or a record of our trading prices, or an offer of, or solicitation for a transaction in any financial instrument and thus should not be treated as such. The information provided does not involve any specific investment objectives, financial situation and needs of any specific person who may receive it. Please be aware, that past performance is not a reliable indicator of future performance and/or results. Past Performance or Forward-looking scenarios based upon the reasonable beliefs of the third-party provider are not a guarantee of future performance. Actual results may differ materially from those anticipated in forward-looking or past performance statements. IC Markets makes no representation or warranty and assumes no liability as to the accuracy or completeness of the information provided, nor any loss arising from any investment based on a recommendation, forecast or any information supplied by any third-party.

usoilselling usoil 61.21
sl 63.62
tp 53.96
driill baby drill
shorting now
1% risk each setup
like an follow , helps the page thanks

Strategic Analysis of Crude Oil for Next WeekBehind the current fluctuations in international oil prices lies the market's deep anxiety over the extreme uncertainty of global trade policies. Trump's "suspension + escalation" approach has, in the short term, stabilized relations with non - Chinese economies, but it has also dealt a blow to the global supply chain and energy consumption confidence.
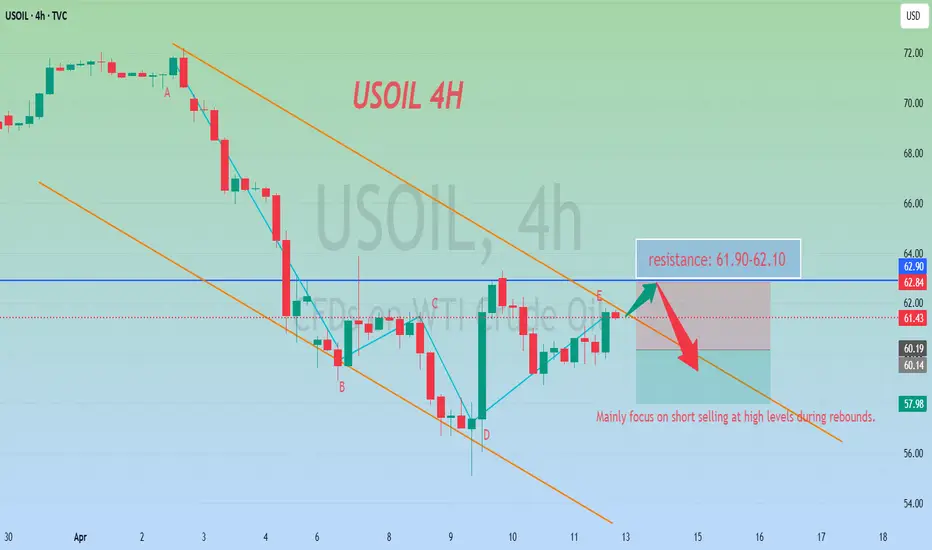
In terms of the trading ideas for crude oil next week, it is recommended to mainly go short at high levels during rebounds and go long at low levels during pullbacks as a supplement. In the short term, pay attention to the resistance level in the range of 62.8 - 63.2. In the short term, focus on the support level in the range of 60.5 - 59.5.
Oil trading strategy:
sell @ 61.90-62.10
sl 62.80
tp 61.70-61.40
If you approve of my analysis, you can give it a thumbs-up as support. If you have different opinions, you can leave your thoughts in the comments.Thank you!
USOIL may continue to decline due to tariffsRestricted Economic Growth : The United States imposes tariffs, and other countries take countermeasures, intensifying global trade frictions and greatly increasing the risk of economic recession. NIESR predicts that if Trump imposes a 10% tariff on the world and a 60% tariff on China, the global GDP will shrink by 2% and the trade volume will decrease by 6% within five years 😕. The weak economy causes the demand for crude oil in various industries to decline, leading to a drop in the price of USOIL 📉.
Changes in Crude Oil Supply and Demand :
Demand Side: China imposes tariffs on U.S. crude oil, raising the import cost and reducing the import volume. The United States imposes tariffs on energy imports from Canada and Mexico, affecting the crude oil exports of these two countries to the U.S., reducing the demand for crude oil in the United States and putting pressure on the price of USOIL 😟.
Supply Side: After China reduces its imports of U.S. crude oil, it increases imports from other exporting countries, changing the global crude oil supply pattern and possibly strengthening the expectation of a supply surplus. The decrease in U.S. crude oil exports may lead to an increase in domestic inventory, exerting downward pressure on the price of USOIL 😣.
Influenced Market Sentiment :
The uncertainty of tariff policies and the escalation of trade frictions trigger market panic and speculation, intensifying the volatility of the crude oil market. Investors, being pessimistic, sell futures contracts, further driving down the price of USOIL 😨.
This upward movement has led to the clearing of many traders' accounts or significant losses 😫. You can follow my signals and gradually recover your losses and achieve profitability 🌟.
💰💰💰 USOIL💰💰💰
🎯 Sell@61.0 - 61.5
🎯 TP 59.0 - 58.0
Traders, if you're fond of this perspective or have your own insights regarding it, feel free to share in the comments. I'm really looking forward to reading your thoughts! 🤗

WTI Crude Oil Bearish Reversal Setup – Short from Resistance ZonEntry Point: 62.66 USD
Stop Loss: 65.26 USD
Target Point (Take Profit): 55.09 USD
Indicators:
EMA 200 (blue): 60.92 USD — long-term trend indicator
EMA 30 (red): 60.75 USD — short-term trend indicator
Analysis:
1. Bearish Setup:
The price is approaching a key resistance zone marked by the purple shaded area near 62.66.
The strategy is to short from this level, anticipating a drop to the 55.09 target area.
2. Risk/Reward:
Risk (SL - Entry): 65.26 - 62.66 = 2.60 USD
Reward (Entry - TP): 62.66 - 55.09 = 7.57 USD
Risk-to-reward ratio: ~1:2.9, which is favorable.
3. Support/Resistance Confirmation:
Multiple touches at the resistance zone (or

USOILUSOIL short term downside and then we will see some reaction below 60.
Disclosure: We are part of Trade Nation's Influencer program and receive a monthly fee for using their TradingView charts in our analysis.

USOIL BULLISH BIAS RIGHT NOW| LONG
USOIL SIGNAL
Trade Direction: long
Entry Level: 61.45
Target Level: 73.89
Stop Loss: 53.11
RISK PROFILE
Risk level: medium
Suggested risk: 1%
Timeframe: 1D
Disclosure: I am part of Trade Nation's Influencer program and receive a monthly fee for using their TradingView charts in my analysis.
✅LIKE AND COMMENT MY IDEAS✅

oil and gold prices are divergingsince 2022, the price of oil and gold
have been diverging but they mostly
will shadow each other. Commodities
reflect the inflation of the money supply.
This is the simple reason why they move
together.
they also diverged in 2018 but then
realigned. this is a good
time to buy oil companies.

WTI - buy here or wait for 68$ My analysis of WTI in early December was good and it did wat I expected, but a stupid stop kicked me out it wave 2.
Then got the perfect entry for the short at 80.5 but didn't hold long enough...
So what to do next ? Could buy it here at the 0.236 retracement but I'd rather buy at 68.5 with a stop at 67.
Always keep in mind there is also politics involved here. Oil producers need higher prices to be profitable but on the other hand they want the price of oil to drop so Russia cannot sustain their war in Ukraine.

USOIL Set To Fall! SELL!
My dear friends,
Please, find my technical outlook for USOIL below:
The price is coiling around a solid key level - 61.43
Bias - Bearish
Technical Indicators: Pivot Points Low anticipates a potential price reversal.
Super trend shows a clear sell, giving a perfect indicators' convergence.
Goal - 60.40
About Used Indicators:
The pivot point itself is simply the average of the high, low and closing prices from the previous trading day.
Disclosure: I am part of Trade Nation's Influencer program and receive a monthly fee for using their TradingView charts in my analysis.
———————————
WISH YOU ALL LUCK

USOIL POSSIBLE BUY OPPORTUNITY TO $68Price might likely trade back to $68 or $69 level after we had price plummet . A buy opportunity is envisaged this coming week. We anticipate price to trade bullish all the way to $68 or $69

USOIL: Local Bearish Bias! Short!
My dear friends,
Today we will analyse USOIL together☺️
The in-trend continuation seems likely as the current long-term trend appears to be strong, and price is holding below a key level of 61.501 So a bearish continuation seems plausible, targeting the next low. We should enter on confirmation, and place a stop-loss beyond the recent swing level.
❤️Sending you lots of Love and Hugs❤️

"WTI / U.S Crude Oil" Energy Market Heist Plan (Scalping/Day)🌟Hi! Hola! Ola! Bonjour! Hallo! Marhaba!🌟
Dear Money Makers & Robbers, 🤑 💰💸✈️
Based on 🔥Thief Trading style technical and fundamental analysis🔥, here is our master plan to heist the "WTI / U.S Crude Oil" Energy Market. Please adhere to the strategy I've outlined in the chart, which emphasizes long entry. Our aim is to escape near the high-risk MA Zone. Risky level, overbought market, consolidation, trend reversal, trap at the level where traders and bearish robbers are stronger. 🏆💸"Take profit and treat yourself, traders. You deserve it!💪🏆🎉
Entry 📈 : "The vault is wide open! Swipe the Bullish loot at any price - the heist is on!
however I advise to Place buy limit orders within a 15 or 30 minute timeframe nearest or swing low or high level for pullback entries.
Stop Loss 🛑:
Thief SL placed at the Nearest / Swing low level Using the 30mins timeframe (58.000) Day trade basis.
SL is based on your risk of the trade, lot size and how many multiple orders you have to take.
🏴☠️Target 🎯: 66.000 (or) Escape Before the Target
🧲Scalpers, take note 👀 : only scalp on the Long side. If you have a lot of money, you can go straight away; if not, you can join swing traders and carry out the robbery plan. Use trailing SL to safeguard your money 💰.
💰💵💸🛢"WTI / U.S Crude Oil" Energy Market Heist Plan (Scalping/Day) is currently experiencing a bullishness,., driven by several key factors. 👇👇👇
📰🗞️Get & Read the Fundamental, Macro Economics, COT Report, Inventory and Storage Analysis, Seasonal Factors, Sentimental Outlook, Intermarket Analysis, Future trend targets & Overall Score... go ahead to check 👉👉👉🔗🔗
⚠️Trading Alert : News Releases and Position Management 📰 🗞️ 🚫🚏
As a reminder, news releases can have a significant impact on market prices and volatility. To minimize potential losses and protect your running positions,
we recommend the following:
Avoid taking new trades during news releases
Use trailing stop-loss orders to protect your running positions and lock in profits
💖Supporting our robbery plan 💥Hit the Boost Button💥 will enable us to effortlessly make and steal money 💰💵. Boost the strength of our robbery team. Every day in this market make money with ease by using the Thief Trading Style.🏆💪🤝❤️🎉🚀
I'll see you soon with another heist plan, so stay tuned 🤑🐱👤🤗🤩

XTIUSD Buy Setup – 15M Entry with 4H Confluence (April 11, 2025🔍 Multi-Timeframe Confluence Strategy
This trade is a bullish entry on the 15-minute chart of Crude Oil (XTIUSD), based on a confirmed bullish structure shift on the 4H timeframe. The 15M entry aligns perfectly with HTF (higher timeframe) momentum, making this a high-probability setup.
⏰ 4H Timeframe Breakdown:
Price has broken previous 4H lower highs, confirming a structure shift from bearish to bullish.
Strong bullish engulfing candles have cleared resistance levels, turning them into new support.
Market is likely to start forming higher highs and higher lows going forward.
🧠 15-Minute Entry Logic:
Entry taken after retracement into minor 15M demand zone.
Trade executed at the point of short-term liquidity sweep, followed by bullish confirmation candle.
This creates a perfect LTF entry within HTF trend direction.
📌 Trade Setup Details:
Entry Price: Around 60.40 – 60.50
Stop Loss: Below intraday structure at 58.50
Take Profit: Targeting previous resistance at 63.40
✅ Why This Setup Works:
✅ 4H Structure Shift → Higher timeframe bias is now bullish
✅ 15M Pullback Entry → Clean risk-defined entry
✅ Liquidity Sweep → Market hunted stops before reversing (classic smart money move)
✅ Clear RR Setup → High reward for controlled risk
📢 Pro Tip:
Keep monitoring oil-related fundamentals and U.S. economic data (like inventories, geopolitical tension, etc.)—they often trigger momentum in XTIUSD.
RRR (Risk-Reward): Approx. 1:3, ideal for intra-swing or scalping objectives

Crude oil is under pressure, as recession fears reviveCrude oil had initiated a classical short coverage rally: despite a big bullish day, around 2% (42699 contracts on Nymex) of total open interest for Crude oil futures was liquidated, which means that a massive pullback was not associated with the new business coming in, but rather an old business getting out.
Despite the local optimism, market fear still dominates with VIX getting back to 46: a quite notable level. With that we can expect USOIL to continue sliding down in the near future and reaching the area below $57, at least temporarily. The fair price according to expected supply and demand had shifted to $60 (previously $75), as published in the short-term energy outlook from eia.gov
Don't forget - this is just the idea, always do your own research and never forget to manage your risk!

USOIL Short Trade Idea – Targeting $55.05 from $61.00Entry Point: ~61.00 USD
Stop Loss (SL): 64.77 USD
Target (TP): 55.05 USD
Risk/Reward Ratio: Favorable
Risk: ~3.77 USD
Reward: ~5.95 USD
Approximate R/R ratio: 1:1.58
🧠 Strategy Insight
Trend Context:
Prior to the entry zone, price shows a strong downtrend.
The price retraced upward into a resistance zone (highlighted in purple).
The setup suggests a short position anticipating rejection from this zone.
Indicators:
Moving Averages (red & blue):
Likely 50 EMA and 200 EMA showing bearish alignment (price mostly under both).
Resistance Zone:
The purple shaded region represents a supply zone, where price previously reversed.
Entry Zone Analysis:
Entry just below a recent rejection candle.
It's a conservative spot to catch a move back in the direction of the dominant trend.
Target Zone (55.05):
Likely based on a recent support level or demand zone from earlier price action.
Matches previous lows.
🔁 Possible Scenarios
✅ Bearish Scenario (Ideal Outcome):
Price gets rejected from the resistance zone and continues the downtrend toward the target at 55.05.
❌ Bullish Scenario (Risk):
Price breaks above 61.00 and continues toward 64.77, invalidating the short setup.

WTI Oil H4 | Approaching a swing-high resistanceWTI oil (USOIL) is rising towards a swing-high resistance and could potentially reverse off this level to drop lower.
Sell entry is at 62.71 which is a swing-high resistance.
Stop loss is at 66.00 which is a level that sits above the 61.8% Fibonacci retracement and a pullback resistance.
Take profit is at 57.01 which is a swing-low support.
High Risk Investment Warning
Trading Forex/CFDs on margin carries a high level of risk and may not be suitable for all investors. Leverage can work against you.
Stratos Markets Limited (tradu.com):
CFDs are complex instruments and come with a high risk of losing money rapidly due to leverage. 63% of retail investor accounts lose money when trading CFDs with this provider. You should consider whether you understand how CFDs work and whether you can afford to take the high risk of losing your money.
Stratos Europe Ltd (tradu.com):
CFDs are complex instruments and come with a high risk of losing money rapidly due to leverage. 63% of retail investor accounts lose money when trading CFDs with this provider. You should consider whether you understand how CFDs work and whether you can afford to take the high risk of losing your money.
Stratos Global LLC (tradu.com):
Losses can exceed deposits.
Please be advised that the information presented on TradingView is provided to Tradu (‘Company’, ‘we’) by a third-party provider (‘TFA Global Pte Ltd’). Please be reminded that you are solely responsible for the trading decisions on your account. There is a very high degree of risk involved in trading. Any information and/or content is intended entirely for research, educational and informational purposes only and does not constitute investment or consultation advice or investment strategy. The information is not tailored to the investment needs of any specific person and therefore does not involve a consideration of any of the investment objectives, financial situation or needs of any viewer that may receive it. Kindly also note that past performance is not a reliable indicator of future results. Actual results may differ materially from those anticipated in forward-looking or past performance statements. We assume no liability as to the accuracy or completeness of any of the information and/or content provided herein and the Company cannot be held responsible for any omission, mistake nor for any loss or damage including without limitation to any loss of profit which may arise from reliance on any information supplied by TFA Global Pte Ltd.
The speaker(s) is neither an employee, agent nor representative of Tradu and is therefore acting independently. The opinions given are their own, constitute general market commentary, and do not constitute the opinion or advice of Tradu or any form of personal or investment advice. Tradu neither endorses nor guarantees offerings of third-party speakers, nor is Tradu responsible for the content, veracity or opinions of third-party speakers, presenters or participants.

WTI - Will Iran return to the group of oil producers?!WTI oil is below the EMA200 and EMA50 on the 4-hour timeframe and is moving in its medium-term descending channel. If the correction towards the supply zone continues, the next oil selling opportunity with a suitable reward for risk will be provided for us. In this direction, with confirmation, we can look for oil buying transactions.
The U.S. Energy Information Administration (EIA), in its latest report, has downgraded its forecasts for oil and natural gas production, consumption, and prices for 2025 and 2026, while warning about the uncertain outlook of the energy market amidst economic volatility and escalating trade tensions.
According to the updated estimates, U.S. crude oil production in 2025 is expected to reach 13.51 million barrels per day, down from the previous forecast of 13.61 million barrels. For 2026, the figure has been revised to 13.56 million barrels per day, a reduction from the earlier 13.76 million forecast. Monthly data shows average U.S. oil output stood at 13.44 million barrels per day in April and 13.55 million in March, with similar levels expected in May.
Globally, EIA projects oil production in 2025 to be around 104.1 million barrels per day, slightly down from the earlier estimate of 104.2 million. For 2026, the revised figure stands at 105.3 million barrels per day compared to the previous 105.8 million.
On the demand side, global oil consumption forecasts have also been reduced. In 2025, demand is now estimated at 103.6 million barrels per day instead of 104.1 million, and for 2026 it is projected at 104.7 million barrels per day, down from the prior estimate of 105.3 million.
Regarding natural gas, the EIA reports that average U.S. gas production in April will be around 115 billion cubic feet per day, slightly lower than the 115.3 billion cubic feet reported in March. May’s forecast stands at 115.4 billion cubic feet. Demand has also dipped, with estimates for 2025 now at 91.2 billion cubic feet per day (down from 92), and for 2026 at 90.5 billion (previously 91.1).
In terms of pricing, EIA has made significant downward revisions. The average price of West Texas Intermediate (WTI) crude oil is now forecast to be $63.88 per barrel in 2025, compared to the earlier $70.68. For 2026, this drops further to $57.48. Brent crude is now estimated at $67.87 for 2025 and $61.48 for 2026, both notably lower than prior projections.
One key highlight from the report is EIA’s warning about high volatility in major commodity prices, especially crude oil. The agency underlined that reciprocal tariffs between China and the U.S. could heavily impact markets, particularly the propane sector.
EIA noted that U.S. liquefied natural gas (LNG) exports are likely to remain resilient despite trade disputes. This is attributed to strong global demand and the flexible nature of U.S. export contracts, which allow unrestricted shipments to multiple destinations.
However, when it comes to oil and petroleum products, the agency maintained a more cautious tone, emphasizing that recent shifts in global trade policies and oil production patterns may slow the growth of demand for petroleum-based products through 2026.
Altogether, the downward revisions by the EIA carry a clear message: the energy market outlook over the coming years is fraught with uncertainty. From supply and demand to pricing, political and economic forces such as trade wars and potential global recessions are expected to play decisive roles.
Meanwhile, according to Reuters, after U.S. President Donald Trump once again threatened military action if Tehran refuses to agree to a nuclear deal, a senior Iranian official responded by warning that Iran may halt its cooperation with the U.N.’s nuclear watchdog.
Reports indicate that American and Iranian diplomats will meet in Oman on Saturday to begin talks on Tehran’s nuclear program. Trump stated that he would have the final say on whether the negotiations are failing, which could place Iran in a highly dangerous position.
Ali Shamkhani, a senior adviser to Iran’s Supreme Leader, posted on X (formerly Twitter) that ongoing foreign threats and the looming threat of military confrontation could lead to deterrent actions such as expelling International Atomic Energy Agency (IAEA) inspectors and cutting ties with the agency.He also mentioned that relocating enriched uranium to secure, undisclosed locations within Iran may be under consideration

WTI Crude OilWTI Crude Oil
bullish divergence ,inverse head and shoulder pattern ,ChoC and retracement to FVG, Price in Premium Discount Zone ,
Entry at Current price
stop loss 58.20
TP 65.21 with 2.4 RRR

Crude Oil Found Support: What's Next?FenzoFx—Crude oil tested the $58.9 level as support and bounced back from it. The primary trend is bearish; therefore, it will likely resume if the price closes and stabilizes below this support.
If this scenario unfolds, the next bearish target could be the $55.15 support level.
>>> Win $160.0 prize every week by joining FenzoFx contest.

Remove Impulsiveness by planning your trade!! BUY OIL All the information you need to find a high probability trade are in front of you on the charts so build your trading decisions on 'the facts' of the chart NOT what you think or what you want to happen or even what you heard will happen. If you have enough facts telling you to trade in a certain direction and therefore enough confluence to take a trade, then this is how you will gain consistency in you trading and build confidence. Check out my trade idea!!
www.tradingview.com
