Why Traders Freeze: The Psychology Behind Not Cutting LossesFirst up: let’s address the elephant in the room. Loss aversion — that great human flaw. From the moment your ancient ancestor decided to poke a saber-toothed tiger to see what happens, the brain has been hard-coded to avoid pain at all costs.
Loss aversion is literally in your DNA — studies show people feel the sting of a loss twice as intensely as the pleasure of an equivalent gain.
When you see that trade slip into the red, your rational brain may say, “Cut it, the setup is invalid, live to trade another day.” But your emotional brain — the one still grunting in a cave — is screaming, “It might come back! Hold! HOOOLD!” So you sit, frozen.
🌱 Hope: The Most Expensive Four-Letter Word
Hope is the silent killer of trading accounts. You think you’re being patient as you decide to give the trade “room to breathe.”
But what you’re really doing is outsourcing your exit strategy to technical tools, news headlines, and anything that’s not your own choice, hoping something will rescue your losing position.
This is how tiny losses can turn into portfolio ruin. Just ask anyone who’s held a small-cap memecoin down 90% because the “team has potential.”
🧊 Analysis Paralysis: When the Chart Becomes a Maze
Another reason traders freeze? Overanalysis. One bad candle and suddenly you’re toggling between the 1-minute, 5-minute, and daily chart like you’re hacking into the Pentagon. And your trendlines? You’re probably drawing them wrong .
More data rarely leads to more decisive action. It just feeds your brain conflicting signals until you’re convinced you see a bounce that isn’t there. Meanwhile, the loss grows. And grows. And then you’re back to hope. Rinse, repeat.
😬 The Ego Monster: Admitting You’re Wrong
Here’s the harsh truth: cutting a loss means admitting you were wrong. For traders, whose entire identity can hinge on being “smart money,” that feels like public humiliation. The ego monster wants you to be right more than it wants you to be profitable.
So instead of taking the small L, you’ll cling to the trade because closing it out would force you to look in the mirror and say, “I was wrong and I need to do better.”
🏴☠️ From Risk Management to Revenge Trading
Once you’ve frozen long enough, you reach the next stage of the bad-losing cycle: revenge trading . Now you’re not just trying to recover your loss; you’re out to punish the market for “taking” your money.
Spoiler alert: the market doesn’t know you exist, and it certainly doesn’t care. Maybe this is the gambler’s mindset disguised as a “strategy?”
📉 Blame the Tools? Not So Fast
Some traders love to blame outside factors like the Economic calendar or their indicators when they freeze. “My RSI didn’t signal this! The MACD betrayed me!” Indicators are just tools — they don’t make decisions for you. You do.
Hiding behind tools means you refuse to take accountability. It’s a convenient excuse that can keep you stuck in the same losing habits. Better to master the one tool that matters: your discipline .
✂️ The Beauty of the Hard Stop
All hail the hard stop — the trader’s seatbelt. It’s not attractive, it’s mechanical, but it’s often the only thing standing between you and a potentially blown-up account.
The reason some traders can survive the market for decades isn’t because they’re never wrong — it’s because they’ve learned to make their stops non-negotiable.
A stop-loss is you telling your brain, “Hey, I’m not smarter than the market, so I’ll automate the decision before I get emotional.” It takes the agony out of cutting a loss because you’ve already decided on the outcome before your lizard brain can intervene.
⚖️ Small Losses Are the Cost of Doing Business
Want to feel better about cutting that loss? Think of it as your tuition fee. Every trader pays a certain cost to the market — it’s the cost of playing the game. No one gets every trade right. The pros just get better at losing small.
Those big-shot money spinners you look up to? They didn’t build their empire by never losing. They’re pros at getting out when they’re wrong. The difference between a pro and a blow-up isn’t the winning trade — it’s the ruthless discipline on the losing ones.
🧘♂️ Finding Comfort in Discomfort
There’s no magic trick to make loss-cutting feel good. It always stings. But you can train your brain to see a small loss as a win for your long-term survival. Write it down. Journal the trade . Log the emotion. Over time you’ll realize that the trades you exit early rarely haunt you.
🏁 Face the Fear, Keep the Account
And finally, freezing in front of a loss doesn’t protect you — it likely means you’ll pay more than you should. Next time your gut says, “Maybe it’ll come back…” ask yourself: “Do I want to be right, or do I want to trade another day?”
Your job is to trade well and stay in the game for as long as possible.
Your turn, traders : what’s your biggest “should’ve cut it sooner” horror story? Drop it below — we promise not to say we told you so.
USSP500CFD trade ideas

Let’s talk about technical analysis & stops.Technical analysis is not your decision-making process — it’s a tool to help you structure better trading decisions by studying past price movements to anticipate likely future moves.
👉 Every time you look at a chart, you should decide:
✅ Do I want to trade at all?
✅ What’s my entry?
✅ Where’s my stop (when does my thesis fail)?
✅ What’s my target (where will I take profits)?
________________________________________
🛑 Where to put your stop?
Take the S&P 500 daily chart. It’s been trending up strongly. Many traders use an exponential moving average (EMA) as a dynamic stop.
But:
• A 9 EMA often stops you out too early on strong trends.
• Adjusting to a 15 or 16 EMA could keep you in the trade longer, letting your winners run.
In tools like TradingView, you can visually adjust the EMA and see in real time how it would have kept you in or taken you out.
________________________________________
💡 Key takeaway:
When price closes below your EMA stop — that’s your signal to exit and lock in profits.
Use TA to structure your trades, not just spot pretty patterns.
________________________________________
💬 What’s your favourite method for setting stops?
Disclaimer:
The information posted on Trading View is for informative purposes and is not intended to constitute advice in any form, including but not limited to investment, accounting, tax, legal or regulatory advice. The information therefore has no regard to the specific investment objectives, financial situation or particular needs of any specific recipient. Opinions expressed are our current opinions as of the date appearing on Trading View only. All illustrations, forecasts or hypothetical data are for illustrative purposes only. The Society of Technical Analysts Ltd does not make representation that the information provided is appropriate for use in all jurisdictions or by all Investors or other potential Investors. Parties are therefore responsible for compliance with applicable local laws and regulations. The Society of Technical Analysts will not be held liable for any loss or damage resulting directly or indirectly from the use of any information on this site.

SPX500 Formed false breakout Bearish Bias 6,205 SP500 Short-Term Bearish Bias
The SPX500 remains under pressure as it trades below the key resistance level of 6260. Price action suggests a potential rejection from this resistance, signalling a continuation of downside momentum.
This bearish sentiment is further fuelled by recent tariff escalations by President Trump, which are weighing heavily on investor sentiment across global indices.
You can see more details in the chart Ps Support with like and comments for more analysis Thanks for supporting.

S&P500 Strong Buy Signal flashed for the 3rd time in 2 years!The S&500 index (SPX) is comfortably trading above its previous All Time High (ATH) and shows no signs of stopping here. Coming off a 1D MA50/ 100 Bullish Cross, we expect the 1D MA50 (blue trend-line) to turn now into the first long-term Support going towards the end of the year.
The last 1D MA50/ 100 Bullish Cross (December 15 2023) was nothing but a bullish continuation signal, which extended the uptrend all the way to the 2.0 Fibonacci extension, before a pull-back test of the 1D MA100 (green trend-line) again.
The 1W RSI is now on the same level (63.30) it was then. In fact it is also on the same level it was on June 05 2023, which was another such bullish continuation signal that peaked on the 2.0 Fib ext.
This suggests that we have a rare long-term Buy Signal in our hands, only the 3rd time in 2 years that has emerged. Based on that, we should be expecting to see 7600 as the next Target before it hits the 2.0 Fib ext and pulls back to the 1D MA100 again and there is certainly enough time to do this by the end of the year, assuming the macroeconomic environment favors (trade deals, potential Fed Rate cuts etc).
-------------------------------------------------------------------------------
** Please LIKE 👍, FOLLOW ✅, SHARE 🙌 and COMMENT ✍ if you enjoy this idea! Also share your ideas and charts in the comments section below! This is best way to keep it relevant, support us, keep the content here free and allow the idea to reach as many people as possible. **
-------------------------------------------------------------------------------
Disclosure: I am part of Trade Nation's Influencer program and receive a monthly fee for using their TradingView charts in my analysis.
💸💸💸💸💸💸
👇 👇 👇 👇 👇 👇

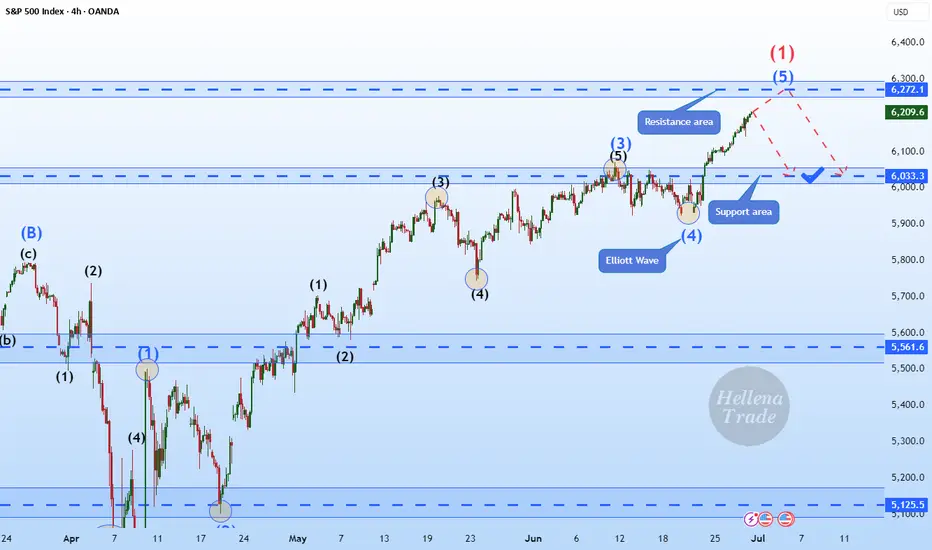
Hellena | SPX500 (4H): SHORT to support area of 6033.Colleagues, I assume that wave “1” completes the upward movement and somewhere around here a major correction ‘2’ should begin, which will consist of waves “ABC” and may continue to the level of 5700. But for now, I think we need to focus on the nearest targets.
I see the support area of 6033 as the first target.
Manage your capital correctly and competently! Only enter trades based on reliable patterns!
X1: SPX500/US500 Short Trade Risking 1% to make 1.35%FOREXCOM:SPX500 / CAPITALCOM:US500 Short for week, with my back testing of this strategy, it hits multiple possible take profits, manage your position accordingly.
Risking 1% to make 1.35%
Note: Manage your risk yourself, its risky trade, see how much your can risk yourself on this trade.
TP-1 is high probability TP but don't overload your risk like greedy, be disciplined trader.
Use proper risk management
Looks like good trade.
Lets monitor.
Use proper risk management.
Disclaimer: only idea, not advice

SP500 Bullish Momentum Amid Trade DevelopmentsThe US stock index continues to trade higher as overall market sentiment remains bullish, driven by optimism despite Donald Trump's aggressive tariff stance and ongoing global trade negotiations.
Currently, the index is consolidating within a narrow range around 6260. A confirmed breakout from this zone is essential to determine the next directional move. then Upside Target will be :6,250 and 6,300
If you like this idea if you Have on Opinion about this analysis share in comments.

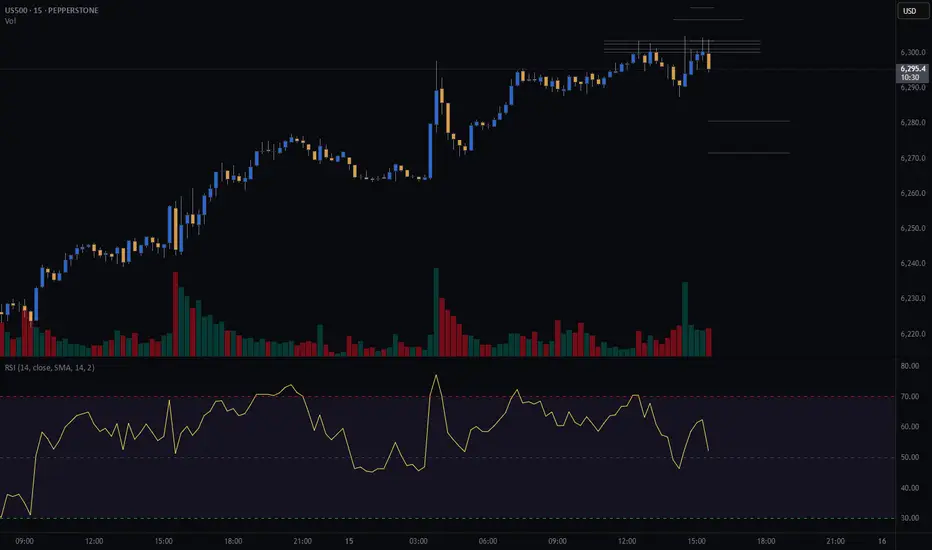
S&P500 (CASh500) Short - double top 15minEntry = 6303.4
SL = 6312.8
Take profit level 1 = 6280.7
Take profit level 2 = 6271.6
SPX500 Bearish Below 6246 – Eyes 6223 and 6195SPX500 Analysis
SPX500 stays under bearish pressure below 6246, targeting 6223 and possibly 6195 if the decline continues.
Recent tariff escalation by President Trump is adding weight to downside momentum across indices.
Pivot: 6246
Support: 6223, 6195, 6143
Resistance: 6268, 6291

SPX Expansion with Historical DataGood morning everyone!
This week I wanted to elaborate more on my previous idea of SPX with the historical data that led to this analysis. This is almost all fundamental analysis adding in the retracement percentages which can also be evaluated through some technical instruments.
Unemployment rate is currently at 4.1%, with inflation at 2.4%. Based on the data, it is evident the market is currently in an expansion period which is why the narrative that we will see 2 interest rate drops by the end of year continues to diminish. I think we will probably see 1 before the year ends and that would just fuel the market and gain momentum to the upside.
If we were to measure the expansion of SPX going back to the 2000's, we get an extension of at least 75%. If we were to extend 75% based on the previous swing high (6,147) we could see future SPX price at 8,500. Now, do your own research, but the data is here. I expect the market to possibly retest previous high, but if you did not enter during the dip, no worries. There is still plenty of upside potential and better late than never.
Remember... CASH FLOW IS KING!
Avoid all the noise and distractions. The job of many platforms out there is to have something to put out for the public EVERYDAY! A good amount of that is noise. Look for macroeconomic news and let that be your indicator.
Historical Data:
(1) .com Bubble (2000 - 2002) We had a 50% drop of SPX. This lasted for almost 2 years before recovery.
(2) Housing Market (2007 - 2009) The SPX dropped 57% due to the collapse of subprime lenders collapsing. Housing prices decline drastically leaving people with high mortgage payments than what their homes are actually worth leading to a wave of foreclosures.
(3) Covid (2020) This was a global event with government mandated shutdowns causing the entire financial markets to come to a halt. Many business closures that led to jobs loss with an unemployment rate of approximately 15%.
(4) Inflation & Rate Hikes (2022) When Covid happened, upon recovery market expanded way too fast causing inflation to rise and the Feds to increase interest rates to slow down the economy.
(5) Tariffs (2025) Will stay away from politics on this one, however, a rebalancing of trade has taken place with some countries still working on tariff deals with the U.S. This has caused huge uncertainty for companies and corporation. VIX (fear index) reached 60.13.
Hope you enjoyed this post. Have a great rest of your week, don't forget to like and follow and Happy Trading!

20% in 60 daysSince the 90's we have seen many times where the broader market (SPX) has seen a pretty significant pull back, more than 10% and then a rally. Almost every time the market rose more than 20% in 60 days or less has been a good place to take profits. Clearly everything is super bullish right now, and I am not saying this will be the top, I am simply saying, we could experience a correction driven by profit taking. In an uptrend, you want to be a buyer on pull backs, so a pull back could give us another longer term opportunity

$100 to $1k to $10k to $100k: TRADING MASTERCLASSHow I approach trading:
Trading is a mostly psychological endeavor
You will not WIN LONGTERM in trading until you WIN YOURSELF (i.e. master your emotions)
I use Technical Analysis to help me determine overall Market Direction and Entry/Exit points
I do not use ANY fundamental analysis in my trading
I use Elliott Wave Theory to understand MARKET STRUCTURE
I use a combination of Anchored Volume Weighted Average Price (AVWAP), Fixed Range Volume Point of Control (VPOC) and custom coded Momentum indicators to pinpoint Entry/Exit points
Risk Management:
I will generally aim for 2%-5% percent stop loss but price structure will dictate as well
Position sizing will be fluid
Targets will be fluid but will generally target key Fib Extensions, VWAPs or VPOCs..or a combination of all of the above
Starting Account Size:
$100
Goal:
Grow a small $100 account to $1k then $10k then $100k
Every trade will be public...wins and losses
I will be looking to make my first trade(s) shortly and will show Entry level, Stop Loss and Target
NONE OF THIS CONSTITUTES FINANCIAL ADVICE

IS THE STOCK MARKET HEADING INTO DOT COM BUBBLE 2.0?In this video we look at the 3 month chart of SP:SPX using the traders dynamic index & Fibonacci retracement levels to put together a bullish case for the overall stock market to go on a monster rally over the next 7 years
We also theorize about how over the next 2 years the SP:SPX can indeed hit 7200+ by Q3 2026 and have pullbacks to 5800-6100, but how that could just be the "consolidation move in price" of the overall stock market before we get what could end up being the largest stock market rally we have ever seen in the 21st century

S&P500 Accumulation almost over. New rally begins.The S&P500 index (SPX) has been trading within a 3-month Channel Up pattern, within which, it's been replicating almost the same structure. This involves an aggressive Bullish Leg Phase (dotted Channel Up), followed by a correction/ Accumulation Phase (blue Channels), which eventually leads to the new Bullish Leg.
The 1D RSI fractals among those patterns are similar and right now it seems that we are about to complete the latest Accumulation Phase. Having completed a 1D Golden Cross 2 weeks ago, the time-frame looks more bullish than ever and as long as the 1D MA50 (blue trend-line) holds, we expect at least a +5.68% rise (the minimum of the previous Bullish Legs), targeting 6550.
-------------------------------------------------------------------------------
** Please LIKE 👍, FOLLOW ✅, SHARE 🙌 and COMMENT ✍ if you enjoy this idea! Also share your ideas and charts in the comments section below! This is best way to keep it relevant, support us, keep the content here free and allow the idea to reach as many people as possible. **
-------------------------------------------------------------------------------
Disclosure: I am part of Trade Nation's Influencer program and receive a monthly fee for using their TradingView charts in my analysis.
💸💸💸💸💸💸
👇 👇 👇 👇 👇 👇

S&P 500 Technical Analysis – Potential Correction AheadThe S&P 500 is approaching critical historical resistance levels, just as economic headwinds begin to resurface — particularly the expiration of tariff ceasefire agreements and renewed trade tensions. These overlapping factors could signal an upcoming technical correction.
🔹 From a technical standpoint:
The index is forming a classic multiple-top pattern, typically associated with weakening bullish momentum and potential trend reversals.
However, we remain cautious and will only consider a bearish scenario if the 6200 support level is broken on a daily close.
📉 Proposed Trading Plan:
• Short entry: Only if the daily close is below 6200
• Stop-loss: Daily close above the last top
• Targets in order:
• 5800
• 5500
• 5250
⚠️ Note: Despite the bearish setup, we do not recommend rushing into selling without confirmation of support break.

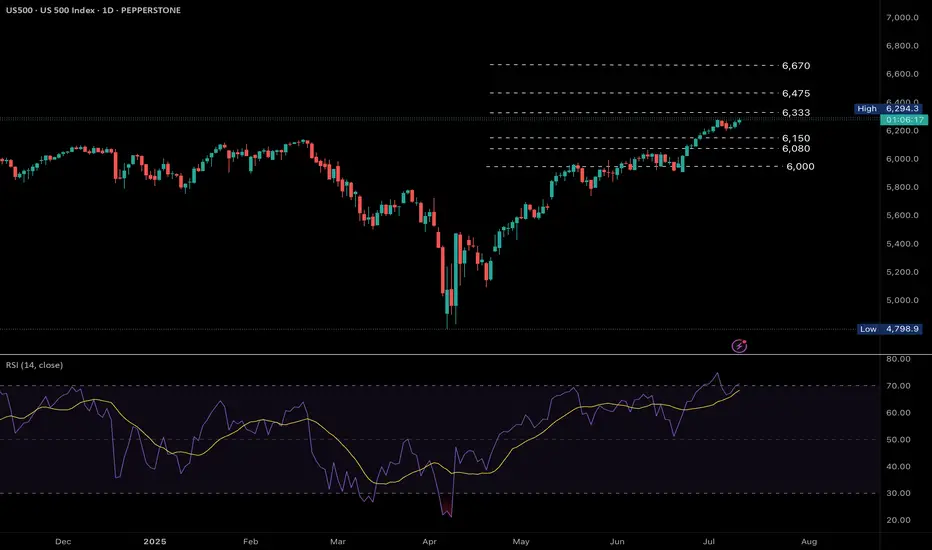
US500 trending higher as the US earnings season gains momentum. Fundamental
US500 is pushing higher as the US 2nd quarter earnings season gains momentum under President Trump's second administration amidst tariffs. Big tech earnings will have a significant impact on the index price action.
Technical
Bullish momentum is gaining as the uptrend remains strong. The RSI is approaching the overbought region however a break above the 6,333 key resistance level sees the index trading at all time highs with resistance levels at 6,475 and 6,670. A move below 6,230 sees a possible move towards supports at 6,150, 6,080 and subsequently 6,000.
by Terence Hove, Senior Financial Markets Strategist at Exness
SPX - Are you catching the rotation trends? SPX is still holding very bullish price action. Technicals are pointing towards higher price and todays inside consolidation day certainly helps digest recent gains.
Along with the flat indices market session, we did observe some massive capital rotation trends.
Financials saw a pretty strong down move across the board. JPM / BAC / C all saw large outflows. We were positioned on the short side of financials and took profits on JPM puts.
Even with the big selloff in financials, SPX held up surprisingly well.
Capital simply rotated instead of outright leaving the market. Bullish Signal.
Technology, Energy, Materials, Health care, Transports all saw capital inflow trends.
Rotation into under preforming sectors is a sign that markets could be staging another healthy leg up.
We still have an upside target over 6300 on SPX.

SPX500 Bearish Breakout!
HI,Traders !
#SPX500 was trading along
The rising support line but
Now we are seeing a bearish
Breakout so we are bearish
Biased and we will be expecting
A further bearish move down !
Comment and subscribe to help us grow !

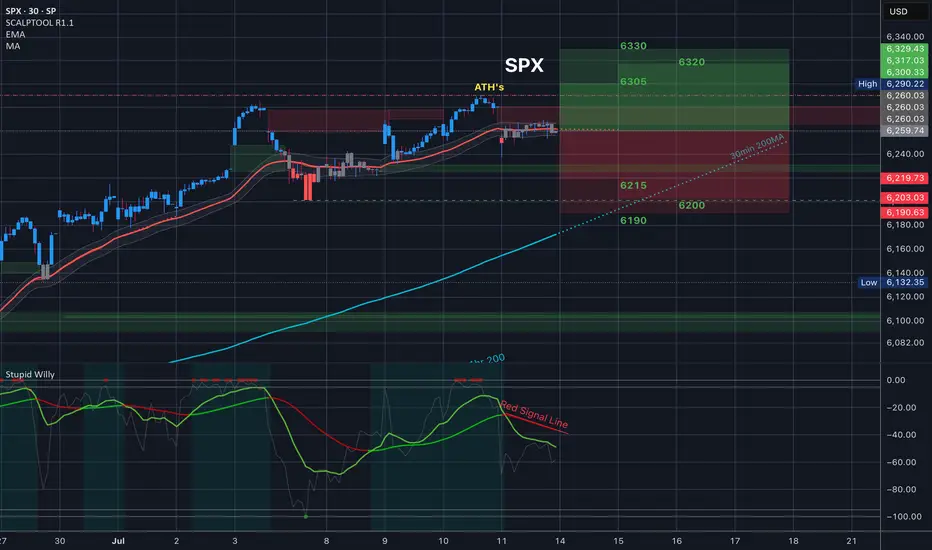
$SPX Tomorrow’s Trading Range and everything in it /// 7.14.25Tomorrow’s Trading range and everything in it. How are you playing it?
S&P500: Once it breaks the 1W MA50, it doesn't look back.S&P500 has turned overbought on its 1D technical outlook (RSI = 75.570, MACD = 96.940, ADX = 23.950) and rightly so as it is extending the rally after crossing above the 1W MA50. The Channel Up since late 2011 shows that when the index crosses above its 1W MA50, it tends to spend a notable time over it (and every contact is a buy opportunity), with the most recent example being the March 2023 - December 2024 period. The shortest such period has been in 2019, which was suddently disrupted by the black Swan event of COVID. We may have gotten out of a similar situation as Trump's tariffs disrupted the uptrend earlier this year with a huge, unexpected correction. There 1W MA200 supported and this brings us to a new 'above the 1W MA50 bullish phase', which even if it is as short as 2019, it can still target 7,000.
See how our prior idea has worked out:
## If you like our free content follow our profile to get more daily ideas. ##
## Comments and likes are greatly appreciated. ##

SPX500 Awaits Breakout as Trade Talks Fuel Market CautionWall Street Edges Up Amid Tariff Talks & Trade Turbulence
U.S. stock index inched higher on Wednesday as markets remain on edge over President Donald Trump's aggressive tariff stance and the ongoing negotiations with global trade partners. Traders are cautiously watching for clarity, with sentiment shifting quickly on any updates.
📉 SPX500 Technical Outlook
The index continues to consolidate within a narrow range between 6223 and 6246. A confirmed breakout from this zone is needed to define the next directional move.
A break below 6223 would confirm bearish continuation toward 6194, with potential extension to 6143.
A break above 6246 would shift the bias bullish, targeting 6282, followed by 6305.
Key Levels:
Support: 6223 / 6195 / 6143
Resistance: 6282 / 6305

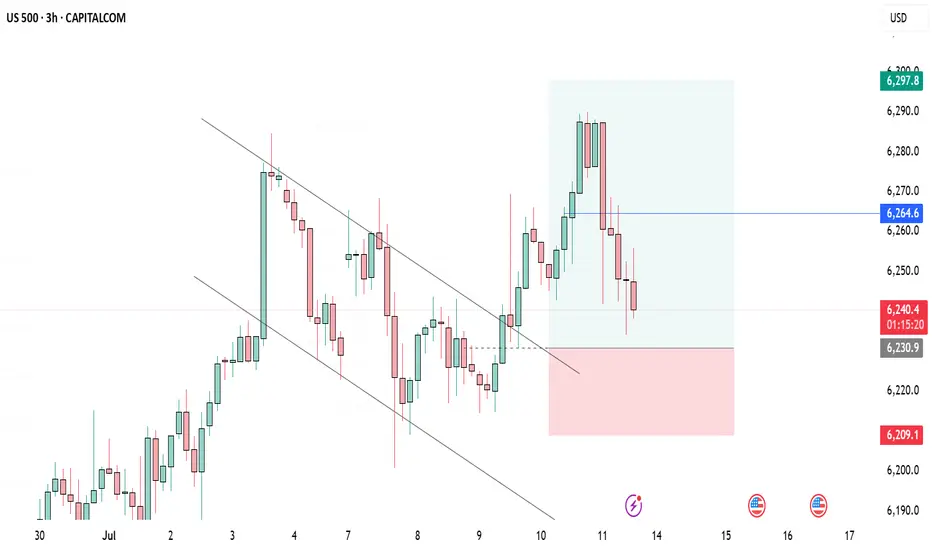
Bearish drop?S&P500 is reacting off the resistance level which is a pullback resistance and could drop from this level too ur take profit.
Entry: 6,237.85
Why we like it:
There is a pullback resistance level.
Stop loss: 6,268.46
Why we like it:
There is a pullback resistance level.
Take profit: 6,187.51
Why we like it:
There is a pullback support that is slightly below the 61.8% Fibonacci retracement.
Enjoying your TradingView experience? Review us!
Please be advised that the information presented on TradingView is provided to Vantage (‘Vantage Global Limited’, ‘we’) by a third-party provider (‘Everest Fortune Group’). Please be reminded that you are solely responsible for the trading decisions on your account. There is a very high degree of risk involved in trading. Any information and/or content is intended entirely for research, educational and informational purposes only and does not constitute investment or consultation advice or investment strategy. The information is not tailored to the investment needs of any specific person and therefore does not involve a consideration of any of the investment objectives, financial situation or needs of any viewer that may receive it. Kindly also note that past performance is not a reliable indicator of future results. Actual results may differ materially from those anticipated in forward-looking or past performance statements. We assume no liability as to the accuracy or completeness of any of the information and/or content provided herein and the Company cannot be held responsible for any omission, mistake nor for any loss or damage including without limitation to any loss of profit which may arise from reliance on any information supplied by Everest Fortune Group.
