$SPY $SPX SELLIt is time. For SPX today I sold SP:SPX 6420/6435 bear call spreads here. First order filled for 7.20, Back up orders at 6430/6445.
USSP500CFD trade ideas


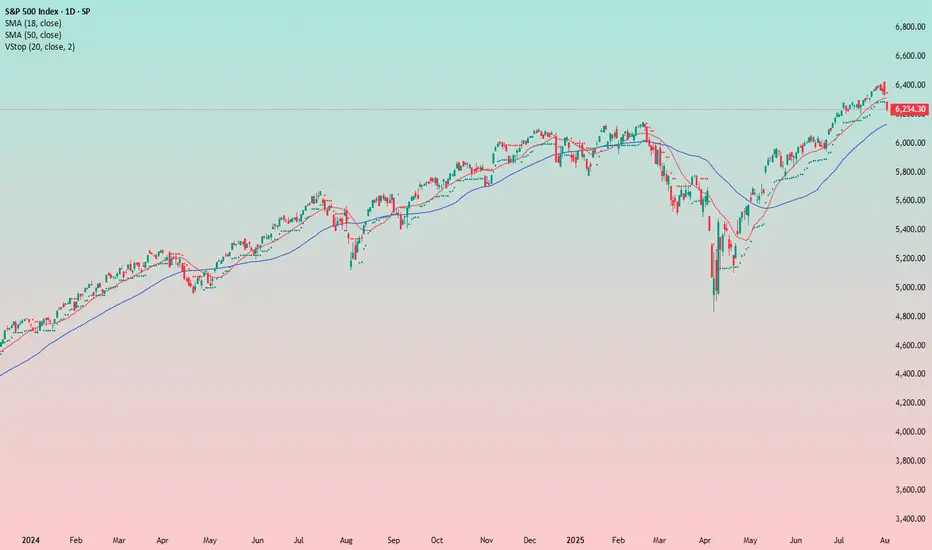
SPX: Investors` defensive positioning? The past week brought a flurry of important US macro data and a high market volatility in line with it. In addition, the FOMC meeting brought up increased nervousness regarding Fed's view on current and future macroeconomic developments. As Fed Chair Powell informed the public, the inflation is perceived to pick-up a bit as a reflection of imposed trade tariffs, but the Fed is not expecting that it will have a significant effect on increasing inflation, but only the one-off effect. Future Fed moves will continue to be data dependent and risk-assessed, in which sense, a direct answer to potential September rate cut was not provided by Fed Chair Powell.
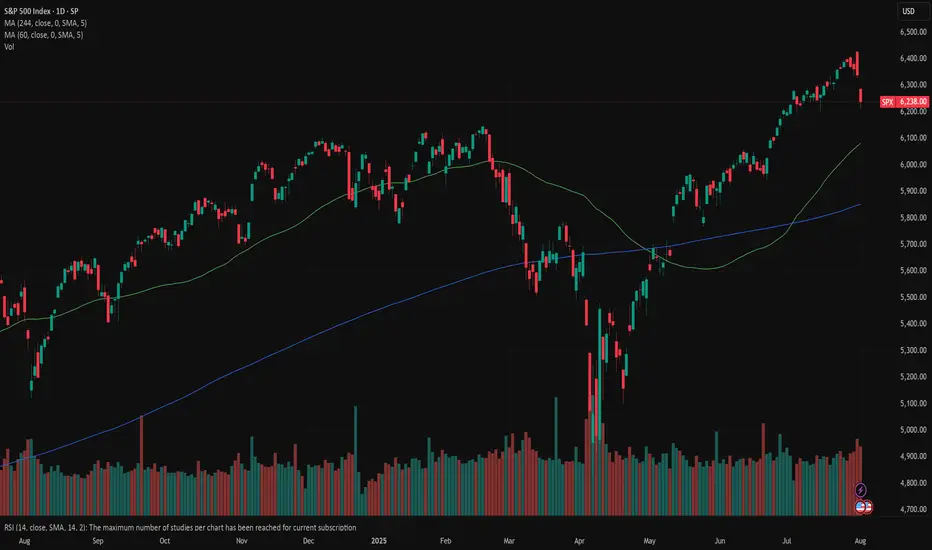
Although Friday brought up some major market corrections in the S&P 500, Thursday's trading session was the one to bring major sentiment and indication over forthcoming correction. Namely, Thursday started in a positive manner, where the index reached a new all time highest level at 6.427, but soon after the market tumbled down, ending the trading day at 6.333. Futures were traded lower on Friday, where the S&P 500 was opened by 1,5% lower, ending the week at 6.238. These movements during the last two trading days are quite important because such strong moves in the value of index could be imposed only by institutional investors, showing their sentiment regarding the macro environment expectations at this moment.
Much of the negative market sentiment was driven by surprisingly weak non-farm payroll data of only 73K in July, which was below market estimate of 110K. At the same time, the unemployment rate modestly picked up in July to 4,2%, from 4,1% posted previously. Some analysts are noting that this could be a summer seasonal effect, however, investors are concerned that this could be a sign of a weakening US economy, due to implemented trade tariffs. During the time of writing this article, CNBC posted a news that the U.S. President Trump ordered immediate release of a duty of a Commissioner of labor statistics, due to continued posts of inaccurate labor data and its frequent revisions, also putting doubts that the July figure of 73K is accurate.
Regardless of actual accuracy of the US jobs data, investors continue to be concerned regarding the effects of implemented trade tariffs on earnings and growth of US companies. As analysts are noting, some of them are trying to lock in gains as earnings risks emerge, but with future uncertainties, a defensive positioning of investors might be wider in the coming period.
Good moment to tighten your stop losses!After market reaction to jobs data, it's a good idea to take a look at the indeces and be prepared for a correction, whatever size it is.

SP500 → Countertrend correction before growthFX:SPX500 is correcting against an upward trend. In the second half of the week, the market received fairly positive fundamentals during the reporting period.
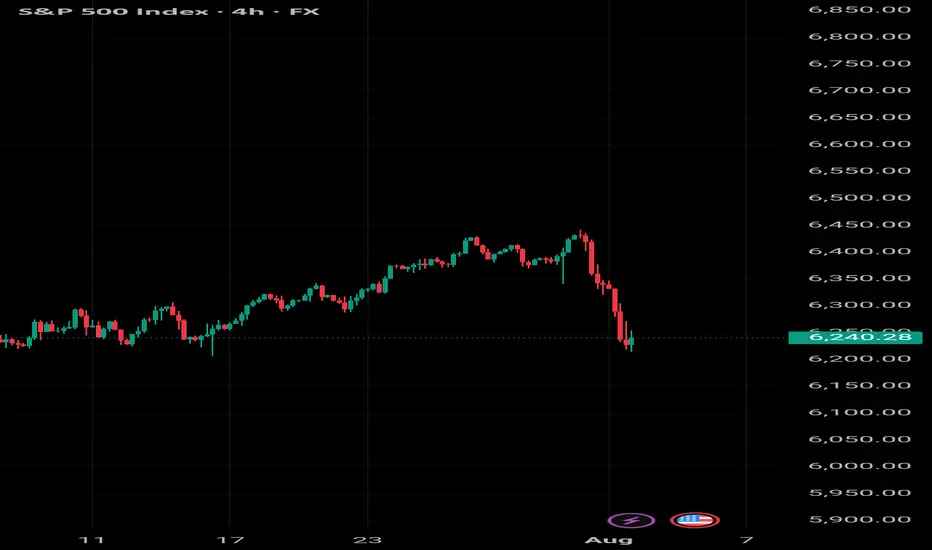
S&P 500 futures found support after strong reports from Meta and Microsoft, which exceeded earnings expectations and forecasts thanks to AI. The rise in futures supported demand for the “Magnificent Seven” despite Powell's hawkish comments. The focus is on Apple and Amazon reports in the evening, which could strengthen the tech rally. On Friday, we are seeing a countertrend correction in which the market is testing the 6288 zone of interest.
Support levels: 6288.4, 6262.6
Resistance levels: 6342, 6371
Most likely, the market will form a false breakout of support during the correction. If the bulls keep the index above the key level, we can expect continued growth in the short and medium term.
Best regards, R. Linda!

S&P's "hugely overbought" towards 6375!1). Position Volume dropping! 2). Big institutions (Banks & Insurance) have backed off on higher Risk positions! 3). Huge resistance at .728 fib & trend! 4). Trump tariff talk is likely adding to a fall as well! 5). We're looking for a "SELL" trade @ 6375, since buying is too risky at the moment...Good Luck!

The Low Is In: Why the S&P 500 Just Confirmed a Bullish Reversal🔥 The Low Is In: Why the S&P 500 Just Confirmed a Major Bullish Reversal 🔥
The market just gave us a gift.
After weeks of drifting lower and sentiment turning cautious, the S&P 500 has touched — and bounced — off a critical rising trendline for the third time since May 2025. That third touch isn't just a technical coincidence… it's often the launchpad for a new impulsive leg higher.
📈 The Power of the 3rd Touch: Trendline Validation Complete
Look at the chart. This isn’t guesswork. Since May, the S&P 500 has been respecting a well-defined ascending trendline, one that connects multiple higher lows during this bull run.
The first touch was the May liftoff after the April consolidation.
The second came in June — a clean retest and bounce.
Now, as of early August, the third touch has held once again, exactly where the bulls needed it most.
This isn’t a random line on a chart. This is institutional flow stepping in to defend structure.
And when a rising trendline holds for a third time after a strong uptrend? That’s a classic continuation signal.
📉 RSI Washout + Structural Support = Perfect Storm for a Bottom
The RSI printed a dramatic dip to ~32, a level that screams “oversold” on the 4-hour timeframe. But notice the context — it happened right at structural support.
This is not weakness. This is accumulation.
Big players shake out weak hands on low timeframes… right before they send it.
🧠 Sentiment Is Offside… Again
Let’s not forget: this retrace came after a huge run-up since March. People expected a deeper correction. Bears started getting loud again.
That’s how bull markets trap you — by convincing you it’s over right before the next leg higher.
And with macro tailwinds (liquidity expansion, fiscal spend, tariff rollbacks), earnings season beats, and global capital rotation into U.S. equities, this setup is ripe for a violent upside squeeze.
🚀 8,700 in Sight: My End-of-Year Price Target Is Very Much in Play
Today’s close around 6,220 means the S&P 500 would need to rally ~40% to hit my target of 8,700 by year-end.
Sounds crazy? Not if you’ve seen what happens during parabolic melt-ups.
This isn’t just hope:
📊 Strong breadth under the surface
🏛️ Dovish policy pivot now expected in Q4
💸 Retail and institutional capital both re-engaging
📉 Bond yields are starting to roll over, supporting equity valuations
When bull markets enter their euphoria phase, they don’t stop at “reasonable” targets. They blast through them.
💡 The Setup Is Textbook — Now It’s About Execution
✅ Trendline defended
✅ RSI reset
✅ Sentiment shaken out
✅ Structure intact
The technicals just aligned with the macro. The low is in — and the runway to 8,700 is wide open.
Strap in. Q4 could be one for the history books.

US500 SP500 Sell the news- ShortHello fellow traders, what do you think? Am I predicting FUTURE? This is my early entry, cautious, but holding steady, checking from time to time but general rule- what went up will eventually fall. The price is just a Wave of coincidance and events, trade carefully! Protect capital! don't copy my idea it's an idea NOT A TRADING ADVISE

What the Next CPI Print Could Do to the S&P500What the Next CPI Print Could Do to the S&P500
A technical and macro setup ahead of the inflation release
Next week’s CPI report could be one of the most important data points of the quarter, not just for the Fed, but for traders watching the S&P500 (SPX) at these elevated levels.
We’ve seen inflation data act like a volatility trigger in recent months, especially when it diverges from market expectations. And with the S&P flirting with key resistance, the stage is set for either a breakout or a reversal.
Let’s break down both the macro implications and the technical chart setup heading into the release.
Why CPI Matters?
If headline CPI comes in hot, markets may price in fewer Fed cuts this year. Yields spike and SPX often reacts with a sharp pullback.
If inflation cools faster than expected, the Fed may stay dovish. That typically gives SPX and risk assets broadly room to breathe higher.
Current expectations:
- Headline CPI: 3.2 percent
- Core CPI: 3.4 percent
Anything above those numbers is risk-off. Anything below supports the soft landing narrative.
Technical Setup on SPX
On the 4H and daily chart, here’s what we’re seeing:
- Price hovering around a key resistance zone between 5,660 and 5,680
- Rising wedge structure starting to form, typically a bearish sign near market tops
- Bearish RSI divergence on 1D chart
- Volume has been declining on recent pushes higher, showing lack of conviction
Key Levels
- Support: 5,615 and 5,575
- Breakout Target (if CPI is dovish): 5,750 to 5,770
- Downside Target (if CPI surprises hot): 5,500 to 5,480
Watch for a volatility spike on the release and be cautious about chasing the first move.
My Play
I’m personally staying flat heading into the data.
Too much chop, not enough conviction. But I’ll be watching for:
- A false breakout trap above 5,680 followed by reversal as a possible short setup
- Or a clear retest and hold above 5,700 with volume, which may confirm further upside
CPI has become the new FOMC. Be patient and reactive, not predictive.
Final Thought
CPI prints used to be background noise. Not anymore.
This one matters, and SPX is sitting in a technical pressure cooker.
Whatever side you lean toward, come in with a plan and don’t trade the first candle.
SPX500 Will Go UP!
HI,Traders !
#SPX500 made a retest
Of the horizontal support
Level of 6277.78 and we
Are already seeing a
Bullish rebound so we are
Locally bullish biased and
We will be expecting a
Further bullish move up !
Comment and subscribe to help us grow !

S&P500 corrective pullback key support at 6200Key Support and Resistance Levels
Resistance Level 1: 6316
Resistance Level 2: 6374
Resistance Level 3: 6430
Support Level 1: 6200
Support Level 2: 6112
Support Level 3: 6073
This communication is for informational purposes only and should not be viewed as any form of recommendation as to a particular course of action or as investment advice. It is not intended as an offer or solicitation for the purchase or sale of any financial instrument or as an official confirmation of any transaction. Opinions, estimates and assumptions expressed herein are made as of the date of this communication and are subject to change without notice. This communication has been prepared based upon information, including market prices, data and other information, believed to be reliable; however, Trade Nation does not warrant its completeness or accuracy. All market prices and market data contained in or attached to this communication are indicative and subject to change without notice.

US500 (S&P): Trend in daily time frameThe color levels are very accurate levels of support and resistance in different time frames, and we have to wait for their reaction in these areas.
So, Please pay special attention to the very accurate trends, colored levels,
and you must know that SETUP is very sensitive.
Be careful
BEST
MT

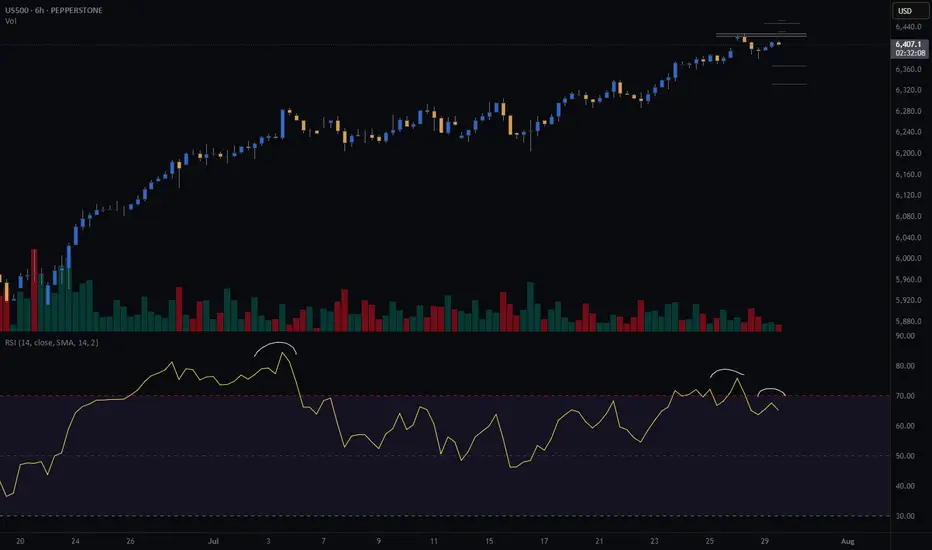
SPX500 Hits New Highs but Fed Caution Limits MomentumSPX500 Overview
Market Context:
The Fed's reluctance to commit to a rate cut in the upcoming September meeting has forced markets to reassess their outlook. This hesitation pushed Treasury yields and the US dollar higher in late trading, weighing on equities.
As it stands, the probability of a rate cut appears to be pushed further out on the timeline, introducing short-term headwinds for risk assets.
Technical Outlook:
SPX500 printed a new all-time high and maintains bullish momentum after stabilizing above the previous ATH at 6427. As long as the price holds above this level, the bullish continuation toward 6454 remains likely, with a further extension to 6480 possible.
A bearish correction would only be confirmed by a break below 6415.
Resistance Levels: 6454, 6480
Support Levels: 6415, 6389

SPX500 - Bearish Crab Pattern- Price completed a perfect Crab Pattern, yet we all got to August 1st (second) liberation day
- If bad mood continues, we can expect a correction:
A. (positive) down to 6150-6000
B. (negative) down to 5800
Just my humble opinion

$SPX Analysis, Key Levels & TargetsThis is how last night’s members chart played out and it was amazing. We opened at the top of the implied move and all of the spreads at the top paid as we dropped back to the 30in 200MA
The spreads I took at 6420/6435 but every spread shown here would have done well.

S&P 500 ETF & Index Hit Resistance – A Technical Warning Shot 📉⚠️ S&P 500 ETF & Index Hit Resistance – A Technical Warning Shot 🔍🧠
Following up on the video I just posted , I had to share this updated chart of the VOO ETF (Vanguard S&P 500) and US500 Index , now that both are testing key resistance levels.
On the left: AMEX:VOO has reached the very top of a multi-year ascending channel—a zone that has historically triggered sharp corrections. The level at 590.85 marks a major resistance zone.
On the right: The US500 Index is showing a similar technical overextension, trading just under 6,450, with 5,928.25 as the nearest support below.
🎯 Technicals at play:
VOO could retrace toward 526.17 and potentially 465.72, both of which are solid technical supports within this channel.
This setup doesn't mean panic—but it does argue for caution, especially after such an extended run.
🧠 And yes, the Buffett Indicator (Stocks-to-GDP) continues to point toward an overheated market . While it's not a timing tool, it adds macro weight to the technical signals.
In the video, I also touched on:
Taking profits on NASDAQ:NVDA after a near-perfect technical rejection at target.
Reviewing Rolls Royce nearing upper channel resistance.
Gold and Silver at inflection points—likely to be impacted if equities begin to unwind.
Rotational potential into Bitcoin and Ethereum, which may benefit from macro shifts.
This is how I trade: respect structure, stay proactive, and prepare before the move—not after. Let me know how you’re positioning or if you’re sitting on hands waiting for a dip.
One Love,
The FX PROFESSOR 💙
Disclosure: I am happy to be part of the Trade Nation's Influencer program and receive a monthly fee for using their TradingView charts in my analysis. Awesome broker, where the trader really comes first! 🌟🤝📈

SPX defying gravity!It's a BULL market until it's not! Some how some way the markets will set new ATHs? I don't know how or why every macro economic indicator is yelling recession or worse but the chart tells me a different story. Bulls ball.....

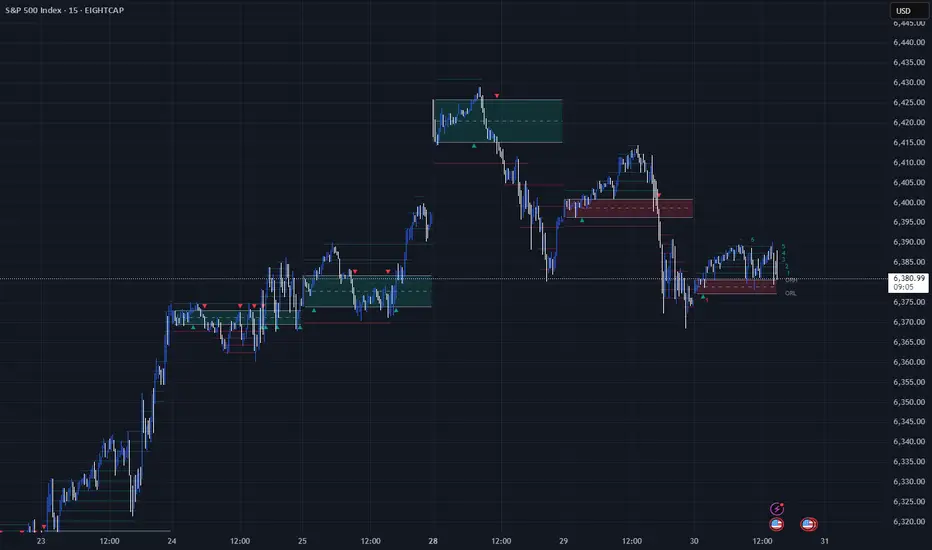
Unlocking the Power of ORB (Opening Range Breakout)Unlocking the Power of ORB (Opening Range Breakout): A Proven Strategy for Intraday Traders
In the fast-paced world of intraday trading, simplicity and structure can often outperform complexity. One such time-tested strategy is the Opening Range Breakout (ORB) — a method favored by both discretionary and system traders for its clarity and adaptability.
📌 What is ORB (Opening Range Breakout)?
ORB refers to the price range (high and low) formed during the first few minutes (typically 5, 15, or 30) after the market opens. Traders look for a breakout above or below this range, anticipating strong momentum in that direction.
🧠 Why ORB Works
Volume Surge: The opening minutes see high institutional activity, creating genuine demand/supply signals.
Market Psychology: ORB captures trader sentiment as news digests overnight and is priced in at the open.
Defined Risk: The high/low of the range becomes a natural stop-loss area, allowing clean setups.
✅ Entry and Exit Rules for the ORB Strategy
Having a consistent framework helps you avoid emotional decisions. Here’s how you can structure your trades using ORB:
🔹 Entry Criteria:
Timeframe: Define your ORB window — e.g., first 15-minute candle.
Bullish Breakout Entry:
Enter long when price closes above the ORB high with volume confirmation.
Bearish Breakdown Entry:
Enter short when price closes below the ORB low with volume confirmation.
⚠️ Avoid entering on the first breakout candle. Wait for a close and retest, or a strong momentum candle for higher confidence.
🔹 Stop-Loss Placement:
For Long Trades: Place SL just below ORB low
For Short Trades: Place SL just above ORB high
🔹 Target/Exit Options:
Fixed RR Target: Aim for 1.5–2x your risk as initial target.
Mid/Outer Bands: Use indicator-drawn breakout bands (like those in LuxAlgo script) as profit zones.
Time-based Exit: Close position by end of session if price stalls or consolidates.
Trailing Exit: Trail your stop behind higher lows (long) or lower highs (short) after breakout.
📊 ORB in Action
You can explore this ready-to-use TradingView indicator to visualize ORB levels in real-time:
🔍 Indicator: Opening Range with Breakouts & Targets (by @LuxAlgo) Thanks to @LuxAlgo team to make this indicator available.
🛠️ Highlights:
Automatically marks the opening range
Plots breakout zones and targets
Ideal for intraday strategies
Works across indices, forex, and crypto
📓 Integrating ORB into Your Trading Journal App
If you're journaling ORB trades, consider logging:
✅ Symbol & timeframe
✅ ORB range (high/low)
✅ Breakout direction (long/short)
✅ Entry time & price
✅ Exit reason (target hit, SL hit, time-based exit)
✅ Notes: market sentiment, news drivers, volume confirmation
Over time, this data will help you:
🔍 Identify which assets respect ORB best
📈 Tune your RR ratio and stop placements
🧠 Reduce decision fatigue by automating setups
🧪 Want to Automate It?
Our trading journal app is ready with 🧠 AI-based journaling for feedback and refinement
🎯 Final Thoughts
ORB is a classic — not because it’s flashy, but because it offers structure, risk control, and repeatability. Whether you're a price action purist or using smart indicators, ORB can provide a disciplined edge — especially when integrated into a journaling and feedback loop.
📌 Start small. Track results. Tune your edge.
S&P500 (CASH500) SHORT - Double top H6Risk/reward = 3.7
Entry price = 6432.6
Stop loss price = 6 454.1
Take profit level 1 (50%) = 6367.7
Take profit level 2 (50%) = 6332.6
Still need confirmation from some variables before entering the trade
Is This the Start of a Market Drop?So, is the drop beginning? It kind of looks that way, but there’s still no solid setup for entering a short position — and there hasn’t been so far.
The trend is still upward for now, and this current pullback might just be temporary.
What I like about the short idea is that August is traditionally a weak month for stocks .
Could this be the start of a big correction on the market? Yes, it’s possible.
It’s just a pity there’s no clean setup for a short. I’d like to enter, but I’d prefer to see a bit more confirmation on the chart itself.
In general, trading the index off of chart setups isn’t easy — perfect entries are rare. That’s exactly the case now. I’m watching and wondering how and when to catch the downside. Maybe I’ll end up sitting through the entire drop without a position :)
Overall, I’m in favor of the short — but for now, I just don’t see a clear entry point.
Price breakout below Keltner bandThe price has shown a breakout after the squeeze below the keltner band and may signal a more bullish trend.

Cup and handleTarget 1 is 5800, calculated from taking the height of the cup and handle structure divided by 2, added to the top of the handle inflection point.

SPX to 6600+ by Aug 5This leg up in SPX is not over yet. Target at upper bound of the channel around 6.6K+ by Aug 5.
