SPX to 6600+ by Aug 5This leg up in SPX is not over yet. Target at upper bound of the channel around 6.6K+ by Aug 5.
USSP500CFD trade ideas

S&P500 for the rest of 2026I am not a professional and this is based on nothing more than blind speculation and feelings.
Probably wrong

SPY and its games -FOMC buy level needs to be taken out After 3 days of back and forth, the trend line is the deciding factor for me on the bearish bias.
Once the FOMC buy level is taken with at least 4hr closure, sellers are in control.

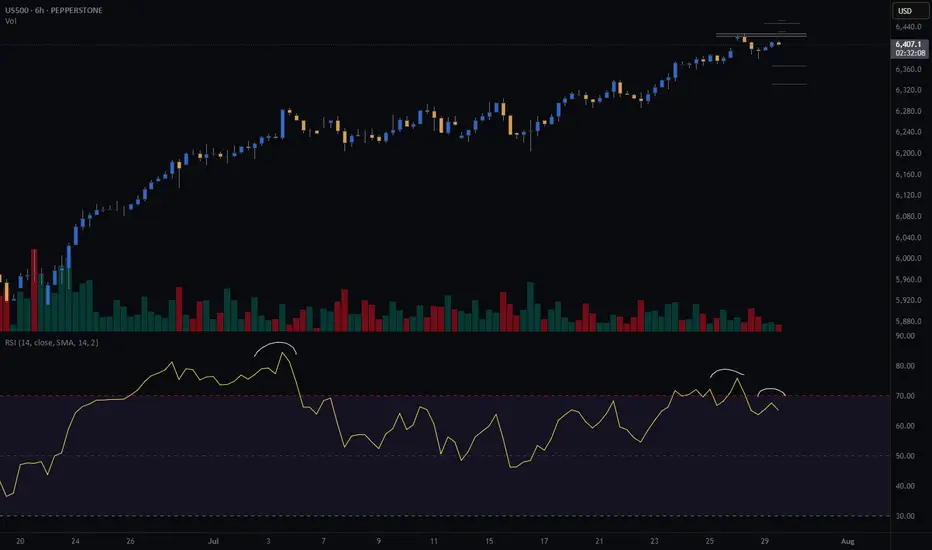
Nasdaq and S&P 500 higher than ever. Crash incoming??The stock market is now more expensive than ever.
Some people are calling the top, saying that the market is overbought and too high.
There are indicators that show that the market is overheated, but NO ONE KNOWS whether it's going to crash next week or continue running up for months.
Since April, Nasdaq has gained 40%, which is a lot. Congrats if you bought some QLD and TQQQ back in April when I posted about it.
SP:SPX : All-time high. NASDAQ:NDX : All-time high. BITSTAMP:BTCUSD : All-time high. TVC:GOLD : All-time high HOME PRICES ( ECONOMICS:USSFHP ): All-time high. Sounds a bit like a bubble.
The S&P 500’s market cap now equals 28x real disposable personal income — a record.
The stock market Shiller PE ratio is at its highest in 20 years.
Nasdaq companies, especially the MAG7, are strongly outperforming small-cap companies. The last time this happened at this speed, we had the dot-com crash.
The top 10 stocks in the S&P 500 account for 40% of the index.
So, saying this, is the market going to crash?
I don't know, but I know that it's more likely to crash now than it was 3 months ago. It might continue running higher, too, as the FED is expected to cut rates. Really, no one knows. 😊
Here's what I'm doing:
I trimmed down some overpriced stocks from my portfolio: Lemonade, Coupang, Shopify, and Crowdstrike
I trimmed down some of my crypto, especially Bitcoin and Ethereum
I stopped DCA'ing into leveraged ETFs
I'm accumulating cash
I'm still investing (added more healthcare stocks to the portfolio)
Quick note: I'm just sharing my journey - not financial advice! 😊

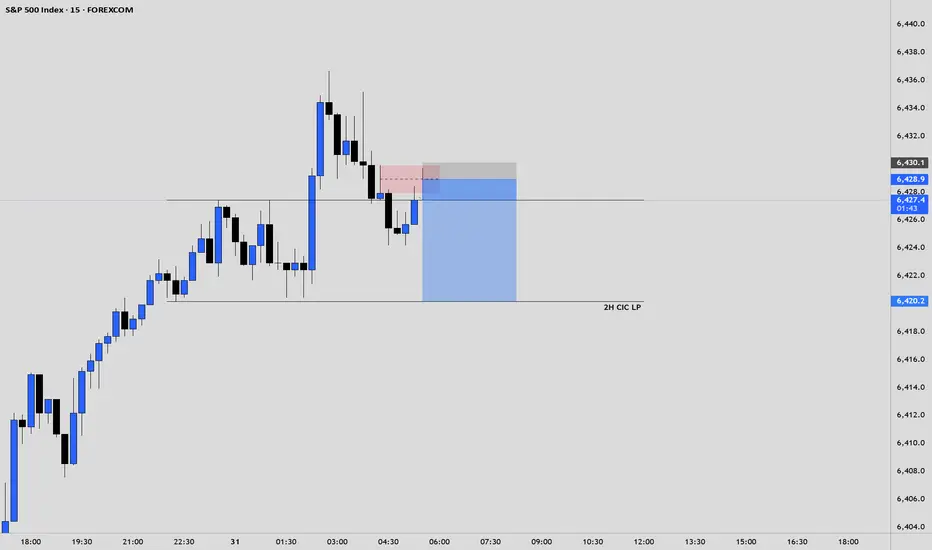
SPX ShortElite Analysis
Trade took previous high.
Market gave me a 30m BOS
Identified internal LP
Received confirmation on the 10m and 1m.
Executed off the 1m.
Targets lower LP's
S&P500 (CASH500) SHORT - Double top H6Risk/reward = 3.7
Entry price = 6432.6
Stop loss price = 6 454.1
Take profit level 1 (50%) = 6367.7
Take profit level 2 (50%) = 6332.6
Still need confirmation from some variables before entering the trade
SPY back in the trendlineFrom a technical stand point, the expectation was that the trend line will be respected and sellers will force price to close back inside.
Today's daily close can ignite further downward movement which can align with August seasonality that typically sees Indices pull back within this period.
Target still remains 6108 at previous ATH

29-07-2025This chart contains my analysis and key observations for today's trading session. All drawings and indicators reflect my current view of the market as of today. The purpose of this publication is to keep a record of my analysis and review it later for learning and improvement. No investment advice is provided.

SPX500 Awaits Fed – Key Support at 6388 in FocusSPX500 Awaits Fed Decision – Breakdown Below 6365 Could Deepen Correction
Following the registration of a new all-time high at the beginning of the week, the price has started to decline. Also, investors await the Federal Reserve's policy statement later today for guidance on the future path of monetary policy.
The price is currently positioned below the 6388 level, which is a key zone in conjunction with the support line at 6365. This area signals the potential for a new downward correction if the price stabilizes below 6365.
A sustained move below 6365, confirmed by a 1H or 4H candle close, would open the door to a sharper decline toward 6341, followed by 6319, both considered critical support zones.
As for the bullish scenario: if the price finds support and manages to rebound today, the first step toward recovery would be a breakout above 6388, which may lead to a climb toward 6415. Breaking above 6415 would pave the way to retest the resistance zone at 6427, with the potential to reach a new all-time high at 6454.
Key Levels
• Support: 6365 - 6341 - 6319.
• Resistance: 6388 - 6415 - 6427.

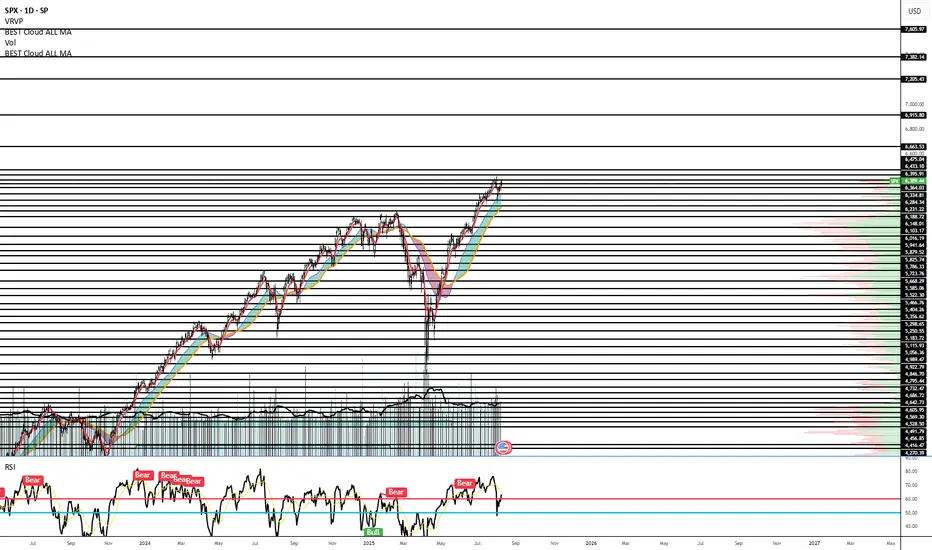
S&P 500 as expensive as at the end of 2021 in valuation terms !Two weeks ago, I shared a technical analysis of the S&P 500 across all timeframes. This analysis outlines price targets for the end of 2025 based on technical and fundamental criteria. You can revisit this analysis by clicking the first chart below.
WARNING: A major bullish target I previously mentioned is close to being reached—6,475 points on the S&P 500 futures contract. The market may soon enter a consolidation phase.
Given this week's packed fundamentals, it's wise to start locking in your gains by moving up your stop-loss levels—especially as the S&P 500 has now returned to its end-2021 valuation peak.
Click on the table below to access details on this week's significant fundamental developments:
1. Caution: The S&P 500 has reached its end-2021 valuation record!
While technical market analysis is important, valuation metrics are even more so. The S&P 500 has just reached its previous valuation peak from the end of 2021—historically the starting point of the 2022 bear market. While the current macro context is different, this level could trigger a short-term market pause.
Chart showing S&P 500 valuation via the CAPE Ratio (Shiller PE):
2. S&P 500 seasonality is weaker in August and bearish in September
Another cautionary factor is seasonality. A statistical look at average S&P 500 performance by month highlights a weaker period in August and a typically negative one in September.
In summary, technical, fundamental, and seasonal analysis all point to securing gains as we approach August/September—without questioning the underlying long-term uptrend.
Chart showing S&P 500 seasonality since 1960:
DISCLAIMER:
This content is intended for individuals who are familiar with financial markets and instruments and is for information purposes only. The presented idea (including market commentary, market data and observations) is not a work product of any research department of Swissquote or its affiliates. This material is intended to highlight market action and does not constitute investment, legal or tax advice. If you are a retail investor or lack experience in trading complex financial products, it is advisable to seek professional advice from licensed advisor before making any financial decisions.
This content is not intended to manipulate the market or encourage any specific financial behavior.
Swissquote makes no representation or warranty as to the quality, completeness, accuracy, comprehensiveness or non-infringement of such content. The views expressed are those of the consultant and are provided for educational purposes only. Any information provided relating to a product or market should not be construed as recommending an investment strategy or transaction. Past performance is not a guarantee of future results.
Swissquote and its employees and representatives shall in no event be held liable for any damages or losses arising directly or indirectly from decisions made on the basis of this content.
The use of any third-party brands or trademarks is for information only and does not imply endorsement by Swissquote, or that the trademark owner has authorised Swissquote to promote its products or services.
Swissquote is the marketing brand for the activities of Swissquote Bank Ltd (Switzerland) regulated by FINMA, Swissquote Capital Markets Limited regulated by CySEC (Cyprus), Swissquote Bank Europe SA (Luxembourg) regulated by the CSSF, Swissquote Ltd (UK) regulated by the FCA, Swissquote Financial Services (Malta) Ltd regulated by the Malta Financial Services Authority, Swissquote MEA Ltd. (UAE) regulated by the Dubai Financial Services Authority, Swissquote Pte Ltd (Singapore) regulated by the Monetary Authority of Singapore, Swissquote Asia Limited (Hong Kong) licensed by the Hong Kong Securities and Futures Commission (SFC) and Swissquote South Africa (Pty) Ltd supervised by the FSCA.
Products and services of Swissquote are only intended for those permitted to receive them under local law.
All investments carry a degree of risk. The risk of loss in trading or holding financial instruments can be substantial. The value of financial instruments, including but not limited to stocks, bonds, cryptocurrencies, and other assets, can fluctuate both upwards and downwards. There is a significant risk of financial loss when buying, selling, holding, staking, or investing in these instruments. SQBE makes no recommendations regarding any specific investment, transaction, or the use of any particular investment strategy.
CFDs are complex instruments and come with a high risk of losing money rapidly due to leverage. The vast majority of retail client accounts suffer capital losses when trading in CFDs. You should consider whether you understand how CFDs work and whether you can afford to take the high risk of losing your money.
Digital Assets are unregulated in most countries and consumer protection rules may not apply. As highly volatile speculative investments, Digital Assets are not suitable for investors without a high-risk tolerance. Make sure you understand each Digital Asset before you trade.
Cryptocurrencies are not considered legal tender in some jurisdictions and are subject to regulatory uncertainties.
The use of Internet-based systems can involve high risks, including, but not limited to, fraud, cyber-attacks, network and communication failures, as well as identity theft and phishing attacks related to crypto-assets.

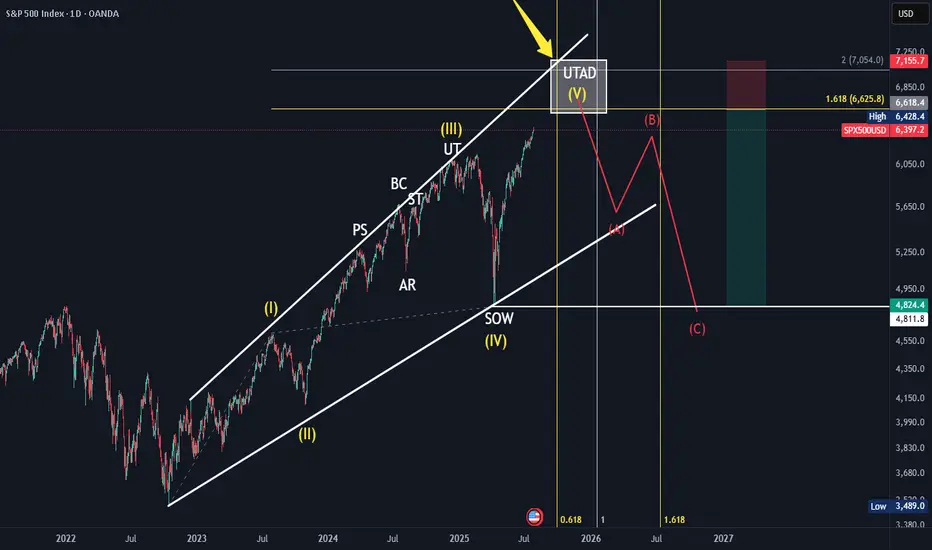
SPX Elliot Wave Count, Wykoff DistributionBased off the HTF elliot wave count aligning and in confluence with a HTF Wykoff distribution. With the top coming in between 6600-7000ish around September 2025 till January 2026. Further confluence with trendline, fibonnacci time and fibonnaci trend and extension.
SPX preparing to sweep liquidity around the 6200 level.Based on my analysis, the #SPX has printed a reversal engulfing candle, which could lead to a period of consolidation. The most probable target appears to be the liquidity pool around the 6200 level.
However, this outlook becomes invalid if the daily candle closes above 6410—the current (today) session high.
As always, conduct your due diligence. Technical analysis offers a probabilistic perspective, not certainty.

SPX500 Correction Before Rally? Key Levels in FocusSPX500 Correction Before Rally? Key Levels in FocusSPX500 OVERVIEW
Fundamental Context:
The U.S. and EU have averted a tariff standoff. The agreement reduces the baseline tariff on most European imports to 15%, down from the previously threatened 30% by the Trump administration. In return, the EU has committed to investing approximately $600 billion in the U.S.
Additionally, U.S.–China trade talks are ongoing in Stockholm, with reports suggesting a possible 90-day extension to the tariff deadline.
Technical Outlook:
SPX500 maintains a bullish bias due to easing trade tensions. However, as long as the price trades below 6421, a short-term correction toward 6397 and 6388 is likely. A rebound is expected if the price stabilizes above 6388.
🔺 Bullish Continuation will be confirmed if a 1H candle closes above 6427, potentially targeting 6454 and 6470.
Key Levels
• Support: 6397 – 6388 – 6365
• Resistance: 6454 – 6470
SPX500USD | Bulls Lose Steam at 6,424.5 ResistanceThe S&P 500 Index showed strong bullish momentum but is now pulling back after tagging resistance at 6,424.5. Price is currently hovering near 6,374.6, where previous structure may act as support.
Support at: 6,374.6 / 6,340.0 🔽
Resistance at: 6,424.5 🔼
🔎 Bias:
🔼 Bullish: Bounce from 6,374.6 and reclaim of 6,424.5 signals continuation.
🔽 Bearish: Break below 6,374.6 exposes 6,340.0 and lower zones.
📛 Disclaimer: This is not financial advice. Trade at your own risk.

SPX500 Swing Short!
HI,Traders !
#SPX500 keeps growing
And is locally overbought
So after the price hit a very
Strong resistance level
Around 6422.93 we will be
Expecting a pullback and
A local bearish correction !
Comment and subscribe to help us grow !

USD cpi yr/yr forecast of 2.8 looks too high for tomorrowBased upon the price of oil, the recent trend of CPI readings, and the 10 yr avg of 2.68 USD cpi reading may come in as a market miss tomorrow. The expected 2.8 looks to high relative to the trend of readings and the price of oil. It might be fair to expect a range of 2.4 to 2.7.

Trend weakness or consolidation?This index is in an uptrend both in the larger cycle and in the smaller cycle, but in the lower cycle, a trend weakness is observed. If the price can confirm above 6.405, it can continue its upward trend.

SPX500
Based on the provided 4-hour chart of the S&P 500 Index (SPX500), here is a brief summary and outlook.
The SPX500 has been in a clear uptrend, as indicated by the trend channel and a series of higher highs and higher lows. The price is currently facing resistance near the 6,450 level, where a recent high was made before a pullback. The chart also highlights several key support zones, with the most immediate one being around the 6,290 level.
The chart illustrates a potential scenario where the price consolidates or pulls back from the current resistance. The orange arrow depicts a possible movement where the price could retrace towards the immediate support level around 6,290 before finding buyers. From this support, the expectation is for the uptrend to resume, with the price aiming to break through the resistance at 6,450. A successful breakout would open the path towards the upper boundary of the trend channel, with a target set around 6,600.
The key expectation is a continuation of the overall bullish trend after a potential short-term dip. Traders should look for the price to hold above the support at 6,290 for a long entry opportunity. A break below this support would be a bearish signal, but as long as the price stays within the trend channel, the overall bias remains bullish. The final target for this move is projected to be around the 6,600 level, which aligns with the trend channel's upper boundary.

SPX500 TECHNICAL ANALYSISSPX500 has broken above the recent range, reclaiming the 6,351.41 resistance. Price is now pushing into the 6,380.00 zone, with buyers showing control after a strong recovery from the 6,222.46 low.
Support at: 6,351.41 🔽 | 6,324.08 | 6,296.93
Resistance at: 6,380.00 🔼 | 6,409.21 | 6,438.44
🔎 Bias:
🔼 Bullish: Sustained trading above 6,351.41 opens the door toward 6,409.21 and higher.
🔽 Bearish: A close back below 6,351.41 may trigger a retest of 6,324.08 and 6,296.93.
📛 Disclaimer: This is not financial advice. Trade at your own risk.

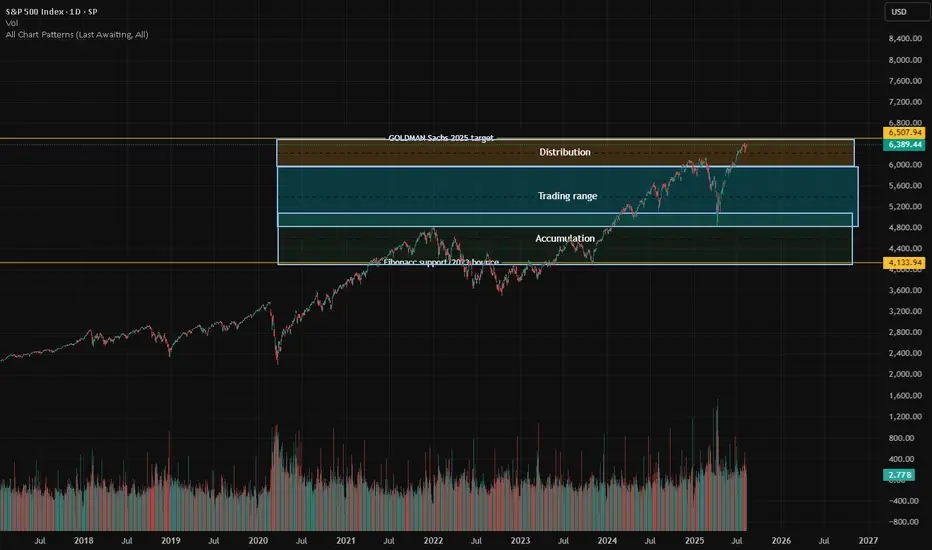
S&P Fibonacci based Accumulation/Distribution rangesFibonacci-Based Zones: The chart is structured around support and resistance zones derived from Fibonacci analysis, providing natural levels for market reaction.
Accumulation Zone: Lower price area (~4,133.94 and above) where buyers show interest and trend reversal is often seeded.
Trading Range: The broad mid-section where price is expected to oscillate, indicating indecision or equilibrium among buyers and sellers.
Distribution Zone: Upper price band near the Goldman Sachs 2025 target, as marked, where profit-taking and seller interest increases.
Potential for Parabolic Move: If price decisively breaks out above the distribution/resistance zone, it could trigger rapid, euphoric buying—a classic market melt-up.
Risk of Downside: Falling below the key Fibonacci support level could prompt a sharp correction,.
Historical Validation: Past price movements respect these zones.
Bulls and Bears zone for 08-08-2025ETH session has rallied to 61.8 Fibonacci level of yesterday's RTH session. Any test of ETH session High could provide direction for the day.
Level to watch: 6384 --- 6386
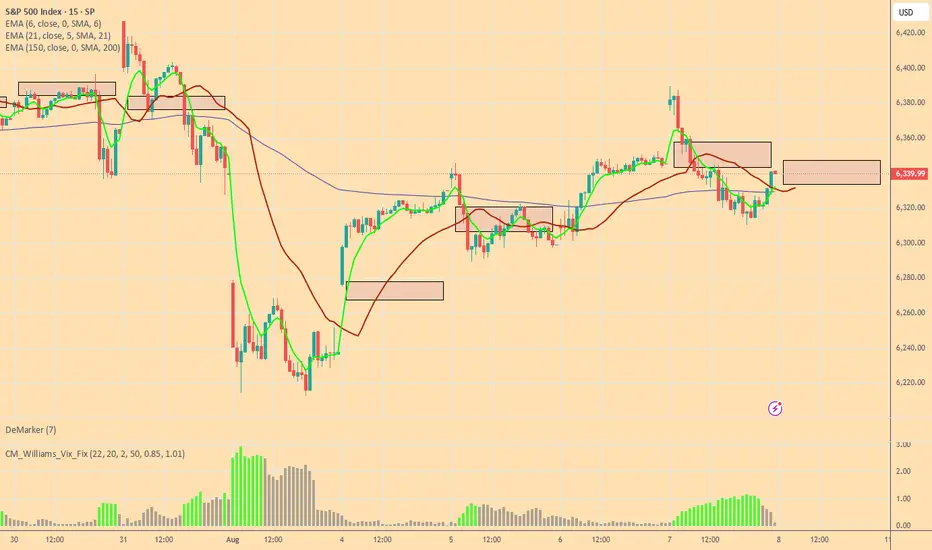
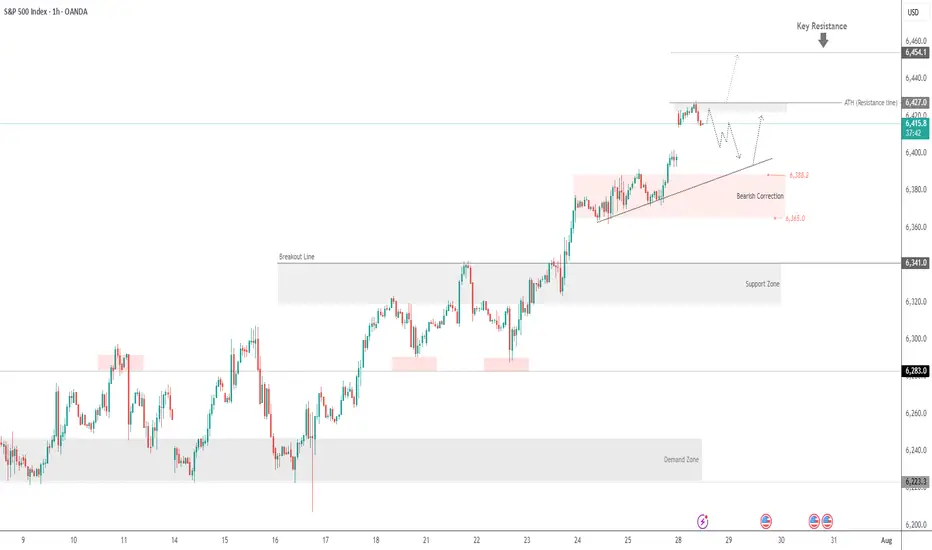
This V-Pattern on SPX500 Is Stupid CleanHey, it’s Skeptic.
In this video, I’m breaking down a clean V-pattern setup on SPX500 — right in line with what I taught in yesterday’s educational post.
We’re starting from the Daily time frame and walking through the logic behind my long trigger, why the previous fakeout was actually useful, and how to set your stop-loss depending on your trading style (H4 vs 15min).
This isn’t just chart talk — it’s about reading the story behind the candles.
If it helped you see things clearer, give it a boost and drop your thoughts below.
Let’s keep learning — one trap at a time.
Until next time, peace out.
📌 Disclaimer: This video is for educational purposes only and does not constitute financial advice. Always do your own research and manage your risk.
