BTCUSDT daily analysisia have shared one hour timeframe analysis and this is daily timeframe and i am following priceaction candle and volume with SMC and more my own personal and private strategies
USTBTC trade ideas

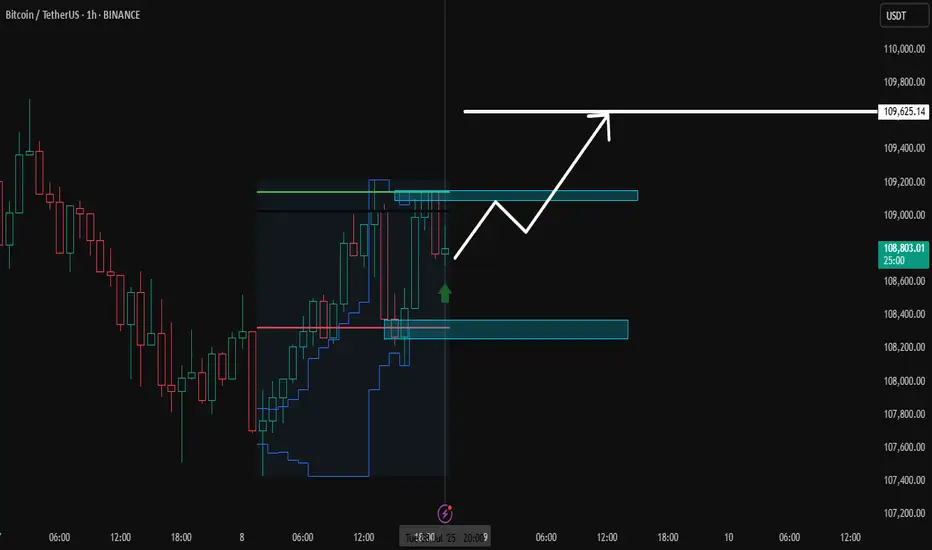
bitcoin in 1hour timeframeIn line with the previous analysis, the likely path for Bitcoin on the one-hour timeframe looks like this...follow for more...
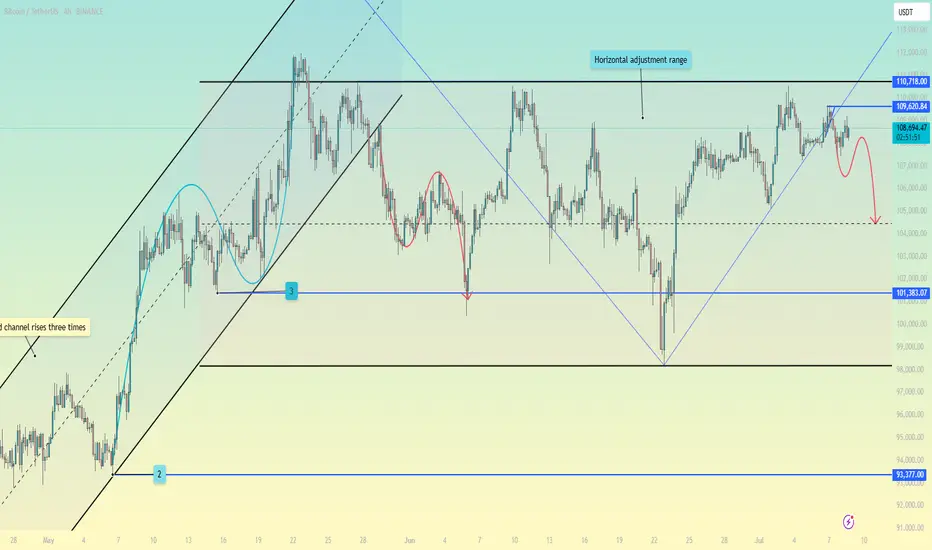
BTC accumulates momentum again in the range
Macroeconomic and policy impact
Trump tariff policy: The United States announced that it would impose 25%-40% tariffs on Japan, South Korea and other countries (effective on August 1), triggering market risk aversion, and Bitcoin once fell to the support level of $107,5004.
Federal Reserve policy: The market is concerned about the possibility of a rate cut in July. If the Fed turns dovish, it may boost the price of Bitcoin by 17.
Musk and Trump conflict: The public dispute between the two sides over the "Big and Beautiful Act" caused short-term fluctuations in the crypto market, with DOGE leading the decline and BTC once under pressure by 2.
Bitcoin is currently in the key liquidity-intensive area of 105,000-108,800 US dollars, and the long and short sides are fiercely competing here:
Above $108,800: A large number of short stop-loss orders are gathered, and a breakthrough may trigger a chain of short liquidations, pushing the price towards $113,000-130,000.
Below $107,100: There are dense long leveraged positions. A break below this level may trigger forced liquidation of long positions, causing the price to fall back to the $92,000-$95,000 support zone 1.
Technical aspects and market structure
Breakout-retracement mode: If the weekly close stabilizes at $107,720, the upward trend may be confirmed, with the target pointing to $110,000-$130,000. The historical analogy of the "step-up" structure in Q4 2024 indicates that the bull market may continue.
Short-term resistance and support:
Resistance level: $108,500 (if it breaks through, it may test $110,000).
Support level: $107,500 (if it breaks below, it may drop to $106,500)410.
Bitcoin has recently fluctuated between $106,000 and $110,000, with ETF inflows and long-term holders selling forming a seesaw 57.
Summary
Bitcoin is currently in a critical game range. The short-term trend may be determined by the liquidation trigger point (107,100-108,800 US dollars), and is also affected by macro policies (tariffs, the Federal Reserve) and institutional capital flows. The medium- and long-term bullish expectations are strong, but attention should be paid to high leverage risks and changes in market sentiment.
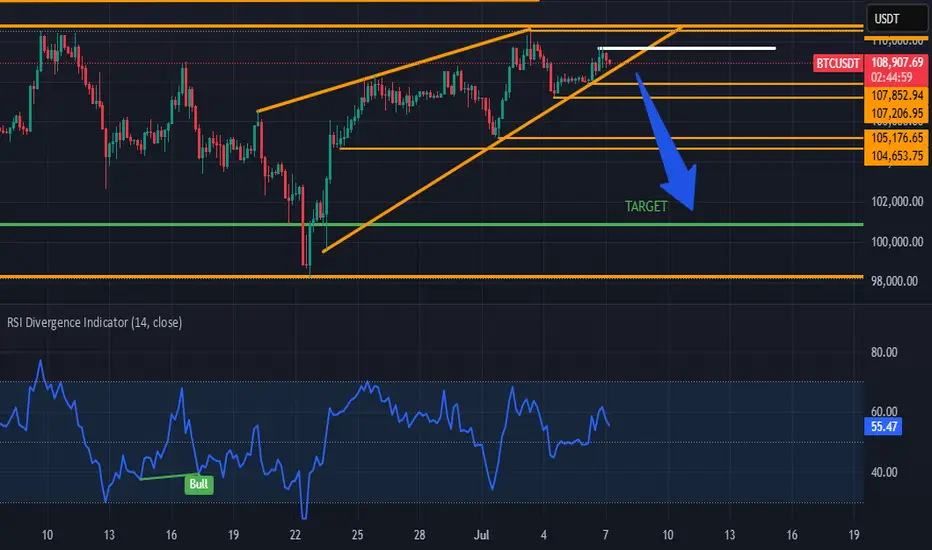
Is Bitcoin Getting Ready to dump?
In this analysis, I looked at the weekly, daily, and 4-hour timeframes and found some key signals that suggest a major shift might be coming in Bitcoin’s movement over the next few days and weeks.
If you don’t want to get caught off guard by the next big move, make sure to watch the video all the way through!

Bitcoin sell short bigBitcoin is ready to fill the big gap and the biggest liquidity, the range of 25,000 and 19,000 can be a good time to buy Bitcoin.

BTCUSDT 30-Min | Microstructure Breakdown at Key ConfluencePrice Action:
BTC rejected from Fib 0.5–0.618 zone (110.2K–111.5K), aligning with rising channel resistance.
Failed breakout attempt above local highs (~109.6K) → price sharply reversed.
Clean breakdown from rising wedge/channel support (blue) and EMA cluster.
Support/Resistance:
Immediate support at 107.5K (red horizontal) now under pressure.
Next key support: 106.6K zone (channel lower bound, Fib cluster, previous demand).
Resistance remains strong at 109.8K–110.2K (gray zone + trendline).
Indicators:
Volume spike during recent breakdown = bearish confirmation
Multiple consecutive sell signals after EMA flattening = momentum shift
Minor bounce attempts got rejected at descending EMA stack
🎯 Quick Take:
Bias: Bearish below 108.2K
Scalp short active while price is under red horizontal + EMAs
Watch for bounce attempt near 106.6K–106.3K
Invalidation: Clean reclaim of 108.6K + bullish volume

BTC Leg2 115KBINANCE:BTCUSDT major movement from base 98K S to 106K $.BTC want to next movement to 115K $ but in middle of way 110K $ level there are sellers.
Support: 106.000 - 102.000
Resistance: 110.400 - 115.000
⚠️Control Risk Management

BTC - will it touch ATH @ 112K ?Well the move of BTC was moved just touching the 4H or 1H ob acted as a well cushion and moved up, Looks like this is going to happen for once and then can be seen!

BTC massive sell BTC massive sell is about to begin
Wait for confirmation
Buyers are active in the supply zone
Watch out for potential turning points
To the down or upside.
Proper risk management is advised
Happy trading.

BTCUSDT – Calm Before the BreakoutBitcoin is holding firmly above the ascending trendline, consolidating within the accumulation range of $98,000 to $117,000. The current structure suggests that buyers remain in control, especially after a strong rebound from the $98,450 support zone.
In terms of news, BTC has been slightly affected by market concerns over new U.S. tariffs. However, on-chain data still shows strong accumulation around the $108,000 level. If this base holds, BTCUSDT could break out toward the $117,424 target in the near term. Conversely, if the trendline fails, the $98,000 level will be the final stronghold for the bulls.

BTC in a Bearish movementIt appears that BTC has already completed the C leg of a 60-minute harmonic pattern near 109680
BTC is forming a larger corrective pattern rather than taking a true direction, thus increasing the chances of completing this pattern before moving up again.
Currently, the price is positioned to complete the D leg of the pattern near 105700
I am looking for short-term targets near 107240; 106275 and 105715

BTC up following H1 trend linePlan BTC today: 07 July 2025
Related Information:!!!
Bitcoin (BTC) trades slightly below $109,000 at the time of writing on Monday, following its highest weekly close on record. Institutional and corporate demand continues to serve as a key catalyst, with Metaplanet acquiring an additional 2,205 BTC on Monday, while US-listed spot Bitcoin Exchange Traded Funds (ETFs) saw over $769 million in net inflows last week.
As market participants assess the latest bullish indicators, focus now shifts to broader macroeconomic developments, including new trade-related headlines and reports suggesting that the administration of US President Donald Trump may extend the current tariff pause until August 1.
personal opinion:!!!
BTC moves sideways in the trend line, trend line support 108,300
Important price zone to consider :!!!
support zone : 108.300
Sustainable trading to beat the market

BTC IS ABOUT THE RETEST THE 100.000 RANGE AGAIN BTC is about to break out of a bearish wedge and according to the Fibonacci extension it will test the $100,000 range again! I can also analyze a bearish divergence on 1 hour chart. Good luck folks... What are your ideas on that one?
"BTC Pumps from $108,850 to $109,900 – What's Next?"Bitcoin has shown strong bullish momentum, rising from $108,850 to $109,900 in a short time. This move signals renewed buying interest in the market and suggests that Bitcoin may be preparing for a breakout above the $110,000 level.
Analysts believe this move is driven by whale accumulation, positive global sentiment around crypto regulations, and technical indicators pointing to a breakout. If BTC holds above $109,900, the next targets could be $110K and $112K.
Stay alert — the bulls might be back!

Bitcoin Technical Analysis – Key Supports in Focus🔥 Bitcoin Technical Analysis – Key Supports in Focus
Bitcoin (BTCUSDT) is currently going through a correction after its recent rally. All eyes are now on the $107,000 support level. If this zone holds, we might see a bullish bounce from here.
⚠️ However, if BTC loses this support, the next strong demand zone lies at $105,300 — a critical level to watch for any potential reversal.
📈 On the upside, if bulls take control and price rebounds, the first target would be $113,700, followed by $117,800 as the next major resistance.
🧠 Smart traders are watching these levels closely — don’t miss the next move.
🔔 Follow for more real-time insights, clean charts, and professional TA!
#BTC #Bitcoin #CryptoTrading #BTCUSDT #TechnicalAnalysis #TradingViewIdeas #SupportAndResistance

BTC price prediction As my personal analysis if BTC crossing 🚸 110655 without touching the previous high 111960 then BTC moving down 👇 directly or after sideways condition some days

CONSOLIDATIONfriends BTC will consolidate inside the channel for couple of days . if it break upside it will make all time high definitely. if it break downside there is chance of dump till 105k.

BTCUSDT - UniverseMetta - Signal#BTCUSDT - UniverseMetta - Signal
D1 - Formation of the 3rd wave + potential exit from the channel. Stop behind the minimum of the 2nd wave.
Entry: 107481.70
TP: 111110.12 - 115670.15 - 119641.79 - 126457.32
Stop: 104882.98

A bearish 12 Month candle could be in the cardsBitcoin made an yearly high of 20% after 6 months in on the yearly candle
This does not make me feel great about the rest of the year
a clear sell signal would be an higher timeframe close under 100k after an upthrust to new ath around 110k - 120k
around 50k-54k for me is an good buy level to build an longterm position:
0.382 fib retracement for an primary 1-2 wave
0.500 fib retracement from the 25k low
0.886 fib retracement from 49k low
50% pullback from current high to projected low
where will bitcoin go ? i don't know, but i do know where i want to buy and when i want to sell

BTC Intraday SetupWait for the liquidation sweep on any side, then take entry, btc moving in sideways for many days, remember that first breakout will be fakeout on any side.

HolderStat┆BTCUSD fixed above the triangleBINANCE:BTCUSDT is rebounding from a consolidation base at $106,000 with strong bullish structure. The triangle breakout and recent higher lows point toward a move to $115,000–$120,000 if momentum continues.

BTC - Are you the one who is long?If yes! Book, Looks like a LIQ hump trap here! Wait for 105k smooth, or let it fall to retrace up to 109,860 to initiate!

BitcoinHello everyone, I have a opinion about bitcoin chart I analyzed bitcoin chart at monthly timeframe and it obviously related to Elliot waves and I combined it with price action and I extract some good information about Price Road of bitcoin so in my opinion bitcoin going to decrease and I show that on chart how bitcoin price will be behave.
Have a good trade
