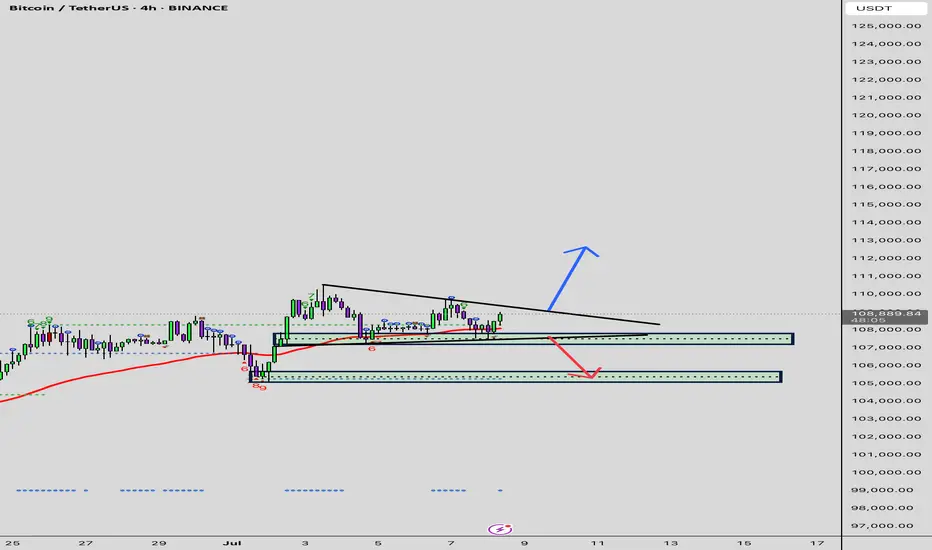
Final move by the bears? Bulls lining up for ATHHi traders and investors!
Buyers have reached the first target at 108,952.
On Binance spot, BTC missed the second target (110,530.17) by just 99 cents.
Is this a setup for a breakout and a run toward a new ATH?
So far, the price action looks like a level manipulation around 108,952: volume in all 3 bars interacting with this level is concentrated above it.
Just below lies a buyer zone (107,500 – 105,100).
I am watching for buyer reaction once the price reaches this area.
This analysis is based on the Initiative Analysis concept (IA).
Wishing you profitable trades!
USTBTC trade ideas

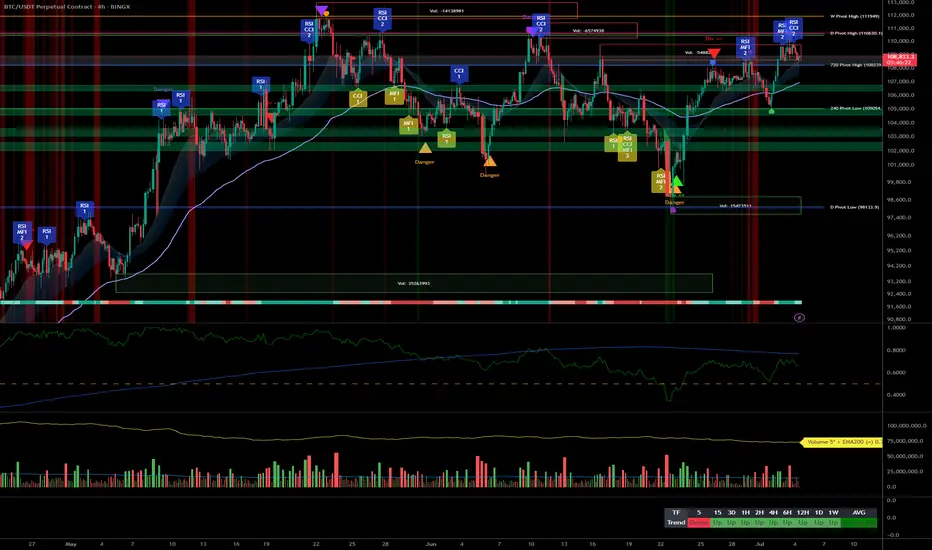
Bitcoin Analysis: Risk under 108k, aiming 111k+ in continuation__________________________________________________________________________________
Technical Overview – Summary Points
__________________________________________________________________________________
Momentum: Strong uptrend across all major timeframes (MTFTI “up”). Buyers remain in control; daily/4H/1H structure robust.
Key supports: 108,239.1 (720min Pivot, critical transversal support), 105,054.7 (240min Pivot), 99,581 (240min Pivot). Active defense seen on 108,239.1 at all timeframes.
Main resistances: 110,630.1 (1D), 110,483.1 (240min), 111,949 (W). The 110–111k area acts as the short-term ceiling.
Volume: Moderate activity, no spikes or climaxes, slight intensification noted on the 30min during key tests.
Risk On / Risk Off Indicator: “STRONG BUY” signal on all Tfs ≥30min, contributing to marked bullish momentum. Minor short-term divergence only on 15min.
Multi-TF behavior: ISPD DIV and Investor Satisfaction are neutral, no extreme behavioral stress; psychology is balanced, neither panic nor euphoria.
__________________________________________________________________________________
Strategic Summary
__________________________________________________________________________________
Overall bias: Bullish, synchronized multi-timeframes, dominant bullish liquidity.
Opportunities: Optimal long entries on validated pullback to 108,239.1, add on breakout of 110,630–111,949. Gradual partial take profit recommended in the 111k area.
Risk zones: Invalidation below 108,239.1 (confirmed H2 close), risk of further correction toward 105k then 99.5k; suggested swing stop under 108,000.
Macro catalysts: No major event, global markets stable. Geopolitical tensions monitored, low short-term impact.
Action plan: Prioritize “buy the dip” on pivots, active monitoring for any breakout/failure. Dynamic stop management, partial profit-taking on extension.
__________________________________________________________________________________
Multi-Timeframe Analysis
__________________________________________________________________________________
1D: Very strong daily structure, high momentum, intermediate supports near 98k/100.5k. Watch for major resistances at 108–111k.
12H/6H/4H: Ranging below 110–111k resistance, no fragility. Supports 108,239.1 and 105,054.7 holding, no selling pressure detected. Watch for breakout/impulse.
2H/1H: Buy zone if maintained >108,239.1, risk of sell-off below this pivot toward 105k. Price is ranging, momentum remains positive.
30min/15min: Consolidation on supports. 15min: temporary divergence on the Risk On / Risk Off Indicator but bullish structure intact unless a clean break below 108,239.1.
Risk On / Risk Off summaries: Dominant “strong buy” tone, synchronized momentum, only weak short-term divergence. No behavioral stress (ISPD DIV neutral everywhere).
__________________________________________________________________________________
Cross-analysis and recommendations
__________________________________________________________________________________
Momentum: Bullish environment sustained as long as >108,239.1. Continued upside bias if breakout above 110–111k is confirmed.
Risks: No major vulnerabilities detected. Very low probability of a local top, except in the case of exogenous macro shock.
Macro & On-chain: Stable newsflow, no distribution from HODLers or significant new inflows. Preferred strategy: swing trading in trend direction, tight stop under the main pivot.
__________________________________________________________________________________
Decision summary
__________________________________________________________________________________
Preferred scenario: Hold long >108,239.1, add on validated pullback, look for breakout with volume extension to 111k+.
Risk management: Stop under 108,000, partial profit-taking in the 110,630–111,949 area.
No immediate macro constraints: Use this calm window to ride the trend.
Monitoring: Resilience of the main support, any sudden geopolitical shocks.
BTC/USDT keeps a clear bullish bias, favoring swing or trend-following strategies as long as key pivots hold. Buy the dips remains optimal while technical structure holds; strict stop management is advised pending any “breakout fail”.

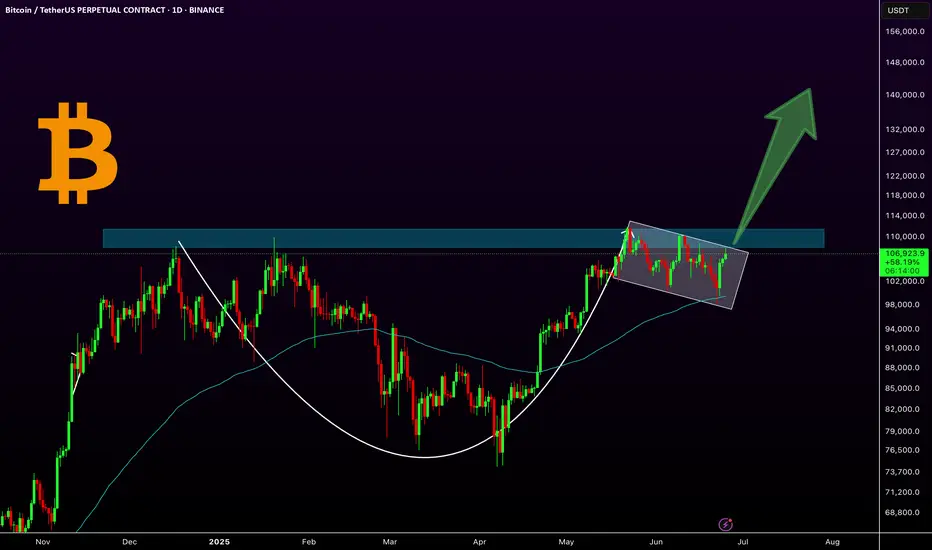
BTC: A Classic Cup & Handle in Play!Bitcoin has formed a classic cup and handle pattern on the daily chart, with the 100 EMA providing solid support during the handle formation. Currently, the price is consolidating in what appears to be a bullish flag or extended handle, just below the key resistance zone around $109K. A breakout above this level could ignite a strong bullish rally toward higher targets like $144k.
Key Highlights:
-Cup & Handle pattern confirmed
-10 EMA acting as dynamic support
-Bullish flag/handle forming near resistance
- A breakout could lead to explosive upside
Regards
Hexa
CRYPTOCAP:BTC BITSTAMP:BTCUSD
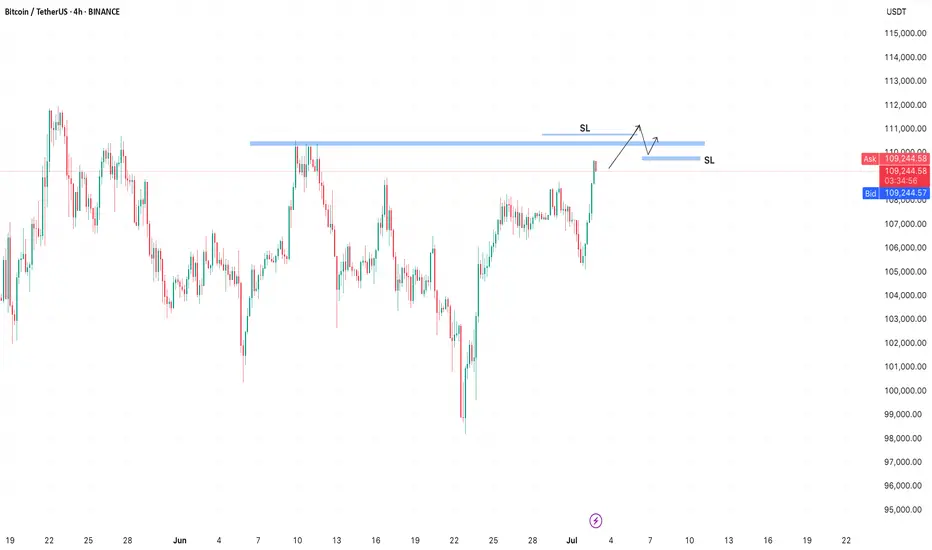
BTC is approaching a strong zone!BTC has a strong zone around 110,500 where a large number of orders are stacked.
In crypto, it’s common for stop losses to be taken on both sides.
After a breakout above the zone, short sellers get liquidated, while buyers enter the market — only to be stopped out by a false breakout when the price drops below the zone to trigger their stops.
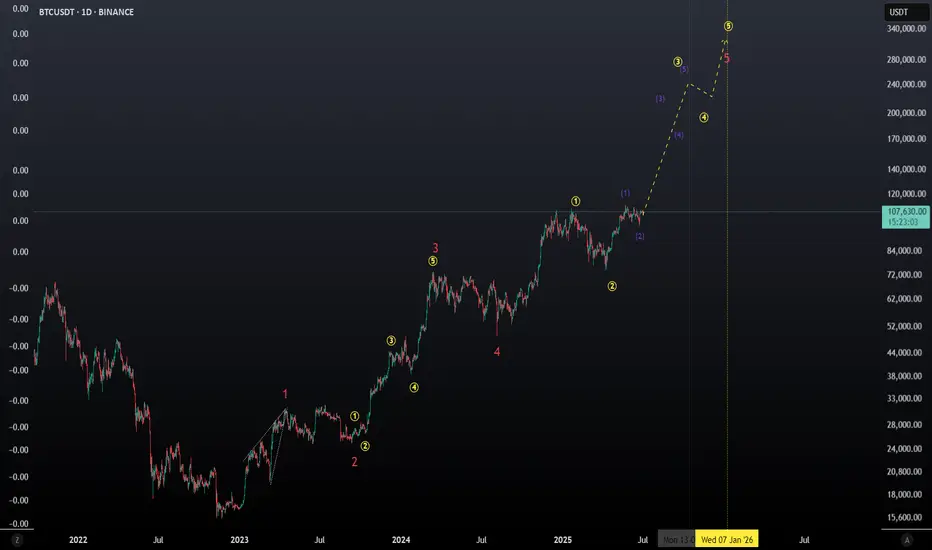
$BTC Outlook Macro These next few months are mega bullish.
Expecting a big move upwards + an altseason.
Bitcoin STANDING..bitcoin now is standing on monthly pivot and hold that as the support.
3rd pivot's resistance is at 124k is reachable in few weeks.

BTC/USD SCENARIO Bitcoin is trying to break out of the 110,000
If we break out we will see a new high
If we don’t break it we could see 105k possibly 100k
(BTC/USDT).- Bitcoin (BTC/USDT) .
- Current price testing resistance at $110,489.
- Descending trendline indicates potential bearish pressure.
- Key support levels: $107,466, $105,000, $102,693.
- Potential upside target: $112,500 if resistance breaks.
- Potential downside target: $100,000 if support fails.

#BTC Update #4 – July 7, 2025🟠 #BTC Update #4 – July 7, 2025
Bitcoin has been trading inside a supply zone , and its last impulsive move happened right into that area. While it tried to push higher again, I now see signs of rejection.
If this rejection holds, the first level I’m watching is $107,850 . Below that, there's a key support around $106,350 . Should this level break, we could see a deeper drop toward $102,650 , where an imbalance zone remains untested.
At the moment, short setups look more reasonable than longs but from a risk/reward perspective, I don’t see enough edge to take action yet. So for now, I’m not entering any position and will simply watch BTC’s next move .

BTC Bullflag break Currently, BTC is forming a bullish continuation pattern, combining both a bull flag and an ascending triangle, which suggests potential upside momentum. The price is trading within a defined range, sitting just below a supply zone, which has previously acted as resistance. If the price rejects from this supply zone and drops to the demand zone below, it presents a strong long opportunity, as this zone has historically shown buying interest. Additionally, the current price structure aligns with the 0.5 Fibonacci retracement level, indicating a possible reversal area. If BTC retraces to the demand zone, a long entry can be considered with a stop loss below the zone and a target at the 1.168 Fibonacci extension, providing a favorable risk-to-reward setup. Overall, the setup shows bullish confluence with a clear trade plan based on market structure, Fibonacci levels, and supply/demand zones.

BTC - Testing Trendline Here is an update to our previous post:
Zoom into the lowertime frame (1H) here is a zoomed in look at what is going on. Right now BTC just tested the trendline we pointed out in the last post. As you can see we have many touchpoints of support on this trendline (green arrows). Very important to monitor BTC's price action around this trendline.
If price is to lose this level then we would want to watch our fib target of $103k. If price can continue to hold it as support then a move back to test the red trendline is likely.

Bitcoin BTC price analysis BTC.D and events calendar for JulyToday is the last day of the month and the last day of the second quarter, so there may be some volatility in the markets between 🐂 VS 🐻
💰 The CRYPTOCAP:BTC chart shows an interesting picture — the price has reached the upper limit of the consolidation channel, and now:
1️⃣ The scenario with an upward breakout is quite clear: a breakout from the channel upward and consolidation above $108-110k= a move to $125k during July.
2️⃣ A correction to $99k will mean that buyers have taken control of the OKX:BTCUSDT price, preventing it from updating its lows. This will be a clear signal to buy, because further growth is inevitable.
3️⃣ A deep correction to $91,660 (filling the GAP that formed on the CME BTC chart) or slightly lower. This is the last “unclosed” GAP, which, according to TA rules, should be filled for a full-fledged growth trend to begin.
So which scenario is closer to your heart, which one do you believe in?
Or write your version of events in the comments.
Interesting observations to think about:
◆ Over the past two weeks, the inflow of funds to #BTCETF has exceeded $5 billion, but the price of #BTCUSD on CEX exchanges has not been able to “break out” upward. Is this just ETF "property of numbers", or are spot #Bitcoin sales that strong?
◆ The BTC.D indicator has reached a critical level of 66%, and it will be interesting to see whether it will give altcoins some breathing room next month.
(If there are a lot of likes and comments under the idea, we will additionally describe our thoughts on BTC.D and USDT.D.)
◆ SP 500, by the way, has updated its highs, and the last few months on the stock market are very similar to the beginning and middle of the COVID-19 pandemic in 2020.
◆ And in principle, July promises to be very eventful:
👉 By July 9, Trump is expected to make a statement regarding the tariff wars with the rest of the world, which he has put on hold.
👉 July 18 marks the beginning of Mercury retrograde, which “influences” people's behavior and ‘superstitions’ and forces them to be “more cautious” when making trading decisions (and trading bots don't care about emotions and beliefs)
👉 And on July 30, there will be a FOMC meeting, where Mr. Powell may announce a rate cut, as the US is in a recession, which is time to acknowledge.
If we have forgotten anything, please add it in the comments!

BTCUSDTBTC ,another complete analysis as posted for free early ,the weekly candle failed to break and close above 4hr supply roof at 108k and the next step is to watch the current 4hrs demand floor .A BREAK OF STRUTURE WILL BE EYEING 96-94K ,THE EMA+SMA STRATEGY ALIGNS WITH THE ASCENDING TREND LINE FOR A POTENTIAL BUY BACK WHERE WE HOPE TO CHALLENGE BROKEN 100K ZONE AS NEXT SUPPLY ROOF IF RESPECTED.

BITCOIN PREDICTION THAT WILL MAKE BULLS CRYI am sharing with you exclusive insights that I am seeing on MARKETSCOM:BITCOIN right now.
WARNING: If you are a bull, you might start crying hysterically while watching this video.

Short BTC, it is about to retrace and test 100000 again!As BTC gradually fell back, the rebound did not stand above 110,000 in the short term, proving that there is strong selling pressure above, and the trend line formed by the technical high point 111,000 and the second high point 110,000 formed an important resistance area, which limited the rebound space of BTC and strengthened the demand for BTC's short-term retracement.
According to the current trend, the short-term oscillation bottom area of 106,000 may be broken at any time. Once it falls below the oscillation area, it may arouse a certain degree of profit-taking chips and stimulate BTC to accelerate its decline. I think BTC will at least test the 105,000-104,000 area again during the retracement, and may even test the 100,000 integer mark again.
Therefore, shorting BTC is still the preferred option for current short-term trading.
Consider shorting BTC in the 108,000-109,000 area, and the target area in the short term is 104,500-103,500. After breaking this area, the target can be extended to 101,000-100,000.
BINANCE:BTCUSDT BINANCE:BTCUSDT BITSTAMP:BTCUSD

Bitcoin Playing Below The Crucial Area, Im Out of The Market🥱 I’ve been active in this market since 2017, and I’ve never seen it this dull and exhausting.
👉 Bitcoin has been ranging around the $110K level for nearly six months now, and once again, it’s trading below a critical resistance level. In my opinion, staying out of the market and just observing is still the best approach.
📥 Trading in such market conditions can be mentally draining, which is why I prefer to stay on the sidelines and simply watch for now
📉 Any rejection from this area could lead to a price drop down to the 95K zone. Although there’s a possibility of a buying pressure up to the 115K level as a shadow, even if this scenario plays out, it won’t change my overall outlook on Bitcoin

MONDAY - TRADE OF THE DAYFew nice plays over the weekend shame I am not active on weekends.
I will be posting a video later today so see you in class!

Skeptic| Cycle Mastery Part 1: HWC, MWC, LWC for Smarter TradingUnderstanding Higher Wave Cycle ( HWC ), Minor Wave Cycle ( MWC ), and Low Wave Cycle ( LWC ) is the key to making informed trading decisions, simplifying when to go long , short , or stay out . This Part 1 masterclass introduces these cycles, their relative nature, and how to align them with your strategy for precise entries and effective risk management . Let’s break it down. 📊
The Three Cycles: HWC, MWC, LWC
We trade across three market cycles:
HWC (Higher Wave Cycle) : The big-picture trend, like Bitcoin’s yearly uptrend.
MWC (Minor Wave Cycle): A medium-term trend, often an uptrend or corrective phase within the HWC.
LWC (Low Wave Cycle): The short-term daily trend, which can be range-bound, uptrend, or downtrend.
Knowing these cycles helps you decide when to e nter long, short, or avoid trading altogether, ensuring you align with the market’s rhythm.
Defining Your Cycles: It’s Relative
The main question before diving in: What timeframes are HWC, MWC, and LWC? The answer is relative—it depends on your strategy. Think of it like a temperature scale: 0°C isn’t “no heat” but a reference point (water’s freezing point). Similarly, your cycles are defined by the largest timeframe you analyze:
HWC: Your highest timeframe (e.g., Weekly for long-term traders).
MWC: The next level down (e.g., Daily).
LWC: Your shortest timeframe (e.g., 4-Hour or 1-Hour).
Ask yourself: What’s the largest timeframe I check? Set your HWC there, then scale down for MWC and LWC based on your trading style. This relativity ensures your cycles fit your unique approach.
While shorter cycles (LWC, MWC) form the HWC, the HWC’s power dominates, influencing smaller cycles. Let’s explore how to trade based on these relationships.
Trading Scenarios: When to Act
Scenario 1: HWC Uptrend, MWC Range
When the HWC is in an uptrend and the MWC is range-bound:
Action: Enter a long position on the first MWC wave when the LWC breaks the ceiling of the MWC range (e.g., a box breakout).
Why? The HWC’s bullish power supports the move, likely triggering an MWC uptrend. This makes the first wave a strong, low-risk entry.
Example: If the LWC (e.g., 4-hour) breaks the MWC range ceiling with a strong candle, you can confidently go long, backed by the HWC uptrend.
Scenario 2: HWC Downtrend, MWC Range
When the HWC is in a downtrend and the MWC is range-bound:
Action: Skip the first MWC wave. If the LWC breaks the MWC range ceiling, avoid going long—the bearish HWC could reject the move, resuming its downtrend.
Wait for the Second Wave: Let the MWC return to a range after the first wave. If the LWC breaks the range ceiling again, go long with confidence—the HWC’s influence is less likely to disrupt this second wave.
Risk Management Tips (if you trade the first wave against the HWC):
Reduce Risk: Lower your position size to minimize exposure.
Take Profits Early: Close the position or secure most profits (e.g., scale out) once you hit your R/R target, as volatility is high.
Wider Stop-Loss: Set a larger stop-loss to account for potential HWC-driven reversals, as stop-loss hunts are common in this scenario.
Adjusting Stop-Loss Size Based on Cycles
Aligned Cycles (HWC, MWC, LWC in Same Direction): When all three cycles align (e.g., all uptrend), set a tighter stop-loss relative to market conditions. Gradually scale out profits instead of closing the position, as the trend’s strength supports higher R/R (e.g., 5 or 10).
HWC Against MWC/LWC: If the HWC opposes the other cycles (e.g., HWC downtrend, MWC/LWC uptrend), use a wider stop-loss. The HWC’s power could reverse the LWC, lowering your win rate if stops are too tight. Expect volatility and plan accordingly.
Final Vibe Check
This Cycle Mastery Part 1 equips you to time MWC waves with precision, aligning HWC, MWC, and LWC for smarter entries. By mastering when to trade the first or second wave, you’ll avoid traps and maximize your edge. Part 2 will dive deeper with examples—stay tuned! At Skeptic Lab, we trade with no FOMO, no hype, just reason. Protect your capital—stick to 1%–2% risk per trade. Want Part 2 or another topic? Drop it in the comments! If this guide sharpened your game, hit that boost—it fuels my mission! 😊 Stay disciplined, fam! ✌️
💬 Let’s Talk!
How will you time your MWC waves? Share your thoughts in the comments, and let’s crush it together!

Bitcoin Bullish Flag Breakout Incoming?MARKETSCOM:BITCOIN is currently consolidating within a bullish flag pattern on the daily chart, following a strong impulse move from the $74,000 support zone marked in April. The price is hovering near a critical horizontal resistance zone ($ 108,000–$ 109,000), which has historically acted as a major barrier to further gains.
Technical Highlights:
Bullish Flag Pattern: Clear flag formation after a strong uptrend, suggesting continuation potential.
Strong Support Rebound: April's bounce from the ~$74K support zone marked a key higher low.
EMA: Price is currently trading above both the 50-day and 100-day EMAs — a bullish sign of momentum.
Breakout Potential: A confirmed breakout above the flag resistance (~$109K) could ignite a strong rally toward $130K+.
Breakout Move: If the flag pattern plays out, CRYPTOCAP:BTC could target the $125K–$135K zone in the coming weeks.
Buy Entry: Once the day candle closes above the flag resistance line

Bitcoin Overall: Likely Short to SupportI think bitcoin will likely find resistance at the current range, or slightly higher, and move down in a stepwise fashion to the indicated supports in the near future.

2/1/15I promised to update the idea of what will happen with the graph in the future. At 22 cm, we should now fall down.

Bitcoin short position After my win streak from previous trades on btcusd I happy to give me to the people who followed me
Here's another great trade for you
Short Bitcoin with a limit order at 108,500
Take profit at 101k , stop loss at 109,500
A 7.5 to 1 risk reward ratio 🔥😉
You can never find anybody trade Bitcoin like me
