trade idea on btcthis is my idea about bitcoin movement in next hours.the target is shown in picture.follow for more....
USTBTC trade ideas
BTC - Will the Bears finally get their chance?Buy Side Liquidity Sweep in Progress
Price is currently climbing toward a region densely packed with resting buy side liquidity, marked by multiple previous highs. The area around 108,900 to 111,000 is especially significant, with two clear liquidity pools stacked above recent swing highs. These levels are likely to attract price as market participants seek to trigger stop orders and induce fresh buying interest—setting the stage for a potential reversal.
Weakness in the Current Impulse
The recent rally has advanced with minimal retracement and virtually no visible Gaps. This lack of corrective structure often indicates imbalance and suggests the move is overextended. When price moves upward too cleanly, it tends to leave behind thin liquidity zones, making the entire leg vulnerable to a sharper correction once exhaustion sets in.
Fair Value Gap as a Draw Below
Below current price lies a prominent bullish Fair Value Gap around 104,000. This inefficiency was left unfilled during the last leg up and may now serve as a magnet for price. These types of Gaps are often revisited by the market in an effort to rebalance supply and demand, especially after aggressive moves that break structure to the upside.
Once the higher liquidity levels are swept, watch for a clear reaction—either a strong rejection or lower timeframe structure shift—which could signal that the top is in. If that shift materializes, price may begin a downward leg targeting the unfilled Gap below. The magnitude of the move, combined with the lack of structure on the way up, leaves plenty of room for corrective action.
For those looking to engage, waiting for confirmation on a lower timeframe—such as a break of short-term bullish structure or the formation of a bearish Gap—can help time entries more precisely. In setups like these, patience is key: let the Sweep play out, observe how price reacts, and only then consider stepping in.

#BTCUSDT.p Bearish📉 Short Trade Alert! We're eyeing a potential downside move with a clear entry, stop loss, and multiple profit targets. Keeping a close watch on this one. #Trading #MarketAnalysis #ShortTrade #RiskReward

BTC/USDT 4H Outlook - Bearish Setup playing outAs expected, BTC is now moving toward the 4H liquidity zone.
❗Price is breaking structure from the Daily FVG resistance, showing bearish momentum.
🔍 Current confluences in play:
— Rejection from Daily FVG
— 4H structure shift
— Clean imbalance below
🎯 My next key zone is 104K (4H liquidity)
Reaction there will guide the next move.
Stay tuned for more updates

110k soon , best time to buy altcoins Btc still didnt complete main wave 5 , btc for last time touch 98k but this time price will attack 110k and then we will have NATH.

BTC - Double Top after Liquidity Sweep?Price has recently executed a Buy Side Liquidity Sweep just above the previous high. This type of move often signals a potential shift in market direction, especially when followed by signs of exhaustion or failure to push higher. In this case, price has formed a double top near the 106,600 level, a classic sign of weakening bullish momentum and hesitation at a key resistance area.
Following the Sweep, the projection suggests a possible rejection from this region, leading to a corrective move to rebalance the inefficiencies left behind by the sharp upward impulse. These inefficiencies are marked as Fair Value Gaps —areas where price moved too quickly, leaving imbalanced zones between buyers and sellers. The market tends to return to these areas over time as it seeks equilibrium.
The first Gap lies just below the 0.28 Fibonacci retracement and may serve as an initial area for a reaction. If price slices through this level without meaningful support, attention shifts to the second Gap, which aligns closely with the 0.50 to 0.618 retracement zone. This region is historically significant for pullbacks and could offer a temporary pause or bounce.
Should the move extend further, the third and deepest Gap, located between the 0.618 and 0.65 levels , becomes a key area of interest. It marks a critical rebalancing zone that could attract stronger buying interest. If this area fails to hold, the 0.786 retracement level sits just below and may act as a final point for support before any broader directional change.
For refined entries, traders can watch lower timeframes like the 5-minute chart. Look for signs of weakness, such as an inverted Gap or a lower-timeframe break in structure, to time positions with tighter risk. This allows participation in the broader move while maintaining tactical precision.
The confluence of a Buy Side Liquidity Sweep, a double top , and multiple Gaps below provides a clear framework for a potential downside play. As always, let the price action lead.
Patience, confirmation, and context are key to executing with confidence.

The Pattern That Could Launch Bitcoin, pt. 2There appears to be an IH&S pattern forming inside of the larger IH&S's right shoulder (see my previous post for the larger one). I've seen this happen a few times and then a break out upwards! Results may vary of course lol.
If it drops from here support could be at around $102k and then $100,500.

Trade of the day!These are the areas I have my eyes on. We are in a range and can get a long or short play here. If we break bullishly, I will be wary of the supply above, if we break down here there's a lot of liquidity to sweep. Lets see what happens
Confirmation: MS change on secondary TF or Divergences

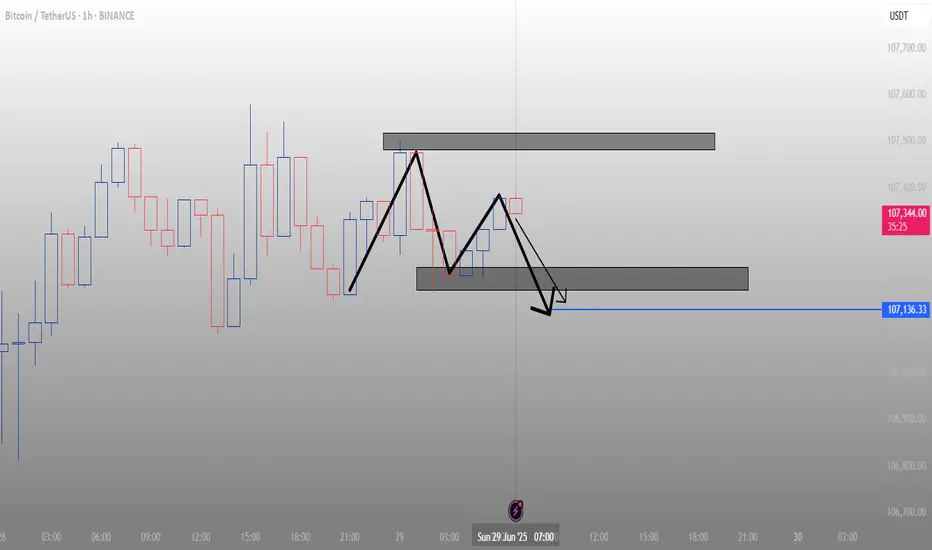
Bitcoin - Bears Take Control, Reversal Coming?After an aggressive bullish rally, Bitcoin has filled a clean 1H imbalance zone near 108K and swept short-term liquidity above recent 1H highs. The move into premium pricing saw clear signs of rejection, with a strong bearish reaction directly inside the imbalance area. This reaction confirms the area as a valid supply zone and signals that bulls may have exhausted their momentum in the short term.
Liquidity Sweep and Rejection
The sweep of prior highs was sharp and quick, lacking follow-through, and was immediately followed by rejection wicks and a drop in momentum. This kind of price action typically hints at engineered liquidity grabs, where smart money drives price into inefficiencies to fill orders before reversing direction. That liquidity sweep, paired with the fill of the 1H FVG, increases the probability that this high is now set in place for a short-term reversal.
Key Short-Term Level to Watch
The immediate level of interest lies at the most recent low before the rally, marked clearly as a potential short-term support. This low often acts as a magnet post-sweep, as price retraces to test if there’s real buyer interest left or not. If this low fails to hold, the bearish momentum could accelerate into the nearby 4H Fair Value Gap around the 102.5K–101.9K area.
Fair Value Gap and Lower Target
That 4H FVG has not yet been filled, and there’s also a small unmitigated imbalance sitting just above it. If price drops into this zone and still fails to show strong buyer interest, the path opens toward a more significant downside move. The final downside target sits near 98K, highlighted by a higher timeframe demand area and major structure level. This zone would only come into play if all intermediate support levels break cleanly.
Bearish Roadmap
Short-term, I expect a retest of the recent low, followed by a possible reaction. But if that reaction fails and momentum stays bearish, the 4H FVG fill becomes highly likely. A break below that would shift control decisively to sellers, with 98K as the next major liquidity pocket to target. This move would also clean out most of the inefficiencies left behind by the recent aggressive bullish move.
Conclusion
The rejection from the 1H imbalance and liquidity sweep suggest Bitcoin’s recent rally may be done for now. Until we reclaim the 1H FVG and break above recent highs with strength, the bias is bearish. If the key low breaks, I’ll be watching how price reacts inside the FVG zone. A weak reaction could open up the flush toward the 98K level for a larger liquidity draw.
___________________________________
Thanks for your support!
If you found this idea helpful or learned something new, drop a like 👍 and leave a comment, I’d love to hear your thoughts! 🚀

Bitcoin Reaches PRZ with Bearish Signals — Is a Drop Imminent?Bitcoin ( BINANCE:BTCUSDT ) has reached the Potential Reversal Zone(PRZ) as I expected in yesterday's post .
Bitcoin is trading in the Heavy Resistance zone($110,720-$105,820) , Potential Reversal Zone(PRZ) , and near the Resistance lines .
In terms of Elliott Wave theory , it seems that Bitcoin has managed to complete the main wave 5 with the help of the Ending Diagonal . The structure of wave 5 can be different.
Also, we can see the Regular Divergence(RD-) between Consecutive Peaks.
I expect Bitcoin to drop to at least $105,400 .
Cumulative Short Liquidation Leverage: $107,334-$108,250
Cumulative Long Liquidation Leverage: $105,037-$103,392
Note: We could be in for a bit of excitement in the financial markets during Federal Reserve Chairman Powell's speech.
Note: Stop Loss(SL)= $109,020 = We can expect more pumps.
Please respect each other's ideas and express them politely if you agree or disagree.
Bitcoin Analyze (BTCUSDT), 1-hour time frame.
Be sure to follow the updated ideas.
Do not forget to put a Stop loss for your positions (For every position you want to open).
Please follow your strategy and updates; this is just my Idea, and I will gladly see your ideas in this post.
Please do not forget the ✅' like '✅ button 🙏😊 & Share it with your friends; thanks, and Trade safe.

BTC/USDT Technical Analysis, 2025-07-01 19:30 UTCA bullish trade opportunity was identified after price action formed a Piercing Line candlestick pattern, signaling a potential reversal from recent lows.
🔹 Technical Overview:
Entry Price: 105,869.86 USDT
Take Profit (TP): 106,939.86 USDT
Stop Loss (SL): 104,669.86 USDT
200 EMA: 106,320.49 USDT (Price is trading below — potential dip-buy opportunity)
Pattern Detected: Piercing Line (bullish reversal)
🔹 Volume Context:
Recent candles showed moderate volume with signs of buyer interest increasing.
OBV trend has turned slightly positive, supporting a short-term bullish case.
🔹 Order Flow:
Price action is showing signs of recovery from a local support zone.
Some imbalance in the order book tilted toward buyers, with supportive bid liquidity observed.
This setup combines trend deviation, bullish price action, and support reaction, creating a favorable risk-to-reward scenario. Trade is now active and being monitored toward the defined TP level, with strict stop-loss protection in place.

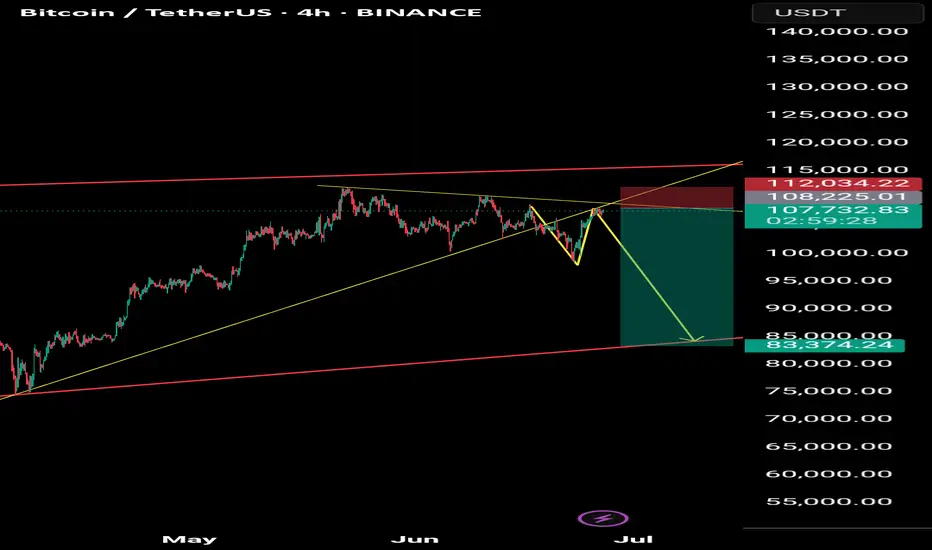
Bitcoin sell short 83000After breaking the long-term trend line and pullback, ready for a sharp move and correction to 83,000
BTCUSDT:Sharing of the Latest Trading StrategyAll the trading signals last week have resulted in profits!!! Check it!!!👉👉👉
Bitcoin Technical Analysis (4-Hour Chart):
Price remains within an ascending channel. The MACD above the zero line with expanding red histograms indicates bullish dominance. After firmly breaking above the key resistance at $105,000, price is testing $110,000.
Caution: The RSI near 70 has entered overbought territory, increasing short-term pullback risks.
Support levels: $106,000 and $105,000.
Trading Recommendation for Aggressive Traders
Consider light long positions near $106,000 on pullbacks, with stop-loss set below $105,000.
Trading Strategy:
buy@105000-106000
TP:108000-110000

Timeframes in Trading: Which Chart Tells You WhatHello, traders! 👋🏻 Why can the same chart tell a different story on 1D, 4H, or 15M? You’ve probably been there. BTC looks bullish on the daily… bearish on the 4-hour… and totally sideways on the 15-minute. So, which one is right?
The truth is: none of them is wrong. They’re just telling different parts of the story. Understanding timeframes in trading isn’t just a technical skill. It’s how you decode what the market is actually doing.
Every Timeframe Has a Role
Think of timeframes like zooming in and out on a map: The 1W chart tells you where the mountain ranges are, the macro trend. The 1D chart shows the highways and the current direction within that macro. The 4H chart reveals city streets, the local trend swings. And the 15M chart? That’s the back alleys, where the noise and micro moves live. BTC, for example, doesn't behave the same way across these views, and it shouldn't.
What Happens If You Ignore Timeframes?
You try to short a "breakdown" on the 15M, only to realize you just sold into 4H support.
You enter a 1D bullish breakout, only to panic when price pulls back aggressively on the 4H… forgetting that the 4H was just doing a retest. Or worse, you start trading against the macro trend, thinking the 15M chart holds more weight than it actually does.
How Professionals Read Timeframes (BTC Example)
Example:
You can start high, work down: 1W → 1D → 4H → 1H/15M. Check the macro first. Is BTC bullish, bearish, or ranging on the 1D or 1W? Then, you can map key levels: Support/resistance from higher timeframes is 10x more meaningful on lower timeframes. For example, BTC’s $30K, a weekly level, creates reactions even down on 5-minute charts. And, align context: A bullish setup on 15M is excellent, but check if it aligns with the 4H trend direction. If the 4H is also bullish, your setup has context. If not, expect chop.
🔗 BTC Right Now: Timeframe Confusion in Action
Just look at the current BTC structure. On the 1W, BTC is still trending higher, higher highs and higher lows from the $15K bottom in 2023. On the 1D, BTC trades inside a broad consolidation range after a strong uptrend. The price has repeatedly tested the $107K–$112K zone, acting as a key resistance cluster, while forming a series of higher lows. It's not a breakdown but a correction inside a bullish structure, testing previous supply zones. The 4H? Chaos. The price bounces between $105K and $112K, which is pure range behavior. The 15M? Traders are getting whipped trying to catch fake breakouts that mean nothing in the daily or weekly context.
Which Chart Tells You What?
All of them. But differently.
THE 1W TELLS YOU THE NARRATIVE.
THE 1D SHOWS YOU THE CURRENT DIRECTION.
THE 4H REVEALS TRADEABLE SWINGS WITHIN THAT DIRECTION.
THE 15M CAPTURES THE NOISE, THE TRAPS, AND THE MICRO OPPORTUNITIES.
If you’re only looking at one timeframe, you’re only seeing part of the picture. So, timeframes aren’t about right or wrong. They’re about perspective. If you’re a day trader, you probably live on the 5-minute to 15-minute charts, while still peeking at the 1H or 4H for structure.
If you’re a swing trader, the 4H and 1D are your home base, with the weekly chart guiding the bigger story. And if you’re thinking in months or quarters, the 1W and 1M are what actually matter – everything else is just noise.
So next time BTC feels “confusing”… zoom out. Or zoom in. The answer is probably hiding in the chart, just not the one you were looking at. Which timeframe do you trust the most when trading crypto? Drop it in the comments!

Bitcoin (BTC): Going For Another Breakout | New ATH?Bitcoin is showing strong signs of buyside movement, where we are pressuring the local resistance zone, which upon breaking should lead us to a new ATH area.
We have had multiple attempts to break out from that area, so being back here does not mean anything. yeet, we have to ave clean breakout in order to see the $120K area tested.
Swallow Academy

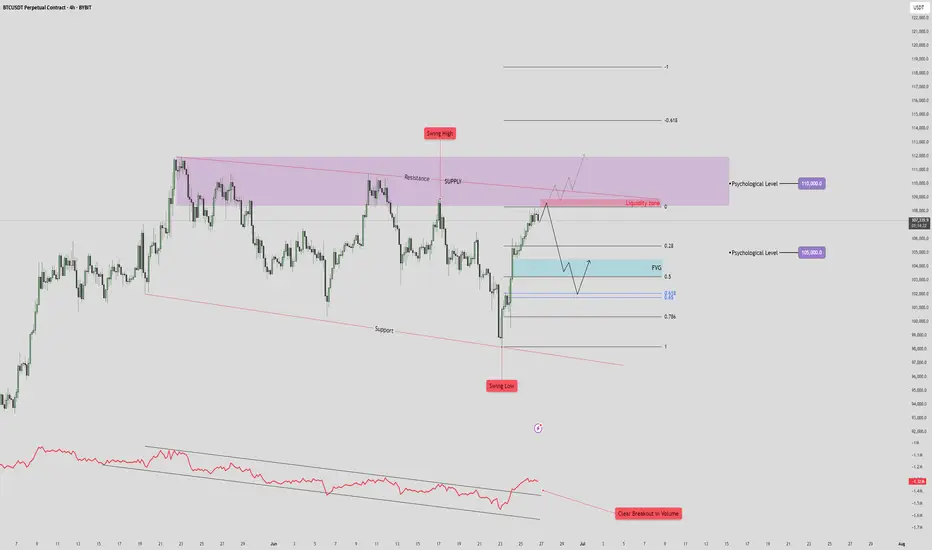
BTC/USDT Drop to 101k?🧠 High Time Frame Context
Trend: Consolidation within a broad range (support and resistance clearly defined).
Key Psychological Levels:
105,000 USDT – minor level, acting as a magnet in short-term PA.
110,000 USDT – major supply confluence and liquidity target.
🟪 Supply & Resistance Zone
Zone: Marked in purple (108.5k-112k).
Key Observation:
Swing high formed inside this zone, indicating liquidity trap.
Potential fake-out or strong rejection from this area.
Strong confluence with a descending resistance trendline, adding to the selling pressure.
🔵 Fair Value Gap (FVG) & Retracement Targets
FVG identified just below the current price (~103.5k-104.5k).
Price is projected to:
Reject from the current high.
Drop to fill the FVG zone.
Possibly bounce between FVG and Fibonacci retracement levels:
0.5
0.618
0.786
🔴 Volume & RSI Divergence
Volume breakout is noted on the last push down (bottom red annotation), followed by a retrace.
OBV shows bullish divergence with price:
🔻 Support Structure
Lower red trendline is a key long-term support.
Previous swing low aligns with this trendline – buyers showed strong interest here.
If FVG fails to hold, expect a retest of this trendline near 97,000–98,000.
📈 Likely Scenarios
Base Case (Neutral-Bearish):
Price rejects current zone (~107,000).
Pullback into FVG (101–104K).
Bounce to 105K (minor resistance), then decide next direction.
Bullish Breakout:
If price breaks and closes above 110K, it invalidates supply zone.
Opens door to 115–118K range.
Bearish Breakdown:
Fails FVG zone.
Tests previous swing low and support (~97K).
Below that, structure becomes macro bearish.
🧩 Summary
Short-Term: Retracement into FVG likely. Monitor reaction.
Medium-Term: Bearish bias while price is below 110K.
Invalidation for bears: Clean break and hold above 110K.
#BTC Update. Here's the trigger point.CRYPTOCAP:BTC Update:
Bitcoin is trading around the key $108K resistance, one of the most crucial levels for bulls to break.
A strong close above this zone could spark a rally toward $ 117,000. However, if rejected, we might see a pullback to $ 103,000.
I’m not touching futures just yet.
I’m okay with missing a few green days; I’d rather wait for clear momentum than get caught in this choppy price action.
Let me know what you think in the comments.
Thank you
#PEACE

BTC Preparing for Final Sweep Before Breakout?I’m currently waiting for a long opportunity on BTCUSDT. Price is consolidating in a range, and I believe we’re approaching the final support zone within this structure. The key area I’m watching is the 4H imbalance zone between ~102,968 and ~104,535, which also aligns with a strong structural support level.
I expect price to sweep this area, potentially triggering stop-losses below recent lows and then show a bullish reaction If confirmed, I’ll look to enter long targeting the liquidity resting around 108,762.
I’ll be watching closely for a reaction and confirmation

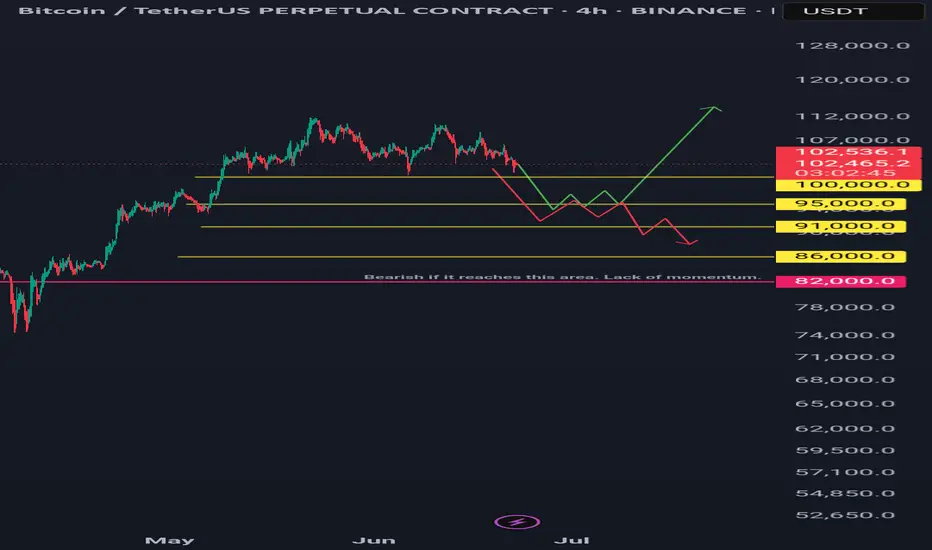
Btcusdt 4hr tf scenarios.Two scenarios: green and red lines.
Green Line: A bounce and sustained recovery above the 100-day and 200-day daily moving averages is bullish.
Red Line: A bounce followed by a lack of momentum and a break below a previous low is bearish.
Long Horizontal Red Line: If the price reaches this area, it could signal the start of a downtrend unless new bullish fundamentals emerge.
My Point of View (POV): I am bearish, primarily due to the ongoing war, similar to the conflict that began between two other countries a year ago.
However, it's important to note that every crisis and recession has historically presented a buying opportunity for institutions and 'whales.' Therefore, be prepared with funds for dollar-cost averaging (DCA), then simply hold and forget. It is recommended to conduct backtesting and research to identify optimal buying areas. DCA is key. Only invest money you can afford to lose.
long bitcoin from 106160ALL trading ideas have entry point + stop loss + take profit + Risk level.
hello Traders, here is the full analysis for this pair, let me know in the comment section below if you have any questions, the entry will be taken only if all rules of the strategies will be satisfied. I suggest you keep this pair on your watchlist and see if the rules of your strategy are satisfied. Please also refer to the Important Risk Notice linked below.
Disclaimer

BTC's Mid 2025 OutlookBitcoin is currently trading around $107,000 on the 4-hour 4H timeframe, navigating a consolidation phase following a sharp rally that culminated in a new all-time high of $111,900 in May 2025. Despite recent price corrections, BTC remains up 3% on the week, reflecting underlying bullish momentum. This sustained strength hints at continued confidence in the market, particularly among larger players.
A notable development supporting this view is the increase in the number of Bitcoin wallets holding at least 10 BTC, which has surged to a three-month high of 152,280. This metric is widely regarded as a proxy for whale activity and may indicate renewed institutional interest, especially amid accelerating inflows into spot Bitcoin ETFs.
On the 4H chart, Bitcoin appears to be consolidating within a tight range, hovering just beneath a key supply zone at $107,000, which could act as short-term resistance.
Several potential outcomes are currently in play:
Bullish scenario:
A breakout above the $107,000–$108,000 range could clear the path toward the critical resistance at $115,000. A successful move above this threshold would likely signal resumption of the broader uptrend, with some technical analysts eyeing a potential cup and handle formation that could project long-term targets up to \$180,000
Bearish scenario:
If BTC fails to hold above the current level, it may correct toward the first major support at $102,800, with further downside risk to $98,500. In a more pessimistic setup, price could extend losses toward $96,000, especially if macroeconomic or geopolitical pressures intensify
Key levels to watch:
Resistance: $107,000 - $115,000
Support: $102,800 - $98,500 - $96,000
Market Sentiment and External Drivers:
Bitcoin's price is being shaped not only by technical dynamics but also by powerful external forces
Spot Bitcoin ETFs:
The US regulatory greenlight for spot ETFs has dramatically altered market dynamics. With projections of $190 billion in assets under management AUM for these products by the end of 2025, institutional access to BTC has become more streamlined, providing strong tailwinds for long-term accumulation
Geopolitical risk and macro conditions:
Global uncertainty, particularly due to escalating tensions in the Middle East and potential US military involvement, has introduced volatility. At the same time, rising inflation and economic instability in developed markets is a double-edged sword, either undermining risk assets or conversely boosting Bitcoin’s narrative as digital gold and a hedge against fiat devaluation
Forward-Looking Outlook:
Bitcoin is at a critical juncture. The ability to sustain above $107,000 and reclaim the $115,000 resistance will be pivotal. A confirmed breakout could open the door to price discovery and possibly a surge toward $130,000 to $150,000, with $180,000 as an extended target in more bullish scenarios
However, a failure to hold key support levels could shift momentum toward the bears, prompting a deeper correction toward the $96,000 zone. Traders should monitor:
- Price reaction around $107,000 and $115,000
- ETF inflow data and AUM growth
- Macro news especially inflation reports and central bank commentary
- Developments in global conflict zones impacting risk appetite
Conclusion:
Bitcoin’s medium-term direction hinges on a delicate interplay of technical consolidation institutional flow and macro geopolitical signals. While the bullish structure remains intact for now a decisive move in either direction above $115,000 or below $98,000 could set the tone for the next major trend.

Bitcoin Faces Resistance Rejection — Bearish Divergence Signals Bitcoin is showing signs of exhaustion as it stalls near a high-timeframe resistance level aligned with the value area high (VAH). Recent price action has formed multiple lower timeframe bearish divergences while testing dynamic resistance. This level has now capped further upside attempts and could trigger a market rotation lower if rejected again.
With price consolidating directly beneath this barrier, the probability of a pullback grows stronger, especially if no bullish confirmation breaks the current ceiling.
Key Technical Points:
- Bearish Divergence Developing: Price is holding below the VAH with a weakening momentum signature
- Converging Resistance Zone: Dynamic SR and VAH are aligned at $108,350, now acting as a ceiling
- Range-Based Rotation Setup: If rejected, price could rotate down to the point of control and value area low
Bitcoin’s current structure is classic range behavior, with price gravitating from low to high and back. At the moment, it’s stalled at the value area high, which represents the upper boundary of the most recent range. This level — around $108,350 — has been tested several times, and now a bearish divergence is forming across key momentum indicators like RSI and MACD.
In addition, price is showing multiple rejections against dynamic resistance, forming a pattern of lower highs on lower timeframes. The longer this resistance zone holds, the more likely price will revert to the point of control (POC) — the area with the highest traded volume in the range. If that level doesn’t hold either, a full rotation to the value area low becomes the next probable scenario based on market auction theory.
This rotation would represent a complete cycle from value area high acceptance back to value area low rejection, which is common when buying pressure fades and sellers regain control. For now, Bitcoin remains technically vulnerable as long as price stays capped beneath the $108,350 level.
Bitcoin’s next move hinges on whether it can reclaim the $108,350 resistance zone with volume. If not, expect a corrective phase that targets the POC first, followed by potential continuation down to the value area low. This bearish setup remains valid until price closes decisively above current resistance.

BTC - High Probability Trade Idea Here we have a major resistance at this upper level. And market seems to create a "Double Top Patter". So its indicating a possible bearish move.
Target and Sl on chart. Follow risk and money management.
BINANCE:BTCUSDT BITSTAMP:BTCUSD BINANCE:BTCUSDT.P INDEX:BTCUSD BYBIT:BTCUSDT.P BINANCE:BTCUSD
