BTC HIGH DATA SHOW BREAKDOWN TO 85K FOR BITCOIN SOON.Bitcoin Market Update
BTC SEEMS TO ENTER A NEW CORRECTION PHASE SOON.
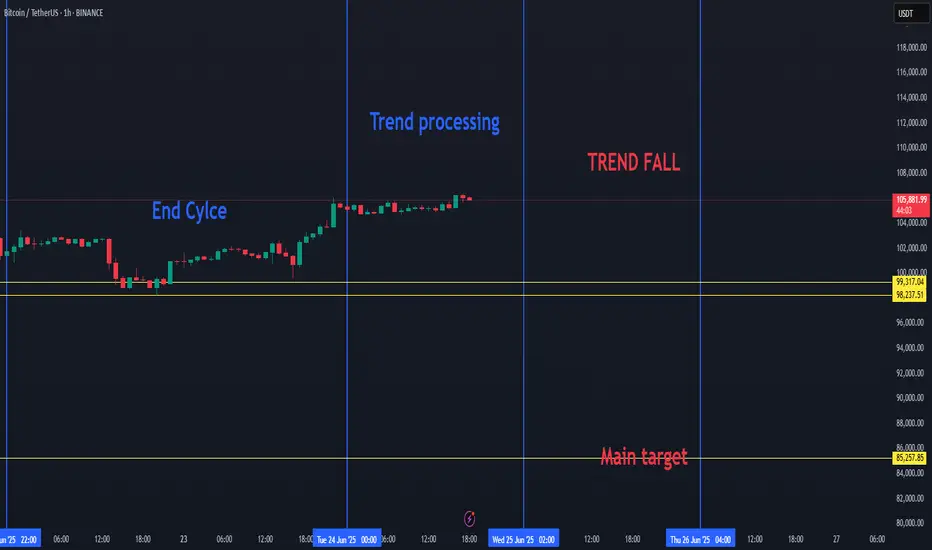
Recent data suggests that the current Bitcoin (BTC) cycle is coming to an end. As a result, we may soon see a downward move in BTC's price. The key target in this potential drop is around $85,000, with expectations that BTC will fall below $100,000.
This week, Bitcoin completed its cycle trend and is now entering a processing or transitional phase. Once this phase ends, we anticipate another decline in price.
This outlook is based on recurring patterns seen in previous BTC cycles, which have shown similar behavior in the past.
BTC can play on the low time frame with uptrends and downtrends, but if we will choice a side, then it will be the red trend.. since BTC cycle is ending.
USTBTC trade ideas
The Critical Blue Line – Will Bitcoin Soar or Sink
🔹 Bitcoin Technical Analysis – Key Blue Line, Bear Trap Possibility & Long-Term Scenario
On the Bitcoin chart, the blue horizontal level has acted multiple times as both support and resistance. The price has broken it several times but failed to sustain above, indicating high-volume decision-making zones by institutions and large players.
📉 Why this pattern keeps repeating:
Strong supply and demand concentration at this level.
Inability to break and hold shows market indecision.
Repeated fakeouts are likely used to shake out weak hands.
🔍 Important hidden scenario: Bear Trap Potential
If the price dips below the blue line but quickly reclaims it, it may form a bear trap, tricking short sellers into entering prematurely. This move could ignite strong bullish momentum from trapped sellers and renewed buyers.
🔮 If price holds above the blue line:
Signals market strength and potential bullish structure shift.
Targets:
109,800
117,200
120,000+ (Long-term)
📛 If support fails again:
Retracement toward the lower channel near 101,000 or lower is possible.
📊 Conclusion:
This zone is one of the most critical decision points in the current market. Traders should combine volume, candlestick behavior, and confirmation signals to avoid getting trapped by fake breaks

Bitcoin (BTC): Still Hovering Near ATH | Seems WeakeningBitcoin is still hovering near the local ATH area, where sellers and buyers are fighting over the zone there.
There is nothing clear yet so we keep on monitoring, but we are seeing smaller signs of weakness, which indicate upcoming volatile movement as we are approaching the end of the month.
Now we will keep an eye on how sharp the monthly opening will be and based on that, we will trade. Our attentions are still at $120K for now.
Swallow Academy

Example of how to draw a trend line using the StochRSI indicator
Hello, traders.
If you "Follow", you can always get new information quickly.
Have a nice day today.
-------------------------------------
We use the StochRSI indicator to draw a trend line.
We draw a trend line by connecting the peaks of the StochRSI indicator, i.e. the K line, when they are created in the overbought area or when they are created in the overbought area.
That is, when the K line of the StochRSI indicator forms a peak in the overbought area, the trend line is drawn by connecting the Open values of the falling candles.
If the candle corresponding to the peak of the StochRSI indicator is a rising candle, move to the right and use the Open value of the first falling candle.
When drawing the first trend line, draw it from the latest candle.
Since the third trend line indicates a new trend, do not draw anything after the third trend line.
The currently drawn trend line corresponds to the high-point trend line.
-
Therefore, you should also draw the low-point trend line.
The low-point trend line is drawn by connecting the K line of the StochRSI indicator when the top is formed in the oversold zone.
The low-point trend line uses the low value of the candle when the K line of the StochRSI indicator forms the top in the oversold zone.
That is, it doesn't matter whether the candle is a bearish candle or a bullish candle.
The drawing method is the same as when drawing the high-point trend line, drawing from the latest candle.
The top of the best K line of the StochRSI indicator was not formed within the oversold zone.
(The top is indicated by the section marked with a circle.)
Since the trend line was not formed, the principle is not to draw it.
If you want to draw it and see it, it is better to display it differently from the existing trend line so that it is intuitively different from the existing trend line.
-
The chart below is a chart that displays the trend line drawn separately above as a whole.
It is also good to distinguish which trend line it is by changing the color of the high-point trend line and the low-point trend line.
The chart below is a chart that distinguishes the high-point trend line in blue (#5b9cf6) and the low-point trend line in light green (#00ff00).
The low-point trend line is a line drawn when the trend has changed, so it does not have much meaning, but it still provides good information for calculating the volatility period.
-
To calculate the volatility period, support and resistance points drawn on the 1M, 1W, and 1D charts are required.
However, since I am currently explaining how to draw a trend line, it is only drawn on the 1M chart.
-
I use the indicators used in my chart to indicate support and resistance points.
That is, I use the DOM(60), DOM(-60), HA-Low, HA-High, and OBV indicators to indicate support and resistance points.
Since the DOM(-60) and HA-Low indicators are not displayed on the 1M chart, I have shown the 1W chart as an example.
The indicators displayed up to the current candle correspond to the main support and resistance points.
Although it is not displayed up to the current candle, the point where the horizontal line is long is drawn as the sub-support and resistance point.
It is recommended to mark them separately to distinguish the main support and resistance point and the sub-support and resistance point.
The trend line drawn in this way and the support and resistance points are correlated on the 1D chart and the volatility period is calculated.
(For example, it was drawn on the 1M chart.)
The sections marked as circles are the points that serve as the basis for calculating the volatility period.
That is,
- The point where multiple trend lines intersect
- The point where the trend line and the support and resistance points intersect
Select the point that satisfies the above cases at the same time to display the volatility period.
When the point of calculating the volatility period is ambiguous, move to the left and select the first candle.
This is because it is meaningless to display it after the volatility period has passed.
If possible, the more points that are satisfied at the same time, the stronger the volatility period.
If the K-line peak of the StochRSI indicator is formed outside the overbought or oversold zone, it is better to exclude it when calculating the volatility period.
-
The chart below is a chart drawn on a 1D chart by summarizing the above contents.
The reason why there are so many lines is because of this reason.
For those who are not familiar with my charts, I have been simplifying the charts as much as possible these days.
However, when explaining, I have shown all the indicators to help you understand the explanation.
-
Thank you for reading to the end.
I hope you have a successful trade.
--------------------------------------------------

BTC 30.06.25So far BTC is behaving exactly as expected, i'm just waiting for a valid setup to appear. I would love to see a model 1, which takes out the high and mitigates supply, but i'm also not ignoring a potential model 2. These 2 deviations merge together on a higher time frame, where the range is also valid on, so they can be counted as one. There are many altcoins with similar behavior and USDT/C in potential accumulation. I'm waiting to see confirmations/ invalidations.
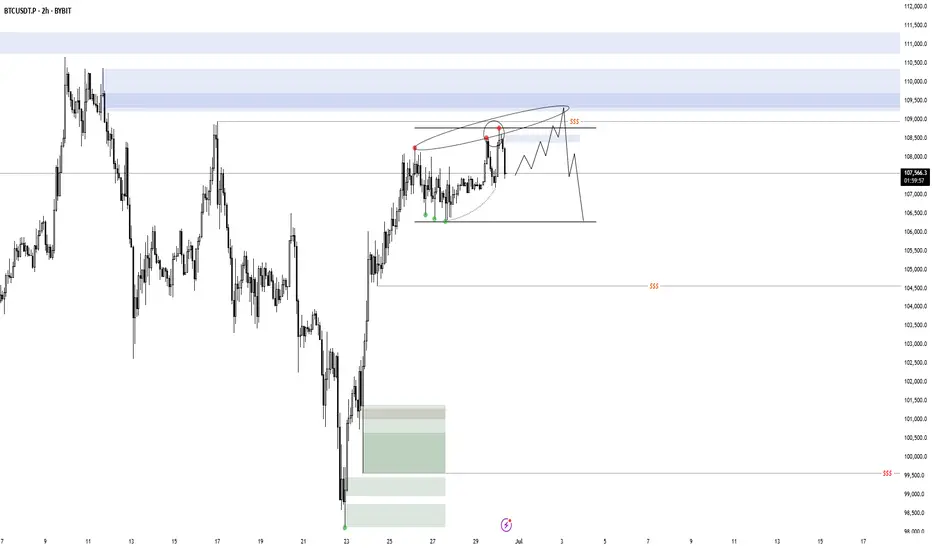
BTC/USDT – 4H Liquidity Sweep Likely Before Bullish ReactionBitcoin is showing signs of distribution within a daily FVG range. The recent failure to break above 107,000 with strength suggests a sweep of downside liquidity is likely.
🧩 Key Observations:
• Price is still respecting the daily FVG above (imbalance not fully filled).
• A visible liquidity pool is sitting below recent 4H lows near 104,000.
• Confluence with 4H support zone and lower daily FVG around 102,000.
🎯 What I Expect:
• Price to sweep 4H liquidity → tag 104K area
• Possible wick or reaction from there
• If momentum increases, price could tap into the deeper imbalance around 102K
📌 Setup Bias:
Short-term bearish (targeting liquidity grab), then reassessing for long setups near support + FVG convergence.
🧠 This setup is built on smart money principles — liquidity engineering, fair value gap fills, and mitigation.
⸻
Key Levels:
• 🔴 Resistance: 107,000–108,000 (Daily FVG top)
• ⚫ Target Zone: 104,000 (Liquidity + 4H support)
• 🟣 Potential Bounce Zone: 102,000 (Lower Daily FVG)

Short to 86KIt really wants to go up to 110,000 and then drops to 86,000.
So it's better to think about selling at higher levels than buying.

btc my weekly analysis for the btc move insha allah btc shows as big opportunity dirrection toward sell or bear position at the price of 99k
BTCUSDT Trade SetupBTC Still in sideways no major move, wait for the entries. While on weekly tf still expecting a final shakeout, 95-93k then a final leg up towards to 120k. For now wait for the entries to be filled first then must use sl.

BTCUSDT Analysis – Bullish Focus Amid ConsolidationBTCUSDT Analysis – Bullish Focus Amid Consolidation
Bitcoin is currently mirroring the broader market sentiment, particularly tracking the S&P 500. After a false breakout above the psychological 100K level, BTC entered a distribution phase, followed by a consolidation range. This indicates a potential accumulation before a bullish continuation, although resistance levels remain key hurdles.
False Breakout at 100K: A failed breakout attempt triggered a sharp reversal, signalling short-term weakness. Price rolled back and found temporary support around 106,200, pausing further downside The pair is consolidating within a tight range, indicating a possible setup for a renewed bullish push.
Outlook: Despite the resistance cascade, BTC remains in a bullish structural zone as long as it holds above 106,000. A clean breakout above 108,500–110,000 could open the path back toward 114,000–117,000. However, failure to break may result in a deeper pullback towards 104,000–102,500.
Ps Support with like and comments for more analysis Thanks for supporting.

BTCUSDT at Best Resistance !!This is the Daily chart of Bitcoin .
BTCUSDT is trading near it Resistance Zone 108,600 - 107,400.
If this level is sustain , then we may see lower prices in BTCUSDT.
Thank You !!

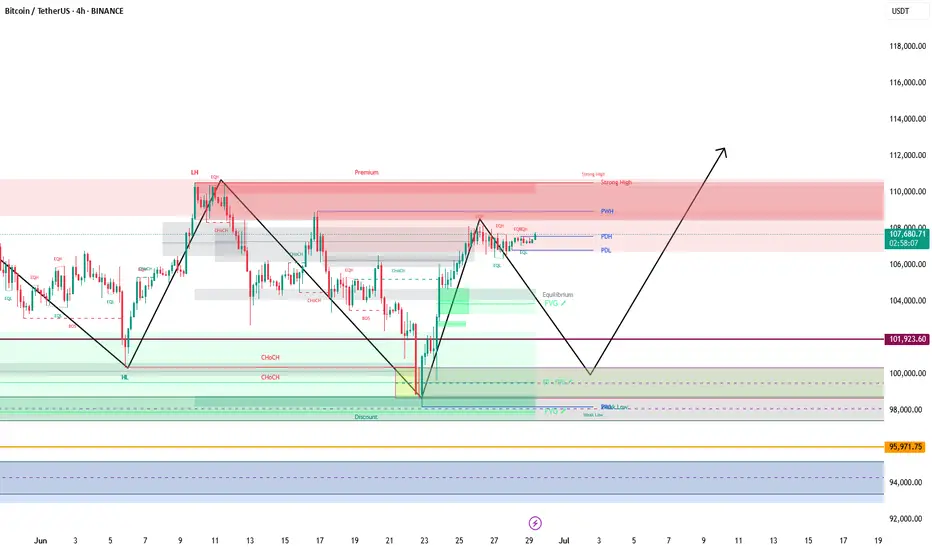
Bitcoin (BTC/USDT) – 4H Analysis UpdateBTC is currently holding above the key resistance-turned-support zone of $106,057, after a clean breakout from the symmetrical triangle last week. Price is consolidating just below $107,000, signaling a potential pause or minor pullback before the next leg.
Technical Overview:
Trendline support from May is intact
$106K zone flipped into support — critical for bulls to hold
Price action is compressing under resistance at $107,000
Holding here may lead to a retest of $108,895, then $111,785
Key Levels to Watch:
Support:
$106,057 – Immediate support
$101,409 – Mid-range demand zone
$98,898 – Rising trendline
$93,343 – Strong base zone
Resistance:
$107,000 – Minor resistance
$108,895 – Major resistance
$111,785 – Upper breakout target
Outlook:
Bulls need to defend the $106K zone to maintain momentum. Failure to do so could cause the price to pull back toward $101K. On the flip side, strong volume above $108900 may trigger a rally toward $111K+.
DYOR | Not Financial Advice

Bitcoin Mirror Cycle: History Repeats? | 2024–2025 PatternThis chart presents a potential repetition of Bitcoin’s 2024 price cycle (Jan 23 – Aug 5, 2024), projected to mirror itself from September 6, 2024 through Q3–Q4 2025. The hand-drawn arcs suggest a repeating pattern of rounded tops, distribution, correction, and potential accumulation zones. Key support levels are marked near $66,172 and $49,116, indicating where price may retrace before a potential bounce or deeper macro-driven selloff.
Technically, the chart hints at a large-scale cyclical structure—a classic market psychology pattern where prior cup-and-handle or double-top formations play out again on a broader timescale.
🌍 Global Context Overlay:
War & Geopolitical Tensions:
The ongoing risk of conflict escalation (e.g., Iran–Israel, Ukraine–Russia, and potential East Asian tensions) may lead to increased volatility in risk assets like crypto. Wars historically bring uncertainty, which may initially crash speculative markets but later fuel inflationary hedges like Bitcoin.
U.S. Elections (Nov 2024):
Political instability or leadership changes can impact Federal Reserve policy, regulation, and market sentiment, directly influencing BTC price direction post-election.
Recession Fears & Rate Cuts (2025):
With central banks expected to pivot towards rate cuts in 2025, liquidity could flow back into risk-on assets, possibly triggering the bounce scenario shown in the latter part of your drawing. If rate cuts come too late, however, a steeper correction into the $49K zone becomes more likely.
Global Debt Crisis & De-Dollarization:
Growing debt concerns and countries moving away from the USD may boost Bitcoin’s long-term appeal as a non-sovereign store of value, reinforcing the second rally illustrated in your sketch.

BTC on Close Compression -110k?Not now, but looks like will test 107,800 again from the point, what say?

SatochiTrader Expecting a huge BTC CRASH AFTER This..BTC Market Update by SatochiTrader
EVERY CRASH DID START WITH A FALSE INCREASE TREND.
Depending on the market sentiment and price action, BTC is currently showing strength with a positive trend. However, based on deeper data and insights held by myself and a small group of early-cycle followers, this current movement may be a deceptive signal — potentially foreshadowing a major crash.
This is not trading advice. Those who are confident in the long position should continue, and those on the other side should stay prepared as well.
We have previously explained that the current cycle appears to have ended. Since 2013, BTC has consistently respected its macro cycle targets. The end of such a cycle typically leads to significant corrections.
A cycle ending implies not just a retracement, but the potential for a major crash. Hedge funds and real BTC whales understand the underlying indicators and risks at play. Our expectation remains clear: BTC may soon fall below the 100K level, with $85K identified as a critical support and target zone.
Stay sharp. Stay informed. The market may look bullish — until it isn't.
The best way to follow BTC is not the news.. but the cycle overview.
This update is an education update, which means the high expectations of the upcoming correction for BTC.
Compared to last quarter, miners are now less severely underpaid, though profitability remains low

Do you think I'm joking ???Chart is speaking itself...AB=CD.
previous analysis
Give me some energy !!
✨We spend hours finding potential opportunities and writing useful ideas, we would be happy if you support us.
Best regards CobraVanguard.💚

Bitcoin Bounced Right Where It ShouldBitcoin continues to respect the script — breakout, clean retest, and now holding strong.
The 50 EMA has been a reliable dynamic support throughout the entire uptrend, and once again, it helped catch the recent dip. Price has now successfully retested the breakout zone and is starting to bounce.
Structure looks healthy, momentum is building, and unless the support fails, the next leg up could be just around the corner.
Simple setups. No noise. Just trend.
DYOR, NFA

BTC buying power is gradually increasing💎 Update Plan BTC at the beginning of the week (June 30)
Notable news about BTC:
Anthony Pompliano has merged Procap BTC with Columbus Circle Capital I, established Procap Financial - a Bitcoin warehouse company up to $ 1 billion. The company will deploy lending activities, derivatives ... in order to create a collection line from BTC, according to the similar model
Bitcoin price is stable at about $ 107.4K on June 27, before the expiry date of options worth up to US $ 40 billion, capable of causing strong fluctuations. At the same time, on June 29, BTC exceeded $ 108k, up ~ 0.68% compared to the previous day
In the past 7 days, BTC maintained around $ 104–107K despite tensions in the Middle East and the US economic data is not heterogeneous. Reduce slightly but receive support from organized cash flow and global trade progress.
Technical analysis angle
Overview of trends - many signs of increasing
Looking at the candle is signaling "Strong Buy" on many time frames, especially healthy momentum, the ability to breakout $ 116k if surpassed the $ 110k resistance
ETF liquidity and organizational capital flows are supporting the trend of increasing, strengthening the possibility of breakthrough.
Moving Averages:
Frame 1H: 64% Bullish signal (MA20 reversed), but there is a neutral signal from short -term ghosts
Daily/Weekly: Golden Cross (Golden Cross) between 50‑ and 200‑ MA, is a long -term trend increase signal
Oscillators:
RSI frame Daily ~ 55, showing neutral momentum, not too much purchased but there is a rise. Double Rounded Top model on the chart Daily, the current trend is neutral - Bearish if the breakdown supports Neckline ~ $ 106k; In contrast, strong recovery above $ 114k will invalid this model
Long -term / Swing Trade: Keep the position if the price is maintained> $ 106k, use $ 103–104K as a spare hole stop.
Short -term / Scalp Trade: can be in order when the test price is $ 106k–107k, small latches around $ 110k.
==> Comments for trend reference. Wishing investors successfully trading

BTC UP OR NO📈 Bitcoin to Reach $113K, With a Breakout Path to $120K – A Professional Outlook
After analyzing the macro trend, technical structure, market sentiment, and on-chain behavior, I strongly believe that Bitcoin is on a clear trajectory toward $113,000, with a potential extension to $120,000 if key resistance is broken.
---
🔍 1. Technical Analysis Perspective
Macro Bullish Structure: Since the 2022 bear market bottom, Bitcoin has maintained a consistent higher highs and higher lows pattern, confirming a long-term uptrend.
Fibonacci Extension: The 1.618 Fibonacci extension from the $15.5K bottom to the $69K peak gives a projected target of around $113K.
Historical Fractal Patterns: In previous cycles, Bitcoin has always broken past previous all-time highs by 1.5x to 1.75x, placing this cycle's peak in the $110K–$120K range.
Ascending Triangle Breakout: On the weekly chart, BTC is forming a bullish ascending triangle with the top resistance at ~$73K. A confirmed breakout targets $113K as the next major supply zone.
---
🧠 2. Market Psychology & Cycle Timing
Halving Effect: Historically, Bitcoin peaks occur 9–12 months post-halving. The most recent halving was in April 2024, aligning a potential peak by Q1 or Q2 of 2025.
Psychological Resistance Zones: The $100K–$113K range is not only a Fibonacci target but also a powerful psychological barrier. Once breached, FOMO and institutional momentum could push BTC rapidly to $120K.
Retail vs Institutional Flows: Data shows increased ETF inflows and long-term holder accumulation — a classic pre-peak indicator.
---
🔗 3. On-Chain and Whale Behavior
Realized Price vs Market Price: BTC market price is well above long-term holder realized price, signaling bull market phase 2 (the steep climb).
Dormant Supply: Over 70% of BTC has not moved in 6+ months, showing strong holder conviction. This reduces sell pressure as price increases.
Whale Accumulation Zones: Whales are heavily positioned around $60K–$65K, and there is minimal sell volume above $100K on major exchanges, opening the path to $113K with low resistance.
---
🚀 Conclusion:
> Based on comprehensive technical patterns, market structure, psychological phases, and on-chain behavior, Bitcoin is highly likely to reach $113,000.
If momentum continues and $113K is breached with volume confirmation, a sharp move toward $120,000 becomes not only possible — but likely.

Bitcoin Long Now ! Details chart ! 89% Accuracy VIP Signal !🟢 BTCUSDT Long Setup | 15min (BINANCE)
Entry: ~108840 zone
Stop Loss: Below 108192.82
Take Profits:
TP1: 109488.98
TP2: 110149.67
TP3: 110855.75
Reasoning:
Liquidity grab below support.
Bullish rejection and structure shift.
Potential W pattern forming.
Clean RR and price action setup.
Trade Plan:
Expecting price to break above 109488.98, retest it, and then push toward 110855.75.
📊 Classic support rejection + market structure shift play.
🔔 Not financial advice. Manage your risk!
#BTC #BTCUSDT #Crypto #TradingView #PriceAction #LongSetup #Binance #TA

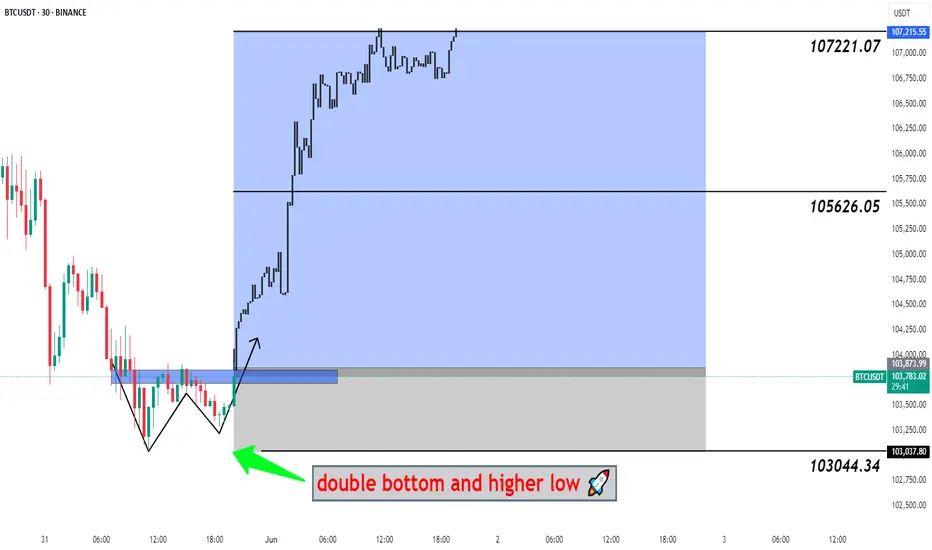
#BTCUSDT Big Pump Next Hour - Bitcoin, BTCUSD, BTCUSDT 📉 Double Bottom Pattern Forming – Potential Reversal Setup
The current price structure is showing signs of a Double Bottom – a classic bullish reversal pattern. After an extended downtrend, this pattern suggests that the market may be preparing for a trend reversal from this key demand zone.
🔹 Trade Setup
Entry, Targets, and Stop Loss (SL) are marked on the chart.
Entry: Upon breakout confirmation above the neckline.
Stop Loss: Just below the recent swing low to manage downside risk.
Targets: Calculated using the measured move method from the bottom to the neckline .
🔹 Risk & Money Management (Professional Approach)
To maintain consistent profitability and protect capital, strict risk management is essential. For this setup:
🔸 Position Sizing: Based on a fixed % of total capital (typically 1–2% of account equity per trade).
🔸 Risk-to-Reward Ratio: Minimum of 1:2, ideally higher.
🔸 Stop Loss Discipline: No arbitrary changes after entry. SL only adjusted for breakeven or trailing stops once price moves favorably.
🔸 Trade Management: Secure partial profits at key levels, trail stops as structure forms.
🔸 Capital Allocation: Avoid overexposure. Trade fits within overall portfolio strategy.
💬 Let the setup come to you. React, don’t predict.
🔁 Like, comment, or share your thoughts below!
BINANCE:BTCUSDT BITSTAMP:BTCUSD COINBASE:BTCUSD BINANCE:BTCUSDT.P INDEX:BTCUSD CRYPTOCAP:BTC.D CRYPTO:BTCUSD BYBIT:BTCUSDT.P BINANCE:BTCUSD
Bitcoin Weekly & $120,000This weekly Bitcoin chart says it all... Please, allow me to reveal to you what the future holds!
Good evening my fellow Cryptocurrency trader, what a wonderful day.
Only one week ever produced a higher close than the current price. Only once, 19-May, Bitcoin managed to close above $107,000... What happens if Bitcoin closes above $107,000? New all-time high confirmed.
Two days remain for the week to close and we—the bulls—only need to maintain a price of $107,000 or higher to send such a strong bullish signal that everybody will come out and start buying.
The next target on this timeframe is $120,000.
Bitcoin is using EMA13 as support. This level was tested and holds, the same for EMA8. When Bitcoin moved above these levels in April, it produced an advance from $83,000 to $112,000, more than 33%. The price now is $107,000 but instead of recovering from below EMA8/13, BTCUSDT is trading above; this means that the bullish bias is fully confirmed.
The weekly timeframe looks great. We can expect higher prices soon, with growth happening for an extended period of time. Bitcoin is very strong now and this is only the start.
I will continue to share proof that shows the entire Cryptocurrency market going up.
Thank you for reading.
Leave a comment with your questions.
Thanks a lot for your support.
Namaste.

As simple as it gets - Short then longDescending channel, posible scalping trades ahead before support confirmation at 98,000-100,000. Once confirmed, I would expect a nice bullish swing towards breakout. What do you all think?
