PSYCHOLOGY OF A CRYPTO CYCLEWe expected a pullback, and now thats behind us!😅
The market is back on track, and we are firmly in the #Belief phase of the bull cycle.
With heavy short liquidity stacked around $110K, a push into that zone could trigger a short squeeze, launching us into the #Thrill phase.
And if momentum holds, all signs point to #Euphoria by late 2025.
Favorites so far this cycle:
🥑 POLONIEX:GUACUSDT 🔗 POLONIEX:LLUSDT 🎮 KUCOIN:MYRIAUSDT
🌐 HTX:SYNTUSDT 🧪 MEXC:DEAIUSDT 🏠 OKX:PRCLUSDT
🧱 MEXC:YBRUSDT ⛏️ MEXC:KLSUSDT 🧩 $RUJIUSDT
Comment below your favorite coins!
USTBTC trade ideas

BTC - Is it time to 105 - 102k?Just wait and watch, as said it went what i said, Will explain more, but it would take more longs with it and eventually bonk it down, wreckage intensity would be said soon

Bitcoin (BTC): Aiming For $104,000 Before Next Bullish MoveWe are getting ready for another upward movement on Bitcoin, which we have marked as an area near $104K.
Ideal zone slightly below EMA where the order book has shown a decent amount of orders just sitting. This is the zone we will be looking for any kind of MSB to form with a proper breakout, which then would lead the price back to upper zones!
Swallow Academy

BTC\USD SHORT TRADE SETUP BTC/USDT – Short Trade Setup Breakdown (Technical Outlook
Trade Thesis
The area between 103,800–105,000 serves as a strong supply zone, and we’re seeing signs of exhaustion in bullish momentum. The setup suggests a high-probability short opportunity with tight confirmation.
🔸 Entry: Positioned at 103,800, just below resistance, to capture early weakness and avoid chasing.
🔸 Risk Level: The resistance at 105,000 is critical — any break and close above may invalidate this setup.
🔸 Targets:
🎯 Target 1: 97,000 – conservative exit at mid-range demand zone
🎯 Target 2: 96,000 – full target near bottom of the descending channel

Bitcoin may reach resistance level and then start to declineHello traders, I want share with you my opinion about Bitcoin. Previously, the price was trading inside a well-defined downward channel, repeatedly rebounding from both the support and resistance lines. Each upward move got rejected within the seller zone, especially around the 108500 - 109200 range, which acted as a strong barrier multiple times. Later, BTC dropped to the buyer zone near 102700 - 102000, and from there, we saw a strong impulse up. This impulse broke through the channel resistance line and the support area, indicating a short-term bullish breakout. At the moment, the price is approaching the resistance level at 108500, which previously served as a turning point. Given that this area also aligns with the upper boundary of the seller zone, I believe we may see another reversal from this level. In my opinion, after reaching resistance, BTC may start a new downward wave, targeting the 102700 support level. This is where I’ve set my TP 1. Considering the recent breakout, the historical significance of the resistance, and the strong reaction from seller zones, I remain bearish in the short term and expect a potential decline toward support. Please share this idea with your friends and click Boost 🚀
Disclaimer: As part of ThinkMarkets’ Influencer Program, I am sponsored to share and publish their charts in my analysis.

$BTC Consolidating Before the Next Big Move?CRYPTOCAP:BTC consolidating after a strong bounce!
Bitcoin is holding well above the 106K support zone and forming a tight range just below resistance.
After a false breakout above 100K, the price is compressing just below key resistance at 108100.
This consolidation between 106500 and 108100 looks like a pause, not a top.
If BTC breaks 108100, the next targets are 110500 and ATH.
Market structure is still bullish.
A retest of 106500–105650 is possible before liftoff.
Are you positioned for the breakout?
If you find my updates helpful, don’t forget to like and follow for more!
DYOR, NFA
#BitcoinRecovery

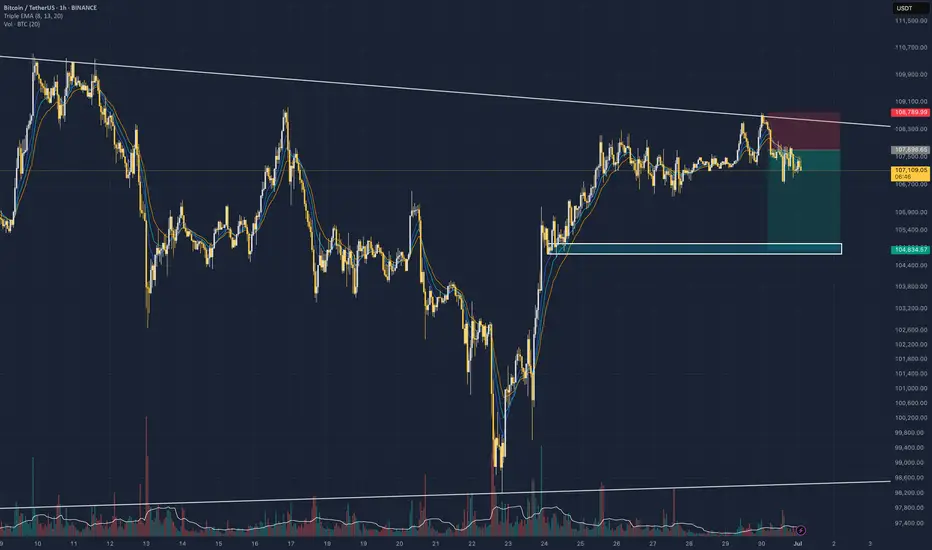
Bitcoin (BTCUSDT) Market Update – DailyBitcoin remains in a tight range between $110,221.73 (resistance) and $101,546.27 (support). These two levels are the main reference points for initiating high-probability trades.
🔸 Market Context:
The primary trend is bullish, so the priority remains on long setups.
Short positions should only be considered below $101,546.27 with confirmation.
With the prevailing bullish structure, early entries can be taken with a low-risk trigger at $108,746.08.
🔸 Moving Averages & Momentum:
The SMA 7 has caught up with the daily candles, but we haven’t seen a strong reaction yet.
If today's candle wicks above the SMA 7, we can more confidently pursue long setups starting tomorrow.
Otherwise, we may see a pullback toward the SMA 25, especially given the decreasing volume typical of ranging phases.
🔸 Lower Timeframe Setup (1H/4H):
A micro range box can be observed between $108,746 and $106,649.78.
If price approaches $108,746 with increasing volume, that can serve as a valid long trigger on intraday timeframes.
⏳ Final Note: Patience is key while BTC trades inside this range. The bullish structure remains intact, and opportunities for long trades are more favorable for now. Wait for clean breakouts or volume-based confirmations before entering new trades.
#BTCUSDT #BitcoinAnalysis #CryptoUpdate #BTCPrice #CryptoStrategy #BitcoinRange #LongSetup #TechnicalAnalysis #TradingView

BTC Short Swing Ideaswill be shot on bearish mode to btc with simple indicator, sign on major rejection trend within hourly timeframe and will targeting the next possible retracement at nearest support box. DYOR.
BTC/USDT – Trade Review & New Plan (15m, Ichimoku) by RiscoraYesterday’s short setup didn’t work out as planned — stop-loss was hit as bulls showed strong momentum. However, I still believe that a move to the yellow block (downside liquidity zone) is possible, and the idea remains valid.
The main mistake was with the stop placement, not the scenario itself. After taking a loss, I’m more cautious: reducing risk, lowering position size, and entering with less conviction. Bulls were dominant yesterday, so I’m keeping my risk tight on this trade.
I’ll take the setup again, but with a more conservative approach. If price breaks and holds above my stop-loss level, it will confirm a shift in sentiment to bullish, and I’ll look to flip my bias accordingly.
Key points:
Previous short was stopped out — reviewing risk
Still see potential for a move to the yellow block
Lower risk, smaller size after a loss
If price holds above stop, trend flips bullish
Let’s see how this plays out.
#BTC #Crypto #Trading #Ichimoku #Riscora
BTC/USD Multi-Timeframe Analysis – 1H & 5m🕐 1-Hour Overview:
BTC is currently consolidating inside a range-bound structure, showing signs of indecision.
Resistance Zone: $105,000 – $106,000
Support Zone: $100,000 – $101,000
The price must break out of this box to define the next major direction.
➡️ A bullish breakout above 106K could lead to $108K+
⬅️ A breakdown below 100K may trigger downside momentum.
⏱ 5-Minute Execution Zone:
The 5m chart shows a rebound from an oversold move, forming higher lows and approaching key resistance.
Minor Resistance: $107,000
Key Breakout Level: $107,400
🎯 Trading Scenario:
If we get a strong bullish candle closing above $107,400
Then: Entry Long with target near $108,000
Stop Loss: Below recent 5m low – around $106,800
✅ Strategy Context:
Timeframe alignment between HTF and LTF
Scalp entry with confirmation
Risk managed around structural zones
🔗 Powered by ALIP FX
📌 Follow for more ideas, and smart scalping setups
#Bitcoin #BTCUSD #Scalping #PriceAction #ALIPFX

BTC limit BIDPlacing bids at the Key S/R level and targeting buy side liquidity and stops at the bearish structure
reason for the limit setup is liquidity wicks around the 106500-106400 and market makers will try to take that liquidity after monthly open or daily open

BTC - Bullish SOON!Hello TradingView Family / Fellow Traders. This is Richard, also known as theSignalyst.
BTC has been in a correction phase, and it feels like it's taking forever! ⏳
As long as the blue trendline holds, the overall bias remains bullish. 📈
As BTC approaches the blue trendline—perfectly aligning with a demand zone and support—we'll be watching for trend-following longs to catch the next big impulse move upward. 🚀
For now, we wait! ⏳
📚 Always follow your trading plan regarding entry, risk management, and trade management.
Good luck!
All Strategies Are Good; If Managed Properly!
~Rich

Bitcoin will no longer update ATH, and here's why⚡️ Hello, everyone! I decided to update my idea about Bitcoin. Let's see what awaits us!
Bitcoin rebounded strongly over the weekend and is now trying to consolidate at the $107,000 level. This is a key level, which is the MSB level for the entire current momentum since May, and as long as the price remains below it, it is a bearish movement.
Last week, we also closed the GAP to the $98,000 level from the previous movement, but on the way up, we formed a new one at $105,250 - 101,360. And as we know, 99% of GAPs close sooner or later.
📉 Bitcoin also continues to move in a descending flag, which, although it is a bullish pattern in an upward impulse and more often breaks through upwards, has not been working that way for a long time. Trading based on technical analysis is the basis of crypto and has become very widespread, which is actively used by many whales and counterplayers. As a result, many pattern signals have long lost their relevance and now often give false signals.
⚙️ Metrics and indicators:
Volume - divergence with price since the end of April. Throughout this upward momentum, purchase volumes continued to decline. This indicates a lack of liquidity and demand for Bitcoin at present.
Money Flow - also divergence with price. Also, since the end of April, positions have continued to close and liquidity has continued to decline. This indicates a lack of interest in the asset.
Liquidity Depth - we know that the price moves from liquidity to liquidity, which serves as its fuel. And now there is much more liquidity at the bottom than at the top.
Support/Resistance - Based on the volume of interest, it is clear that the $106,000 level is a major zone, and if it is lost, the nearest support level will only be at $103,004, but with significantly lower volumes.
📌 Conclusion:
Despite all the huge inflows into ETFs, there is now even less liquidity in Bitcoin than in November 2024, when Trump became president.
This suggests that everyone is actively closing their positions and there is no new money coming in. Search queries for the tags “crypto” and “bitcoin” are not even close to last year's levels, let alone 2021 levels. This means that there is no new retail interest in crypto right now.
I don't see any catalysts right now that could keep the price at this level. And ETFs are not an indicator at all; we've already seen how these “smart money” buyers bought at 110k on ATH and sold even more at 70k.
🔥 So, right now, I recommend sitting back and watching. Let the market sort itself out and indicate the direction of movement going forward.

Weekly trading plan for BitcoinLast week price action showed a local correction before reaching the first target. This week, we may see a deeper pullback before the next targets are hit and ATH is revisited. In this idea I marked the important levels for this week
Write a comment with your coins & hit the like button and I will make an analysis for you
The author's opinion may differ from yours,
Consider your risks.
Wish you successful trades ! mura

Bitcoin, The Next High Is The All-Time HighThe title might be a bit misleading but, the truth is that Bitcoin stays bullish short-term and this is bullish on all terms...
Good afternoon my fellow Cryptocurrency trader, how are you feeling today?
Any day, any week, any moment; every month, place or year, the market provides everything we need to know. This information is made available to us through the chart.
Bullish Bitcoin
The present signal is the fact that Bitcoin remains very high, challenging resistance, after a strong recovery and advance. This is happening with the altcoins also.
If you look at the last two peaks, as soon as resistance was hit there was an immediate crash. The next day was full red; very strong bearish action and momentum and this led to a new low. The situation is not the same today.
22-May peak. 23-May, strong bearish action.
9-June peak. 11-June, strong bearish action.
26-June lower high (not a peak). Today, neutral action. This neutral action is what I am taking as a bullish signal. Many other factors of course support this conclusion yet, this is still an early signal.
Fib support
A closer view of the daily timeframe:
4H. The grey line represents Fib. retracement. Dark blue—Fib. extension:
Conclusion
Each time there is a price peak a retrace follows, if there is no retrace then you are not witnessing a peak but rather a stop, a pause; resistance being met.
It seems that the current lower high is not the end but rather just a pause before additional growth. Market conditions can change.
It can happen that several days Bitcoin goes sideways with the bulls failing to garner enough strength. In this scenario, there would be a move lower before additional growth.
The present scenario shows a bullish chart even if prices drop, remember, the market is in no hurry.
Easy money
In September we will have lower interest rates and this is a bullish development for Bitcoin. Advanced money minds see easy money as inflationary for the currency, while Bitcoin is inflation-proof. So the dollar goes down and Bitcoin goes up.
I didn't quite develop this point, next time I'll do a better job.
Summary
The market is good even if it shakes. The market is good and isn't shaking, the recovery is already in place.
Bitcoin's price is very strong and there are many layers of support. The altcoins are in a similar situation, growing from the bottom up.
The Fed will reduce interest rates in September and then once more before the year ends, this is bullish for everything so, everything will be going up, at least everything that we are interested in, support and trade.
Thanks a lot for your continued support.
Never give up!
You are divine! You are blessed.
If you are reading this now, you will be blessed for your great timing. Hard work and dedication always pays.
Keep moving forward, keep pushing forward, never give up.
When life hits you hard, do take a break if you need it, only to comeback with new energy, a new mind and an infinite drive to achieve your goals.
You are the reason why Bitcoin exist... You are the lifeblood of the market.
Without you, nothing is possible. It is because of you that we all continue to grow.
Thanks again for taking the time to read.
I appreciate your support.
Namaste.

BTC Efforts to break the trend to create a new ATHPlan BTC today: 30 June 2025
Related Information:!!!
As of Monday, Bitcoin (BTC) is trading around $108,500, approximately 3% below its all-time high. Ethereum (ETH) has closed above a key resistance level, indicating the potential for a sustained upward movement. Meanwhile, Ripple (XRP) is approaching a critical threshold; a confirmed breakout could strengthen bullish momentum in the near term.
Bitcoin approaches record highs
The price of Bitcoin surged by 7.32% last week, closing above the $108,000 mark. As of the latest update on Monday, it remains near $108,500.
Should the current upward trend persist, BTC may extend its rally toward the all-time high of $111,980 recorded on May 22. A decisive close above this level could pave the way for further gains, potentially establishing a new all-time high at $120,000."
personal opinion:!!!
BTC buying pressure is prevented by selling pressure according to H4 trendline, accumulating and soon surpassing ATH
Important price zone to consider :!!!
support zone : 107.000 ; 104.600
Sustainable trading to beat the market

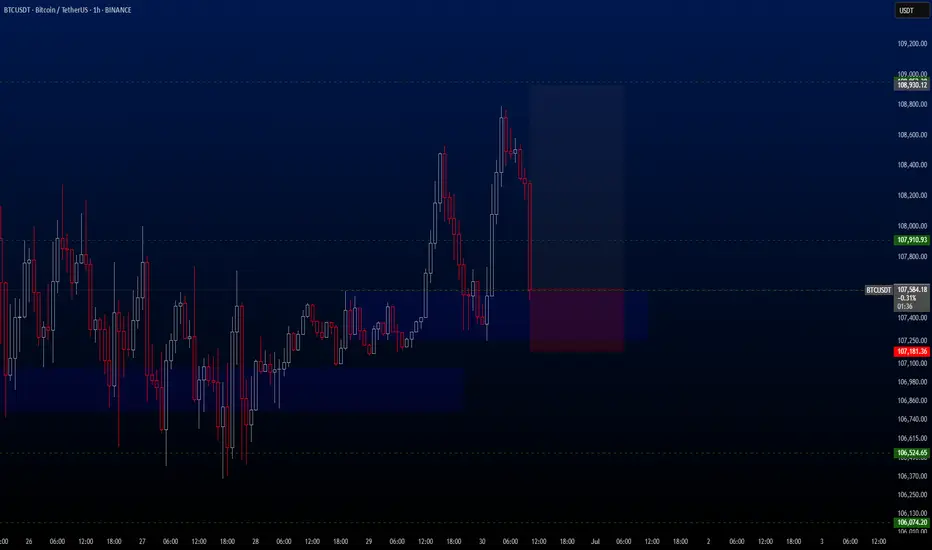
BTCUSDT Hello traders. Wishing you a great start to the week!
This week’s first trade opportunity comes from the BTCUSDT pair. Over the weekend, the pair showed significant volatility, dropping from 108,776 to 107,565 in just a few hours. However, I see this drop as a potential buying opportunity.
In my view, the price is likely to bounce back towards the 108,930.12 level in the short term. Therefore, I’ve activated the trade and I’m sharing the details with you below:
🔍 Trade Details
✔️ Timeframe: 1-Hour (H1)
✔️ Risk-to-Reward Ratio: 1:3.20
✔️ Trade Direction: Buy
✔️ Entry Price: 107,590.73
✔️ Take Profit: 108,930.12
✔️ Stop Loss: 107,181.36
🕒 If momentum weakens or price consolidates in a tight range, I will keep this trade open only until 23:00 (UTC+4). After that, I’ll manually close it—whether in profit or loss—based on how price action evolves.
🔔 Disclaimer: This is not financial advice. I’m simply sharing a trade I’ve taken based on my personal trading system, strictly for educational and illustrative purposes.
📌 Interested in a systematic, data-driven trading approach?
💡 Follow the page and turn on notifications to stay updated on future trade setups and advanced market insights.
BTC/USDTSince last November, price action has been ranging above and below a rising wedge which is typically a bearish structure. This has created plenty of market indecision with bears poised to regain control at every dip.
However, the recent pullback didn’t reach the wedge’s support line which is a subtle bullish sign and we’ve now clearly formed an inverse head and shoulders, a classic bullish reversal pattern.
A breakout is on the table with a target at $143K.

BTC/USDT Trade Setup – Lord MEDZStrategy: Goldbach Fair Value Gap + Smart Money Concepts (SMC)
Timeframe: 6H
Bias: Long
Trade Parameters
Entry: 102,577
Stop Loss: 99,527
Take Profit: 118,153
Risk to Reward: Approximately 5:1
Confluences and Justification
Price is expected to retrace into a clear Fair Value Gap (FVG) formed after displacement, aligning with the Goldbach model.
The structure confirms a completed reaccumulation phase, presenting a high-probability long setup.
This would complete the right shoulder of the classic inverse head and shoulders pattern, with the shoulder projected to dip into the POI. Head and shoulders patterns are often manifestations of Wyckoff accumulation or distribution phases, for those who may not be aware.
Liquidity left inside the gap provides inducement, increasing the likelihood of a sweep into the 102.5K zone.
The take-profit target at 118,153 aligns with the high of the Goldbach Fibonacci extension level.
Execution Plan
Wait for price to return to the FVG zone around 102,577. Look for confirmation such as a bullish displacement candle, a lower time frame BOS (break of structure), or mitigation of a lower time frame order block. Upon confirmation, execute long with a stop below 99,527. Take profit is set at 118,153.
Final Note from Lord MEDZ
"I await the return of price to imbalance. The reaccumulation is complete, and the alignment is clear. Entry shall be taken where inefficiency remains, and profit shall be claimed where liquidity awaits."

BITCOINBITCOIN , we need a clear breakout of the channel supply roof ,for next directional bias .
if we break above 108k then we are test 113-118k zone .
but if the reject 108k then 94k-96 will be the next good buy position

BTCUSDT SHORT SIGNAL Setup Type: Liquidity Trap & Distribution
Trade Idea (SHORT):
Entry Zone: $108,000 – $110000
Stop Loss: Above $113000
Take Profit Targets:
TP1: $104,000
TP2: $100,000
TP3: 98000
TP4: 74000
This analysis is for educational purposes only and does not constitute financial advice.
Always do your own research and apply proper risk management.
Trading involves risk, and you are solely responsible for your decisions.
Use this information as a guide — not a guaranteed outcome.
Wait for clear confirmation before executing any trade.

Trading the Impulse Rally Retracement — Price and Time Symmetry The Stop Loss Triangle is back!
This time with BITSTAMP:BTCUSD coming off its recent impulse rally. For those of you that aren’t familiar with my strategy — let me start from the beginning…
This concept involves positioning against the opposing decline in price and time as a precursor to our theoretical projection. If the underlying enters our predetermined faded cross-section, the stop loss is triggered to prevent sideways consolidation and the erosion of contract premiums or leverage decay.
This inherently ‘sclene’ triangle is constructed by drawing a straight trend line through the bottoming reversal candle and the furthest projection in price and time symmetry (78.6%) of the retracement. Once connected, draw a vertically positioned straight line from the highest or lowest point in the previously identified retracement to the bottom reversal candle area once again. To create a ‘right triangle’, now turn 90 degrees towards the final point, which is determined by the nearest projection in price and time symmetry (38.2%). This allows time after the imposed price and time date, yet not enough for premium or leverage decay to become significant.
In its entirety, this forms the stop loss triangle.
I encourage my followers to identify and explore the system on their own. As always, feel free to ask me anything related to it. We’ll follow along and you’ll be amazed at the precision of Fibonacci symmetry.
CHEERS

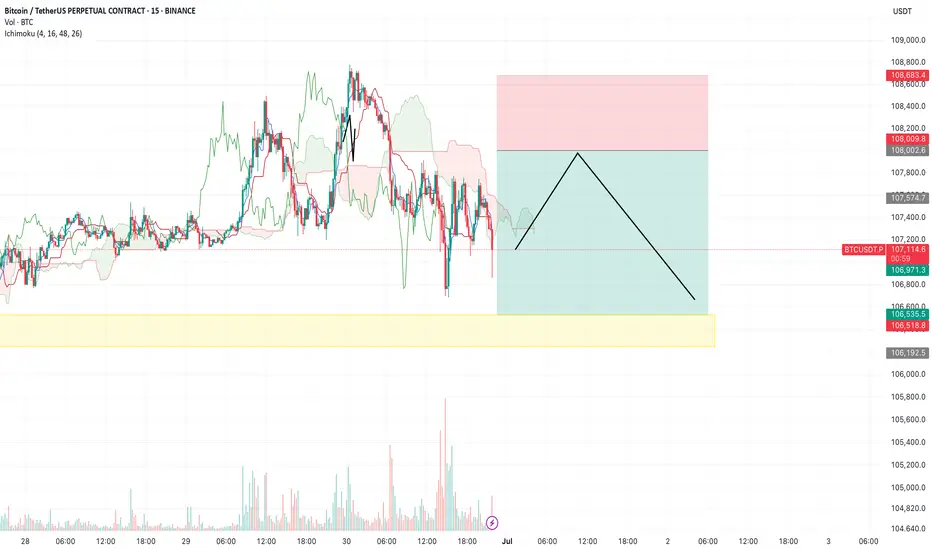
BTC/USDT – Intraday Plan (15m, Ichimoku) by RiscoraToday’s idea:
I’m expecting a retracement to the 107,867 level as a pullback to the recent impulse. The move we observed earlier aligns with my prediction from last Friday — liquidity was taken out above the highs, and now I anticipate a deeper correction against the overall bullish move.
My main scenario for the day is a move down into the 106,400 area at minimum, targeting the liquidity below.
Ideally, I’d like to see a push to 107,870 first, as that would provide the best entry for a short setup. I’m willing to open a short in that scenario, but it’s important to remember the higher timeframe trend remains bullish, so any short should be approached with caution.
Key levels:
Retracement target: 107,867
Main downside target: 106,400
Cautious shorting only — trend still bullish overall
Let’s see how the price develops. Will update if conditions change.
#BTC #Crypto #Trading #Ichimoku #Riscora
