BITCOINBITCOIN wait on the close of daily candle for clear directional bias ,break and close 108k will expose 111-115 and more higher zones .break below by rejection on daily candle will call for sell and target will be around 100-94k zone .
trading is 100% probability, some people are gifted while some are not.
USTBTC trade ideas

BTC TRrade Plan 08/06/2025Dear Traders,
📊 BTC/USDT 4H Analysis – June 8, 2025
Bitcoin is currently testing the upper boundary of a descending wedge pattern. We are monitoring two main bullish scenarios:
🔹 ALT 1: If the price breaks above the wedge resistance and holds, a continuation towards the $115,000–$120,000 zone is likely. This would confirm the breakout and a potential new bullish leg.
🔹 ALT 2: In case of a rejection from the current resistance, we expect a retracement toward the demand zone around $100,000–$101,600. If price action remains bullish in this zone, this could be a strong re-entry point for long positions.
🟥 Invalidation: A confirmed breakdown and consolidation below $100,000 would invalidate the bullish outlook and open the door to deeper corrections.
⚠️ Wait for confirmation and observe price action in key zones before entering any trades.
if you enjoyed this forecast, please show your support with a like and comment. Your feedback is what drives me to keep creating valuable content."
Regards,
Alireza!

BTCUSD I H8 CLS I Monthly OB I ATH Coming then $200KHey, Market Warriors, here is another outlook on this instrument
If you’ve been following me, you already know every setup you see is built around a CLS Footprint, a Key Level, Liquidity and a specific execution model.
If you haven't followed me yet, start now.
My trading system is completely mechanical — designed to remove emotions, opinions, and impulsive decisions. No messy diagonal lines. No random drawings. Just clarity, structure, and execution.
🧩 What is CLS?
CLS is real smart money — the combined power of major investment banks and central banks moving over 6.5 trillion dollars a day. Understanding their operations is key to markets.
✅ Understanding the behavior of CLS allows you to position yourself with the giants during the market manipulations — leading to buying lows and selling highs - cleaner entries, clearer exits, and consistent profits.
📍 +200K in play
"Adapt what is useful, reject what is useless, and add what is specifically your own."
— David Perk aka Dave FX Hunter ⚔️
👍 Hit like if you find this analysis helpful, and don't hesitate to comment with your opinions, charts or any questions.

Up for BitcoinHi traders,
Last week Bitcoin made a small correction up and after that another drop just as I've said.
After it retested the Weekly FVG and broke the previous swing low it went impulsive up again.
This could be the next impulse wave to new ATH's. So wait for the correction down to finish and trade longs.
Let's see what the market does and react.
Trade idea: Wait for the correction down to finish to trade longs.
If you want to learn more about trading FVG's with wave analysis, please make sure to follow me.
This shared post is only my point of view on what could be the next move in this pair based on my analysis.
Don't be emotional, just trade your plan!
Eduwave

HolderStat┆BTCUSD forming the triangleBINANCE:BTCUSDT has reclaimed the $106,000 support and broken out of a triangle structure. The path now leads toward 111K, a major resistance zone. Similar setups have triggered strong rallies before, and bulls are defending levels aggressively.

BTCUSDT analysis - 1H FVG and OB SetupsBitcoin has reacted cleanly to all marked zones so far.
Right now, we are waiting for price to reach the green circle area before making a decision. If we get confirmation on lower timeframes, we can look for a potential short setup on BTC.
Key zones are marked on the chart. Always wait for price to reach these levels and take your reactions on lower timeframes for precise entries.
Stay patient and let the chart come to you.
—
📊 ProfitaminFX | Gold, BTC & EUR/USD
📚 Daily setups & educational trades
📱 IG: @profitamin.fx

BTCUSDT – Multi-Timeframe Analysis | Demand Zone Sweep SetupAnalyzing BTCUSDT using 15m, 1h, 4h, and 1D timeframes.
Current structure shows a potential demand zone sweep followed by a reclaim setup.
Key confluences include:
RSI divergence forming on the 15m and 1h
Possible CHoCH on the 15m chart confirming bullish intent
Daily structure still intact as long as 106k holds
TP1, TP2, and SL levels are marked on the chart.
Monitoring closely for bullish confirmation before entry.
Trade what you see, not what you feel.

BTC - Continuation of Bull Trap 21.06.2025Hello Friday! Never, ever, ever trade crypto on weekend, but let's hop in!
🔻 What I expect more? Continuation of Bull Trap! (Probability 70/30)
Few Reasons:
Price broke 20 EMA(daily) and is sliding just above the 50 EMA with "dead-cat" bounce attempts.
RSI is going down below 50 — momeentuum is faaadiing.
No signs of some big demand at this level (low volume on small green candles + Iran uncertainty).
Notable, that we are far from any bounce move (which would support re-accumulation).
Scenario 1: Bearish Continuation (Most likely)
Expecting BTC to test the 99.5k zone — this is the key support level becasue of several arguments:
1) 0.886 Fib
2) Confluence with previous horizontal range support
3) 100 EMA
4) Under psychological level 100k
5) RSI needs to cool off before taking higher targets.
If 99.5k broken, next stop is near 88.5k (0.786 Fib)
I wouldn't like to analyse further possible downslide of BTC, so lets stay so far in already negative scenario within 88.5k, but let's keep in mind, that maximum pain we will see near 75k zone.
🟡 Alternative: Short-term Bounce (Probability 30/70)
BTC could attempt bounce towards 105–106.5k (retest of broken structure + 20 EMA resistance)
If this bounce has low volume and rejection near EMAs or RSI stays below 50 , it's a sell opportunity — not a bullish reversal.
✅ Final thoughts for short term: stay away from the market.
From 103.5k I would expect downward continuation toward 99.5k with possible minor bounce attempts along the way.
Wait for strong reversal signal near 100k and enter LONG with tight SL.
Don't trade during the weekend, unless there's a once in a lifetime opportunity.
Have fun!

Bitcoin Short-Term Outlook – Coming Week📈 Bitcoin Short-Term Outlook – Coming Week
Currently, Bitcoin is expected to gather liquidity around the $106,000 zone, potentially initiating a move toward the $110,000 resistance level.
This area will be crucial in determining the next directional move.
🔍 The market's reaction around $110,000 will be closely monitored, and the analysis will be updated once that level is reached.
📌 Note: This outlook is based on current market conditions and may require adjustments if sentiment or price structure changes.

BTC - Still StrugglingPlease refer to the last post:
We have been monitoring BTC at this red trendline for a potential breakout. In this post we are examining a lower timeframe (6H) to see how this structure is developing.
Price tried to rally to the red line, but sellers came in and swiftly pushed price back down. This is looking to be a third rejection at this red trendline so far.
Buyers are also fighting on the LTF. We have seen the low/mid $106k levels acting a support.
A break below $106k could lead to a drop back to our white trendline. This white trendline was recently established with 2 points of resistance (red arrows) followed by it being flipped into new support with 2 touchpoints (green arrows). Depending on when/if this trendline is tested it could bring BTC anywhere between $103-105k. Will update this post if that does happen.
In the meantime our three areas to watch on the lower timeframes.
-A break above the red trendline
-The midline around $106k continuing to hold
-The white trendline being tested

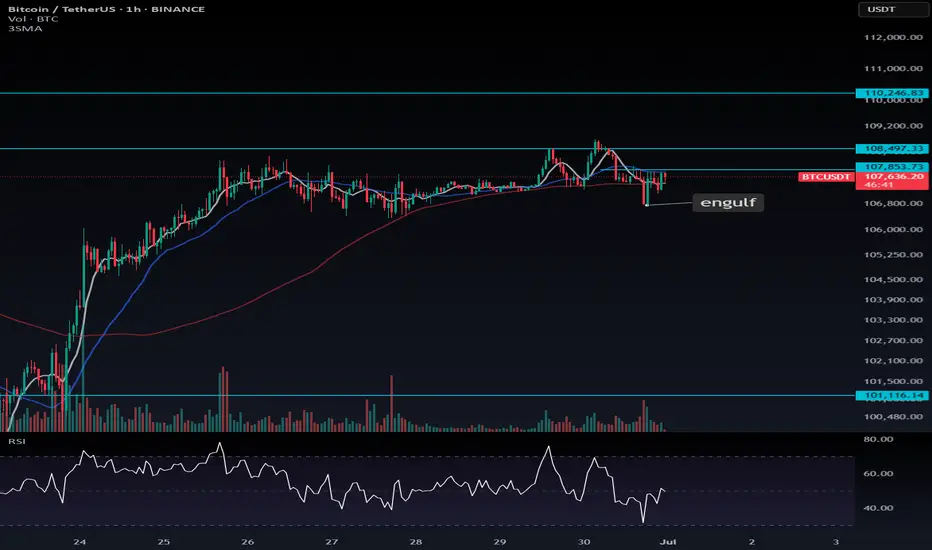
BTC Bullish Engulfing – Multiple Long Opportunities🚀 BTC Bullish Engulfing – Multiple Long Opportunities
Following the bullish engulfing candle, there are two potential long entries for Bitcoin:
🎯 Aggressive Entry: at $107,853.7 (higher risk)
✅ Conservative Entry: at $108,497.3
🔐 Stop-loss advice:
Place your stop either:
At a level that won’t be easily hit by short-term noise, or
At a level that confirms a short-term trend reversal if breached.
📈 If neither trigger plays out, set a stop-buy order at $110,246. A strong breakout is likely above this level, so don't miss it if momentum kicks in.
🧠 The choice is yours:
Enter early and accept the risk of getting stopped out
Or wait for confirmation and risk missing the trade
📌 If you’re already in a BTC long based on earlier signals, consider opening a position in high market cap altcoins to diversify exposure.
---
💬 Which entry level are you going for — early risk or breakout confirmation? Let me know in the comments! Always curious to see your strategies.
BTC TIME TO HEAD SOUTH BTC has given a CHOCH
Proper risk management
Sit tight as we ride to 102634.59 region.

Bitcoin is weakeningThere is a divergence in bitcoin chart. The bull is losing it power and we may got a long correction in six months.

BTC | At the Line Between ATH Expansion or Macro FlushBINANCE:BTCUSDT Bulls need to hold the $102k–$100.8k support and 1D 50MA for a shot at new highs.
– Wick into 1D FVG ($98k) is fine, but no daily close below 50MA allowed.
– Lose $100k? Then it’s sideline season — next real support only at $93k/$87k, macro flush risk toward $75k–$58k if momentum fails.
– As long as above 1D support/MA, there’s a chance for a clean ATH breakout from the OB under the highs.
This is the zone to bet on continuation. If not, don’t fight the trend lower.

Analysis No. 73Welcome to King BTC 3. The price of Bitcoin is expected to decline from 108,800 to the 104,000 range. If it is supported in this range, it can start an upward move, but if the 104 range is lost, it will reach 101,000 to 100,000, and in the next stage, it will approach 99,600, and this is a possibility.

Bitcoin Bullish But... Support Zones (Incl. Altcoins)Bitcoin is bullish right now but we know things can change. As long as the action is happening within the blue and gray space, all is good, the bullish bias remains intact. If the action moves below the gray zone and enters the orange zone, this is the danger zone. This danger zone can turn into a buy opportunity or a wait and see approach.
On the other hand, if Bitcoin remains above the blue zone this is ultra-bullish short-term. This is specially bullish for the altcoins but it is bullish for Bitcoin as it reveals consolidation at high prices, but right now we have a lower high so anything goes.
The chart is mixed when looked at up-close. Bullish long-term and on all bigger timeframes. Corrections tend to develop from high prices.
One more thing to consider
When we look at the action short-term we can miss the bigger picture, we can become clouded with noise. The bigger range is $100,000 - $110,000, this is the new long-term support zone that is being established and created before additional growth. Bitcoin can remain here for weeks or even months, if this happens, the altcoins will continue to grow.
We are in a bull market. Bitcoin is obviously in a bull market as it is trading near its all-time high after years of growth. The altcoins are just getting started after years of sideways action... Some altcoins hit new all-time lows but still part of a broad, long-term consolidation phase. Many produced higher lows, some produced lower lows, it makes no difference.
The bear market ended in mid/late 2022 and the ensuing two years we had mix growth. Bullish waves and bearish waves, with the usual variations of course.
The year is now 2025 and Bitcoin is up, most of the big projects have been growing for years now and we are getting close to the final advance, the major fifth wave and the bull market bull run. When this happens, close to its end, all the smaller projects will produce the biggest growth in their history and this will be the boom that will catapult Crypto to take over the financial world.
It won't be the first time this event happens nor the last, the market will continue to fluctuate.
I know there is a lot of information out there and we can become uncertain with every drop, but look at the price; what do you see? Bitcoin is going up.
The altcoins are set to follow, the altcoins do what Bitcoin does.
Namaste.

Btcusd sell setup H4Hello! Friends,
Greetings. Please leave a Like if you like the idea.
Before start talking about technical Let's share your LOVE by giving me LIKES to support this work. Thanks in advance.

BTCUSDT in a sell zone Let's keep it simple.
The IOF is bearish on the H4 timeframe.
Price has retraced to a premium zone.
Technically, once we see a lower timeframe confirmation from these zones, we take a sell.
While I'm eyeing the liquidity at 109050, any break below 106415 will usher us into a sell towards 99000.
Use your proper entry confirmation and risk management.

BITCOIN - Price can continue grow inside flat to $107933 level#BTC
The price is moving within a descending channel on the 1-hour frame and is expected to break and continue upward.
We have a trend to stabilize above the 100 moving average once again.
We have a downtrend on the RSI indicator that supports the upward move with a breakout.
We have a support area at the lower boundary of the channel at 106500, acting as strong support from which the price can rebound.
We have a major support area in green that pushed the price upward at 106000.
Entry price: 106736
First target: 106996
Second target: 107434
Third target: 107933
To manage risk, don't forget stop loss and capital management.
When you reach the first target, save some profits and then change your stop order to an entry order.
For inquiries, please comment.
Thank you.

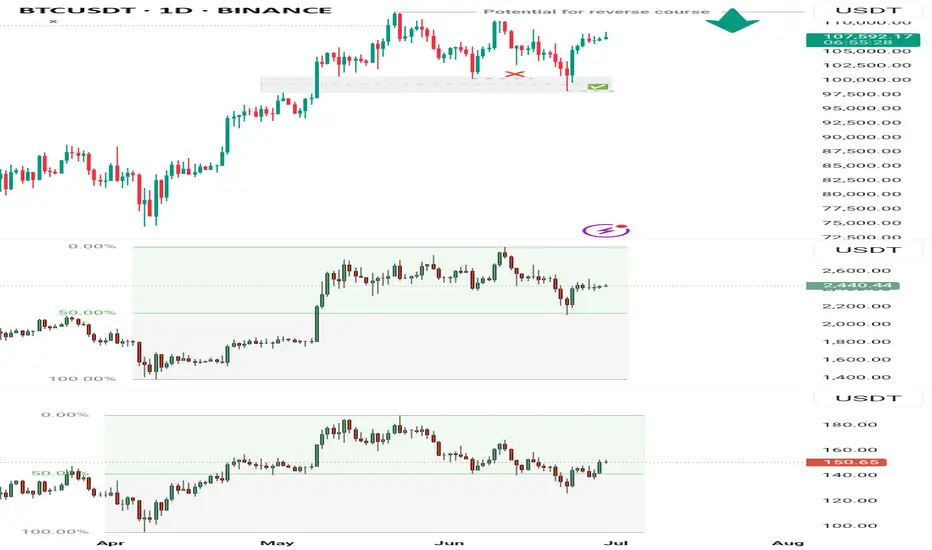
Let’s break down what the chart shows for BTCUSDT on the daily Chart key points
Price: Currently around $108,129
Key levels:
There are EQH (equal highs) around $111,500–$112,000 acting as liquidity.
There’s a smaller Daily FVG (Fair Value Gap) between ~$105,500–$107,000.
A larger Daily FVG lower around ~$99,000–$103,000.
Weekly Fibs mark retracement levels below.
Two projected paths: One a break above the EQH liquidity; the other shows a deeper pullback before that.
📈 Scenario 1: Bullish continuation + liquidity sweep
Idea:
BTC pushes up to sweep the EQH liquidity near $111,500–$112,000.
Breaks above, hits stops, and either:
Continues higher to the next resistance zone near $115,000–$118,000.
OR fakes out, sweeps liquidity, and retraces to the Daily FVG.
What to watch:
If price closes strongly above EQH with volume, look for continuation buys.
Confirmation: Break/retest of $111,500 as support.
📉 Scenario 2: Deeper pullback before continuation
Idea:
Price fails to break the EQH cleanly.
Pulls back into the small Daily FVG or deeper into the larger Daily FVG.
Reaccumulates around the $99,000–$104,000 zone.
From there, look for a bullish reaction for a safer long.
What to watch:
Weakness at EQH: Wicks or rejection candles.
Entry triggers: Strong bullish PA in the Daily FVG zones + confirmation.
✅ Key takeaways
Liquidity above EQH means there’s incentive for smart money to run stops.
FVGs are your high-probability reaction zones.
wait for price to trade into imbalance with signs of bullish order flow.

NEXT LEVELSnext move ahead for Bitcoin
Bitcoin Could Reach $140,000 in the Coming Months
Market analysts and crypto enthusiasts are increasingly confident that Bitcoin is on track to reach new highs. After strong institutional adoption, growing interest from retail investors, and the impact of recent halving events, many experts believe Bitcoin could surge to $140,000 in the coming months.
Macroeconomic factors like inflation concerns, limited BTC supply, and a weakening dollar are all contributing to the bullish momentum. If current trends continue, a breakout toward the $140K level is not just possible—it’s becoming more likely.
Stay informed, stay strategic, and get ready for what could be a historic move in the world of crypto.

Waiting for the Liquidity Flush – Will We Get That Drop or a StoCurrently holding a short position and have been waiting for a decent liquidity flush towards my TP zone for almost a day now. The thing that bothers me is how slow the price action is—it's grinding lower, but at the same time, building up a new liquidity shelf just above my entry.
This makes me concerned that we might see a quick liquidity sweep to the upside (taking out stops, possibly including mine) before any real move down happens. The area around my TP is loaded with liquidity, but the market seems hesitant to make that push.
What’s your opinion—are we likely to get that clean drop soon, or should we brace for a fake-out and stop hunt first?

BTCUSDT Market Outlook (Daily Chart)BTC’s failure to rally into a new all-time high (ATH) from the June 5th low can be attributed to the fact that price wasn't coming from a true discount zone. Similarly, key correlated assets like ETH and SOL also hadn’t reached their respective discount levels at that point. This misalignment created an unbalanced market structure, which necessitated a corrective move to realign broader market pricing.
Now that both ETH and SOL have tapped into their discount zones and shown signs of recovery, the conditions are more technically sound to project a potential ATH for BTC in the coming weeks or month. However, on a broader scale, this current rally could serve as a liquidity trap — drawing buyers into a high before distribution.
As for now, any sudden price drop should be seen as a potential buying opportunity into the anticipated new ATH. But caution remains key — any strong sell signal or reversal confirmation near the ATH zone could trigger a significant selloff as sellers regain control.