USTBTC trade ideas

BTC Is Replaying a Bullish Fractal >>> Are You Watching?Hello guys!
I see a deja vu here! Let’s look at the historical daily chart (Jan–May 2025):
What happened?
Initial Drop (Yellow Oval): Bitcoin approached a key S&D zone but didn't touch it, triggering a short-lived bounce before dropping again.
Second Drop (Red Ovals): This time, price precisely touched the demand zone, triggering a clean bullish reversal.
What followed was a strong trend breakout, sustained higher lows, and an eventual surge past prior resistance levels.
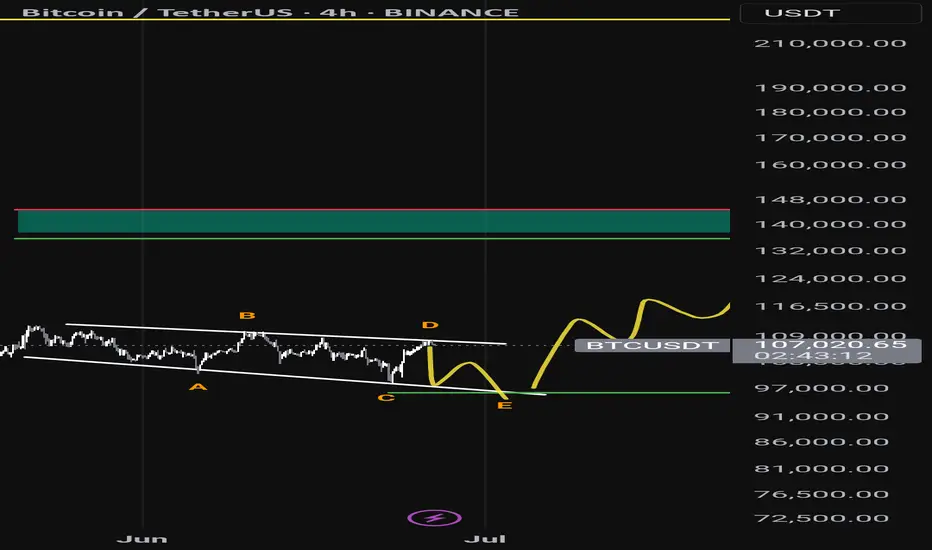
Current 4H Chart Setup: A Mirror Image?
Yellow Highlight: Once again, we saw a bounce that didn't quite touch the key demand zone ($98K–$100K).
Red Zone Prediction: If this mirrors the historical move, the price is likely to return and touch this S&D area before launching a bullish leg.
Blue Path Projection: A sharp reversal is expected post-touch, aiming toward $111K–$113K as the next key resistance zone.
The descending trendline adds confluence
___________________
History Doesn’t Repeat, But It Often Rhymes
Based on this fractal analysis, Bitcoin is likely forming the same bullish base seen earlier in 2025. The setup hinges on one key event: a return to the $99K–$100K zone, where demand is likely to step in aggressively.
If the pattern repeats, the current market may offer one last high-reward long opportunity before a parabolic rally.

Bitcoin Offensive plan for S/R, risk-on scenario confirmed__________________________________________________________________________________
Technical Overview – Summary Points
__________________________________________________________________________________
Momentum : Strong across all timeframes, driven by the Risk On / Risk Off Indicator (“Strong Buy” bias from 1D to 1H).
Key Supports : 98–100k remains the crucial zone to defend. Interim supports at 103.6k and 106k.
Major Resistances : 107–110k critical cluster, intermediate resistance at 108.2k.
Volume : Normal to moderately increasing volumes on all timeframes, short-term spike at 15min (caution warranted).
Multi-TF behavior : No signs of euphoria or capitulation except for 15min (behavioral overheating & high volume detected).
__________________________________________________________________________________
Strategic Summary
__________________________________________________________________________________
Structural bias : Strong bullish, confirmed by technical and sector data.
Opportunities : Pullback entries at 107–107.5k, trend-following plans on validated breakouts >108.2k/109.9k.
Risk zone : Major break under 106k then 103.6k = invalidation, watch for seller excess (ISPD)/extreme volume on 15min.
Macro catalyst : No major event expected; wait & see climate, caution around Middle East geopolitical headlines.
Action plan : Buy support, monitor breakout/volume, stop-loss below 106k then 99k.
__________________________________________________________________________________
Multi-Timeframe Analysis
__________________________________________________________________________________
1D – 12H – 6H : Durable bullish structure, price capped below 107–110k, momentum confirmed by Risk On / Risk Off Indicator (“Strong Buy”), no volume climax, healthy volume. 98–100k supports remain crucial.
4H – 2H – 1H – 30min : Aligned uptrend, no sell signals. Pullbacks absorbed at 103.6–107.5k pivots. 108.2k–109.9k breakout is pivotal, volumes healthy outside 15min.
15min : Emerging behavioral excess (ISPD = Sell), very high volume → risk of short-term overheat, avoid chasing without validation.
Summary : Bullish multi-timeframe confluence, but caution on ultra-short-term excess and geopolitical news flow.
__________________________________________________________________________________
Synthesis & Strategic Plan
__________________________________________________________________________________
Directional bias : Structurally bullish on all higher TFs, supported by Risk On / Risk Off Indicator, MTFTI, no major alert signals.
Action scenarios :
Buy pullback at 107–107.5k, SL below 106k (Swings) or below 107k (Scalps).
Confirmed breakout (vol./no behavioral excess) above 108.2–109.9k, targets >110k.
Risk/invalidation : Any break under 106k then 103.6k then 99k = bullish bias neutralized.
Risk management : Take partial profits on 109–110k extensions; avoid persistence if ISPD turns red & volumes spike on lower TFs.
Fundamental & on-chain factors : No macro catalyst, healthy consolidation, $99k–$100k on-chain supports decisive, breakout requires new inflows.
Decision summary:
Bias = Bullish, buy supports and validate breakouts with volume, watch for 15min excess and Middle East headlines. Strict SL below 106k/103.6k, risk-off below 99k. Partial profit taking on 109–110k extension. No immediate macro catalyst.

Bitcoin Pressing Up But This Compression Could Crack LowerBitcoin has been steadily climbing for months, respecting that long-term trendline since last year. Each dip into it brought a strong bounce, showing bulls are still in control of the bigger picture.
But right now price is pressing into a tight descending resistance line. We can see it making lower highs while struggling to break above that red trendline. At the same time, it’s sitting just above a key horizontal range, where buyers stepped in before.
This compression is risky . If BTC fails to push above the descending resistance and breaks back below the box, it could drop toward the next demand zone around the low 100K region .
As long as the major trendline from last year holds, the broader uptrend is intact . But losing this structure would open the door for a deeper correction.
This is the kind of spot where patience pays. Let the breakout or breakdown show its hand before jumping in heavy.

StochRSI indicator and support and resistance levels
Hello, traders.
If you "follow" me, you can always get the latest information quickly.
Have a nice day today.
-------------------------------------
The StochRSI indicator on the left chart is slightly different from the StochRSI indicator on the right.
The StochRSI indicator on the left chart is the StochRSI indicator provided by default in TradingView, and the StochRSI indicator on the right chart is an indicator with a modified formula.
The StochRSI indicator is a leading indicator that is reflected almost in real time.
Therefore, it reacts sensitively to price changes.
Although it is advantageous because it reacts sensitively, it also increases the possibility of being caught in a fake, so I thought that a slight delay(?) was necessary, and so I created the StochRSI indicator on the left chart.
If you look at the relationship between the K and D of the StochRSI indicators on the two charts, you can see that there is a big difference.
In the end, you can predict the movement by checking whether the movement of the K line has escaped the overbought or oversold section.
However, I think that you will receive information that can determine the sustainability of the trend depending on the positional relationship between K and D.
Therefore, it is important to distinguish the inflection points that occur in the StochRSI indicator.
This is because these inflection points provide important information for drawing trend lines.
Therefore, the StochRSI indicator on the left chart, which better expresses the inflection point, is being used to draw the trend line.
(Unfortunately, this indicator was not registered on TradingView because I did not explain it well.)
-
As a new candle was created, the StochRSI indicator on the left chart is showing an inflection point on the K line.
The StochRSI indicator on the right chart is showing a transition to a state where K < D.
We will have to check whether the inflection point was created only when today's candle closes, but I think that the fact that it is showing this pattern means that there is a high possibility of a change in the future trend.
Since the next volatility period is expected to start around July 2nd (July 1st-3rd), I think it has started to show meaningful movements.
-
It is true that you want to buy at the lowest price possible and sell at the highest price.
However, because of this greed, one mistake can lead to a loss that can overturn nine victories, so you should always be careful.
Therefore, if possible, it is better to check for support and respond.
In that sense, I think it is worth referring to the relationship between K and D of the StochRSI indicator on the left chart.
This is because the actual downtrend is likely to start when K < D.
-
In order to check for support, you definitely need support and resistance points drawn on the 1M, 1W, and 1D charts.
Ignoring this and checking for support at the drawn support and resistance points can result in not being able to apply the chart you drew to actual trading.
Therefore, you should draw support and resistance points first before starting a trade.
Otherwise, if you draw support and resistance points after starting a trade, you are more likely to set support and resistance points that reflect your subjective thoughts, so as I mentioned earlier, you are more likely to lose faith in the chart you drew.
If this phenomenon continues, it will eventually lead to leaving the investment market.
-
It is important to determine whether there is support by checking the correlation between the StochRSI indicator and other indicators at the support and resistance points drawn on the 1M, 1W, and 1D charts.
Even if the inflection point of the StochRSI indicator or other indicators occurs at a point other than the support and resistance points you drew, you should consider it as something that occurred beyond your ability to handle.
In other words, you should observe the price movement but not actually trade.
As I mentioned earlier, if you start to violate this, you will become less and less able to trust the chart you drew.
-
Accordingly, the basic trading strategy I suggest is to buy near the HA-Low indicator and sell near the HA-High indicator.
However, since the HA-Low and HA-High indicators are expressed as average values, they may move in the opposite direction to the basic trading strategy.
In other words, if the HA-Low indicator is resisted and falls, there is a possibility of a stepwise downward trend, and if the HA-High indicator is supported and rises, there is a possibility of a stepwise upward trend.
Therefore, the basic trading strategy mentioned above can be considered a trading strategy in the box section.
In the case of deviating from this box section, it is highly likely to occur before and after the volatility period indicated by the relationship between the trend line using the StochRSI indicator mentioned above and the support and resistance points drawn on the 1M, 1W, and 1D charts.
Therefore, special care is required when conducting new transactions during the volatility period.
This is because there is a high possibility of being caught in a fake when trading during the volatility period.
-
The DOM(60) and DOM(-60) indicators are good indicators to look at together with the HA-Low and HA-High indicators.
The DOM indicator is an indicator that comprehensively evaluates the DMI, OBV, and MOMENTUM indicators.
Therefore, the DOM(60) indicator is likely to be at the end of the high point range, and the DOM(060) indicator is likely to be at the end of the low point range.
In the explanation of the HA-Low and HA-High indicators,
- I said that if the HA-Low indicator receives resistance and falls, there is a possibility that a stepwise downtrend will begin,
- and if the HA-High indicator receives support and rises, there is a possibility that a stepwise uptrend will begin.
In order for an actual stepwise downtrend to begin, the price must fall below DOM(-60), and in order for a stepwise uptrend to begin, it must rise above DOM(60).
In other words, the DOM(-60) ~ HA-Low section and the HA-High ~ DOM(60) section can be seen as support and resistance sections.
-
If these correlations start to appear, I think you will be able to create a trading strategy that fits your investment style without being swayed by price volatility and proceed with trading.
The reason for analyzing charts is to trade.
Therefore, the shorter the time for chart analysis, the better, and you should increase the start of creating a trading strategy.
-
Thank you for reading to the end.
I hope you have a successful trade.
--------------------------------------------------

BTCBtc was trading inside falling wedge since a weak. it has cleared it now and has very good possibility of pumping hard to 112k

Next Volatility Period: Around July 2nd
Hello, traders.
If you "Follow", you can always get the latest information quickly.
Have a nice day today.
-------------------------------------
(BTCUSDT 1D chart)
The key is whether it can rise above 108316.90 and find support.
When OBV rises above the High Line, we need to check if the PVT-MACD oscillator switches to above the 0 point.
However, since the StochRSI indicator is currently showing signs of entering the overbought zone, I think there is a high possibility of resistance.
We need to check for support in the 108316.90-111696.21 zone, which is the high point boundary zone.
- If OBV fails to rise above the High Line,
- If the PVT-MACD oscillator fails to remain above the 0 point,
- If the StochRSI indicator falls from the overbought zone and switches to a state where K<D,
It is highly likely that it will eventually encounter resistance in the high point boundary zone and fall.
Therefore, what we need to do is to check for support near 108361.90-108353.0.
If it rises after that, we need to check for support near 111696.21.
Entering a new purchase in the high point boundary section is a very risky transaction.
Therefore, a short and quick response is required when making a purchase.
The basic trading strategy is to buy near the HA-Low indicator and sell near the HA-High indicator.
Do not forget this.
However, since the HA-Low or HA-High indicators are intermediate values, they may move in the opposite direction.
In other words, there is a possibility that the HA-Low indicator will receive resistance and fall, showing a stepwise downtrend, and the HA-High indicator will receive support and rise, showing a stepwise uptrend.
Therefore, you must check whether there is support in the low point boundary section of the DOM(-60) ~ HA-Low section or the high point boundary section of the HA-High ~ DOM(60) section.
To do this, you must trade in a split transaction method.
-
The next volatility period is expected to start around July 2 (July 1-3).
The reason why we calculate the volatility period is because it can be a turning point of the trend.
Therefore, making a new trade during the volatility period means that there is a high possibility of being caught in a fake.
-
Thank you for reading to the end.
I hope you have a successful trade.
--------------------------------------------------
- Here is an explanation of the big picture.
(3-year bull market, 1-year bear market pattern)
I will explain the details again when the bear market starts.
------------------------------------------------------

Another visit to $95,000 for Bitcoin?Looking at the price action of Bitcoin it appears to be moving in a descending channel formation. Usually this results in one of two outcomes. Either it breaks out, or it doesn't. And if it doesn't then it's most likely back down to the lows of the channel.

Btc usdt 1-3-6-12 mouthAnalysis of Bitcoin's movement for the near future. For 1-3-6 months. Based on candlestick and technical analysis

PRICE SPECULATION ON BTCUSD!Price updates from the H1 timeframe . Price is likely to drop from the current high after we saw a distribution stage currently forming, therefore, a sell opportunity is envisaged.

Skeptic | RSI Masterclass: Unlock Pro-Level Trading Secrets!Hey traders, it’s Skeptic ! 😎 Ready to transform your trading? 95% of you are using the Relative Strength Index wrong , and I’m here to fix that with a game-changing strategy I’ve backtested across 200+ trades. This isn’t a generic RSI tutorial—it’s packed with real-world setups, myth-busting insights, and precise rules to trade with confidence. Join me to master the art of RSI and trade with clarity, discipline, and reason. Big shoutout to TradingView for this epic free tool! 🙌 Let’s dive in! 🚖
What Is RSI? The Core Breakdown
The Relative Strength Index (RSI) , crafted by Welles Wilder, is a momentum oscillator that measures a market’s strength by comparing average gains to average losses over a set period. Here’s the formula:
G = average gains over n periods, L = average losses.
Relative Strength (RS) = | G / L |.
RSI = 100 - (100 / (1 + RS)).
Wilder used a 14-period lookback , and I stick with it—it’s smooth, filters noise, and gives a crystal-clear read on buyer or seller momentum. Let’s get to the good stuff—how I use RSI to stack profits! 📊
My RSI Strategy: Flipping the Script
Forget what you’ve read in books like The Handbook of Technical Analysis by Mark Andrew Lim— overbought (70) and oversold (30) aren’t just for shorting or buying. I go long when RSI hits overbought, and it’s been a goldmine. I’ve backtested over 200 trades with this approach, and it’s my go-to confirmation for daily setups. Why does it work? When RSI hits overbought on my 15-minute entry chart, it signals explosive buyer momentum. Here’s what you get:
Lightning-Fast R/R: I hit risk/reward targets in 30 minutes to 2 hours on 15-minute entries (longer for 1-hour entries, depending on your timeframe).
Massive R/R Potential: An overbought RSI on 15-minute can push 1-hour and 4-hour RSI into overbought, driving bigger moves. I hold for R/Rs of 5 or even 10, not bailing early. 🚀
Rock-Solid Confirmation: RSI confirms my entry trigger. Take BTC/USD:
BTC bounces off a key support at 76,000, sparking an uptrend.
It forms a 4-hour box range, but price tests the ceiling more than the floor, hinting at a breakout.
Trigger: Break above the box ceiling at 85,853.57.
On 15-minute, a powerful candle breaks the ceiling, and RSI hits overbought—that’s my green light. I open a long.
Soon, 1-hour and 4-hour RSI go overbought, signaling stronger momentum. I hold, and BTC pumps hard, hitting high R/R in a short window.
This keeps trades fast and efficient—quick wins or quick stops mean better capital management and less stress. Slow trades? They’re a mental grind, pushing you to close early for tiny R/Rs. 😴
Pro Rules for RSI Success
Here’s how to wield RSI like a trading weapon:
Stick to the Trend : Use RSI in the direction of the main trend (e.g., uptrend = focus on longs).
Confirmation Only: Never use RSI solo for buy/sell signals. Pair it with breakouts or support/resistance triggers.
Fresh Momentum: RSI is strongest when it just hits overbought/oversold. If the move’s already rolling, skip it—no FOMO, walk away!
Customize Zones: Overbought (70) and oversold (30) can shift—it might show reactions at 65 or 75. Adjust to your market’s behavior.
Backtesting RSI: Your Path to Mastery
To make RSI yours, backtest it across at least 30 trades in every market cycle— uptrend, downtrend, and range. Test in volatile markets for extra edge. 😏 Key takeaways:
Range Markets Kill RSI: Momentum oscillators like RSI (or SMA) are useless in ranges—no momentum, no signal. Switch to ROC (Rate of Change) for ranges—I use it, and it’s a beast. Want an ROC guide? Hit the comments!
Overextended RSI Zones: On your entry timeframe (e.g., 15-minute), check higher timeframes (e.g., 4-hour) for past RSI highs/lows. These are overextended zones—price often rejects or triggers a range. Use them to take profits.
Final Vibe Check
This RSI masterclass is your key to trading like a pro—fast R/Rs, big wins, and unshakable confidence . At Skeptic Lab, we live by No FOMO, no hype, just reason. Guard your capital— max 1% risk per trade, no excuses. Want an ROC masterclass or more tools? Drop a comment! If this fired you up, smash that boost—it means everything! 😊 Got a setup or question? Hit me in the comments. Stay sharp, fam! ✌️

BTC/USDT, 4H chart, Futures - Bullish projection.The price is expected to consume time in its SQZ and take liquidity at the bottom of the range to make decisions... to UP

Sharing the advanced Bollinger Bands strategyHere are the Bollinger Band trading tips: *
📌 If you break above the upper band and then drop back down through it, confirm a short signal!
📌 If you drop below the lower band and then move back up through it, confirm a long signal!
📌 If you continue to drop below the middle band, add to your short position; if you break above the middle band, add to your long position!
Pretty straightforward, right? This means you won’t be waiting for the middle band to signal before acting; you’ll be ahead of the game, capturing market turning points!
Let’s break it down with some examples:
1. When Bitcoin breaks above the upper Bollinger Band, it looks strong, but quickly drops back below:
➡️ That’s a “bull trap”—time to go short!
2. If Bitcoin crashes below the lower band and then pops back up:
➡️ Bears are running out of steam—time to go long and grab that rebound!
3. If the price keeps moving above the middle band:
➡️ Add to your long or short positions to ride the trend without being greedy or hesitant.
Why is this method powerful?
It combines “edge recognition + trend confirmation” for double protection:
1. Edge Recognition—spot the turning point and act early.
2. Trend Confirmation—wait for the middle band breakout and then confidently add positions!
You won’t be reacting after the fact; you’ll be ahead of the curve, increasing your positions in the trend’s middle and locking in profits at the end. This is the rhythm of professional traders and the core logic of systematic profits!
Who is this method for?
- You want precise entry and exit points.
- You’re tired of “chasing highs and cutting losses.”
- You want a clear, executable trading system.
- You want to go from “I see the chart but don’t act” to “I see the signal and take action.”
Follow for more. Make sure to like this if you found it useful.

BTC next boom beginning I'm going to see boom in btc
Here’s the analysis of Bitcoin’s (BTC) next expected move in English, based on current market conditions and technical indicators:
---
### **1. Short-Term Outlook (Next 24-48 Hours)**
- Bitcoin is currently trading around **$107,400**, with **$108,000-$109,000** acting as a strong resistance zone.
- If BTC breaks above **$109,870** and closes above it, the next target could be **$114,950**.
- If the price fails to break resistance, a pullback to **$105,300** or **$103,900** (support levels) is possible.
- The **30-minute RSI is at 52.22** (neutral-bullish), and the MACD histogram is in positive territory.
---
### **2. Medium-Term Outlook (1 Week to 1 Month)**
- **Coincodex predicts**:
- **$116,914** (+8.98%) by July 2025.
- **$136,858** in the next 3 months.
- **DigitalCoinPrice forecasts**:
- Average price of **$221,961** by late 2025, with a potential high of **$235,354**.
---
### **3. Key Technical Indicators**
- **4-Hour Chart**:
- BTC is testing the **upper Bollinger Band ($108,672)**. A breakout could target **$114,956**.
- **Support Levels**:
- Immediate support: **$105,358** (EMA 100).
- Strong support: **$103,996**.
---
### **4. Market Sentiment**
- The **Fear & Greed Index** is currently at **74 (Greed)**, indicating bullish sentiment but also potential overbought conditions.
- **Volume**: Stable buying volume suggests sustained interest, but a drop could signal consolidation.
---
### **5. Potential Scenarios**
- **Bullish Case**: Break above **$109,870** → Rally toward **$114,950-$116,000**.
- **Bearish Case**: Rejection at resistance → Drop to **$105,300-$103,900**.

BTC - LONG SET-UPBINANCE:BTCUSDT
Bitcoin is currently testing its critical resistance level
If the price gets rejected here, the key support to watch is the $𝟏𝟎𝟏,𝟐𝟎𝟎 - $𝟏𝟎𝟐,𝟖𝟎𝟎 zone. This area represents a strong demand level where a potential buying opportunity could emerge.
For a trade setup based on this support, a strategic Stop Loss (SL) should be placed below the $𝟗𝟖,𝟎𝟎𝟎 mark to manage risk.
For now, patience is crucial. Keep a close eye on the price action

Bitcoin Technical Analysis | The Most Important Channel 📊 Bitcoin Technical Analysis | The Most Important Channel You’ll Ever See!
This might be the most critical BTC chart you come across. I've mapped out the key ascending channel that has defined Bitcoin’s long-term trend over the past few years. The upper boundary, lower boundary, and especially the midline have repeatedly acted as dynamic support and resistance levels.
Right now, BTC is trading near the channel top, with strong bullish momentum. While the buying pressure remains high and a breakout is possible, watch out for potential rejections or fakeouts around this area.
All major support and resistance levels are clearly marked in this chart. Make sure to draw this channel on your own chart and use it as a powerful tool in your trading decisions.
🧠 Follow for more high-probability setups, smart technical insights, and real-time updates!

BTCUSDT 1D📈 #BTC Plan for July – Bullish Setup in Play
Bitcoin is forming a bull flag pattern on the daily chart — a classic setup that often leads to strong upward continuation when confirmed.
🔹 Key Indicators
• MACD is building positive momentum
• RSI is holding above 50
• Price is trading above the MA50 and the Ichimoku Cloud, indicating strong underlying support
📍 Strategy
We're buying here and will consider adding more near the key support zone:
$98,200 – $99,613
📈 Potential breakout targets (on confirmation):
🎯 $112,471
🎯 $116,880
🎯 $121,288
⚠️ Reminder
Always use a tight stop-loss and apply proper risk management.
Breakout confirmation with volume is crucial.

#BTC/UST#BTC
The price is moving within a descending channel on the 1-hour frame, adhering well to it, and is on its way to breaking it strongly upwards and retesting it.
We are seeing a rebound from the lower boundary of the descending channel, which is support at 106,000.
We have a downtrend on the RSI indicator that is about to break and retest, supporting the upward trend.
We are looking for stability above the 100 moving average.
Entry price: 106,600
First target: 106,750
Second target: 107,000
Third target: 107,291

Why BTC hasn’t moved up recentlyBTC has been bobbing above and below this bearish triple crossover the past few months. What we see as consolidation is rather price getting stuck around these resistance levels.
The only reason why this would be occurring in my view, is due to the market makers having intention to allow this drop to play out.
The resistance is located at around 107,000 to 107,400 - watch this zone closely for a hold below / rejection and fast drop.
Scenario 1 marked with solid red line.
Scenario 2 marked with dotted red line.
Little update for y’all. Happy weekend trading.

BTC - 108k?BTC looks it has power to go more up, remember the more it goes up the more shorts are active, but 108,500 good look for shorts as well!

BTC 26.06.25This could be the range i was waiting for to create the 3rd tap of the accumulation model later. Yesterday we had a mini model 1 at NY open which could have had the intention to be the starting point of the new range. I am now watching for new deviations which then would form a bigger range. There is nothing but liquidity until 104.536$ which would be a perfect target for a range low, but until there are no confirmations this only is an expectation. If the accumulation model is already complete, like i mentioned in my last post, then the target becomes the range high (110.652$).

Today's BTC trading strategy, I hope it will be helpful to you Four Bullish Drivers Behind Bitcoin's Rally
(1) Institutional Capital Rampage: From Whale Holdings to Market Scarcity
- **BlackRock et al. as anchor investors**: BlackRock's Bitcoin ETF (IBIT) has ballooned to $71.9 billion, holding 660,000 BTC—equivalent to 3.1% of total circulating supply. Such "whale-level" positions not only provide liquidity support but also shatter traditional financial institutions' attitude toward crypto.
- **Accelerating OTC concentration**: OTC platform data shows Bitcoin inventory plunged from 166,500 coins at the start of the year to 137,400 coins, a 17.5% drop. This signals massive coins are shifting from exchanges to institutional custody, creating a "scarcity effect" analogous to apple prices surging due to supply shortages.
(2) Fed Rate Cut Expectations Ignite Hot Money Inflows
- **Policy pivot-driven capital reallocation**: After Fed Governor Bowman signaled a possible July rate cut, CME futures now price in two 2025 rate cuts (up from one). Historical parallels: Bitcoin surged 42% in 6 months post-Fed's first 2019 rate cut (S&P 500 +12%), as low rates enhance Bitcoin's appeal as a "non-sovereign asset".
- **Diminishing opportunity costs**: A potential Fed rate cut would lower real yields (nominal rate - inflation). If 10-year Treasury real yields fall from 2.3% to 1.5%, the opportunity cost of holding gold/Bitcoin declines, pushing funds from bonds into risk assets.
(3) Regulatory Gate Opening: Chinese Brokerage Breaks New Ground
- **Guotai Junan International's milestone**: On June 24, Hong Kong's SFC approved its virtual asset trading services, making it the first Chinese-funded brokerage to gain such. This opens a "compliant channel" for mainland capital—post-announcement, its HK shares surged 101%, while OTC Bitcoin inventory dropped by 3,000 coins, indicating institutions are front-running liquidity inflows.
- **Financial infrastructure upgrade**: The service allows clients to trade BTC via traditional securities accounts, lowering entry barriers. Analogous to Chinese brokerages accessing gold ETFs in 2013, such channels typically trigger explosive incremental flows, expected to attract $1-2 billion from family offices initially.
(4) Technical "Golden Cross" Confirms Long-Term Trend
- **Key moving average resonance**: BTC recently completed a 50-day MA (102,300 USD) cross above 200-day MA (94,700 USD), forming a "golden cross". Backtesting 2019 and 2020 instances, this pattern preceded 58% average 6-month gains, though short-term pullbacks (10-15%) are common (e.g., June 2023 post-cross correction).
- **Strong support forming a safety net**: The 200-day MA now acts as dynamic support—pullbacks to ~95,000 USD would represent a "secondary buying opportunity at institutional cost bases", similar to housing prices finding support when breaking below moving averages.
Today's BTC trading strategy, I hope it will be helpful to you
BTCUSDT BUY@106000~107000
SL:105000
TP:108000~109000
