Bitcoin Formed Next level Formation #bitcoinHello trader's
Here is something special formation in Bitcoin chart...
Now. You know which side is breaking....
If don't comment
USTBTC trade ideas

BTC Intraday SetupWait for the liquidation sweep on any side, then take entry, btc moving in sideways for many days, remember that first breakout will be fakeout on any side.

Bitcoin Market Outlook📈 Bitcoin Market Outlook
We're seeing lower highs forming on the chart, which suggests a possible short-term bearish trend.
🔹 I'm watching $109,953 for a long position — if price breaks above that level, I’ll consider entering with a stop-buy using the exchange's order book.
🔹 For a short position, the current trigger is $107,344, but keep in mind this level may change — I’ll update if needed.
🚨 If you’re shorting, use a tight stop-loss and take profits quickly.
In this kind of market, risk and money management are everything.
💬 Let me know what you think in the comments — always happy to hear your take!

BTCUSDT – Ready to Launch from Accumulation Zone?BTCUSDT is consolidating around the $101,000 FVG zone – a previously strong launchpad. Price structure remains bullish, forming higher lows and showing a healthy throwback pattern.
If the $101,448 level holds, the next target could be $116,000 – a potential 14% rally in two weeks.
Fundamentals support the upside: expectations of Fed rate cuts and renewed ETF inflows are fueling fresh momentum for Bitcoin.
Still, watch for price action confirmation – and always manage your risk!

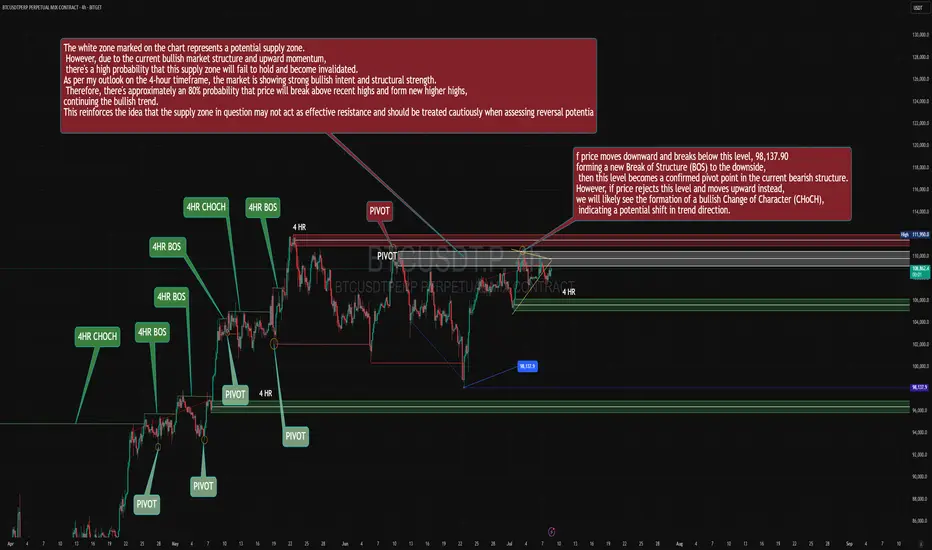
BTC/USDT Multi - time frame analysis and {4HR }BTC/USDT Multi-Timeframe SMC Analysis – July 8, 2025
1. Top-Down Analysis:
Daily Timeframe (Macro Market Structure & Narrative - Inferred from chart context):
The broader market structure indicates a prolonged consolidation phase, initiated around mid-June, characterized by defined support and resistance levels. The identified supply zone, ranging approximately from $108,000 to $109,500 and labeled as "Potential Supply Zone" on the chart, is a key daily-level area.
Crucially, despite entering this daily supply, the strong underlying bullish order flow suggests a high probability that this supply zone may not act as an effective distribution point. The overarching narrative from higher timeframes indicates robust institutional buying pressure, implying a potential shift in the broader trend to unequivocally bullish upon a clear breach of this daily supply.
4H Timeframe (Swing Structure, Internal BOS/CHoCH):
The 4H swing structure explicitly displays a very clear bullish order flow. We observe a series of consecutively confirmed CHoCH (Change of Character) and BOS (Break of Structure) to the upside (indicated by "4HR CHOCH" and "4HR BOS" annotations). This unequivocally establishes a decidedly bullish 4H swing bias.
The most recent 4H BOS occurred around the $107,000 level, after which price has continued its upward trajectory.
Price is currently engaging with a 4H supply zone (marked by the white box). However, given the dominant bullish order flow on the 4H, there is a high probability that this supply zone will be invalidated, allowing price to extend its bullish movement. This phenomenon often signifies an "Imbalance Fill" or "Liquidity Grab" by smart money to fuel further upside.
1H Timeframe (Entry-Level Structure & POIs):
The 1H timeframe currently reflects a phase of consolidation or minor correction following the recent bullish impulse.
In alignment with the decisive bullish 4H bias, any retracement observed on the 1H timeframe is to be considered a buying opportunity.
The "PIVOT" marked around $105,000 serves as a potential 1H demand area, which could be a target for a deeper retracement before the continuation of the bullish move. However, considering the current market strength, price might not even reach this level and could resume its ascent from current or slightly higher levels.
The current "PIVOT" at approximately $108,500 represents a temporary internal resistance. A decisive break and sustained close above this pivot would provide stronger confirmation for the continuation of the bullish trend.
2. Identification:
Clean Breaks of Structure (BOS) and Changes of Character (CHoCH):
4H: Multiple clear bullish BOS and CHoCH events, indicative of strong bullish order flow.
1H: Internal structure currently shows consolidation prior to a likely bullish BOS to new highs.
Valid Supply & Demand Zones (Unmitigated only):
Unmitigated 4H/1H Supply Zone: Approximately $108,000 - $109,500 (marked by the white box). However, as noted, it is anticipated to be invalidated due to the overall bullish order flow.
Unmitigated 4H/1H Demand Zones: Lower down, around the $105,000 PIVOT and the green-shaded regions on the chart (potential demand areas that would activate upon a deeper retracement).
Internal and external liquidity pools (buy/sell-side):
External Buy-side Liquidity: Above the all-time highs or previous "High" (observed at $111,900 on the prior chart).
Internal Buy-side Liquidity: Above current range highs (approx. $109,500) and above recent pivots.
Internal Sell-side Liquidity: Below recent 1H pivots, particularly below $107,000 and $105,000 (which could act as inducement).
Inducement patterns and liquidity grabs (internal sweeps):
Any minor retracement or downside fluctuation from the current supply zone could act as inducement to draw in sellers, before price resumes its bullish trajectory.
Previous sweeps to the downside have served as confirmation of liquidity accumulation for prior bullish moves.
Order blocks, FVGs, mitigation blocks, and imbalance zones:
Given the impulsive nature of the bullish moves, bullish FVGs and OBs should be considered in retracements (e.g., around the $105,000 demand area).
The current supply zone (white box) also contains OB/FVG, but as mentioned, its invalidation probability is high.
Active market range and internal liquidity engineering:
The active 4H market range encompasses the recent bullish move from $102,000 to current highs.
Internal liquidity engineering currently involves drawing sellers into the supply zone and subsequently invalidating it for continued bullish advancement.
3. Delivery:
Directional Bias with Contextual Narrative:
Strongly Bullish. The 4H order flow is unequivocally bullish, with repeated confirmations of bullish BOS and CHoCH. While price is entering a supply zone, the overall bullish strength suggests it is highly probable this zone will be invalidated, leading to further upside to target new highs. The market narrative points towards a continuation of the uptrend, targeting external buy-side liquidity.
Actionable Setup (Long):
Asset: BTC/USDT Perpetual Futures
Entry Level (POI, OB or FVG):
Scenario 1 (Aggressive Entry - given market strength): Enter long within the $107,500 - $108,000 range (upon confirmation of bullish price action on the 1H or 15-minute timeframe within the supply zone, indicating its invalidation). This entry presumes the supply zone will be breached.
Scenario 2 (Conservative Entry - upon retracement): Enter long within the $105,000 - $105,200 range (the pivot area and potential demand zone). This point would activate upon a deeper retracement into a discount area.
Given the chart and current strength, Scenario 1 appears more probable, but price action confirmation is critical.
Stop-Loss (Invalidation Structure):
For Scenario 1: Place stop-loss below the last valid 1H structural low that confirms the bullish impulse, or below $106,500.
For Scenario 2: Place stop-loss below the demand zone and below the $104,500 pivot, e.g., $104,000.
Target Level (Minimum 3R+):
Target 1 (1R): $109,500 (Break of current supply range high and liquidity grab).
Target 2 (2R): $111,000 (Retest of previous "High").
Target 3 (3R+ / Primary Target): $112,500 - $113,500 (Formation of new highs and targeting fresh buy-side liquidity).
R-multiple Calculation Example: If for Scenario 1, entry is $107,700 and stop is $106,500 (1200 points risk), a 3R target would be $107,700 + (3 * $1200) = $111,300, which aligns with our targets.
Confluences:
Multi-Timeframe Alignment: Decisive bullish 4H order flow provides strong support for a bullish bias, treating any retracement as an opportunity.
Liquidity: New highs and external buy-side liquidity serve as clear targets.
Supply Zone Weakness: Despite price entering a supply zone, the underlying bullish strength suggests its probable invalidation.
Pivot Price Action: Repeated bullish pivots and structural breaks confirm the trend.
This analysis presents a high-conviction long setup for BTC/USDT. However, close attention to price action confirmations on lower timeframes (e.g., 1H or 15-minute) within the current supply zone will be crucial for aggressive entry. Should price retrace, anticipate a bounce from lower demand zones.
Disclaimer: This is a market analysis based on current price action and structure. It does not constitute a buy or sell signal. Always conduct your own research and risk assessment before taking any trades
BITGET:BTCUSDT.P

bitcoin targets...Based on the patterns and price movements in Bitcoin, I have identified possible targets in the image.
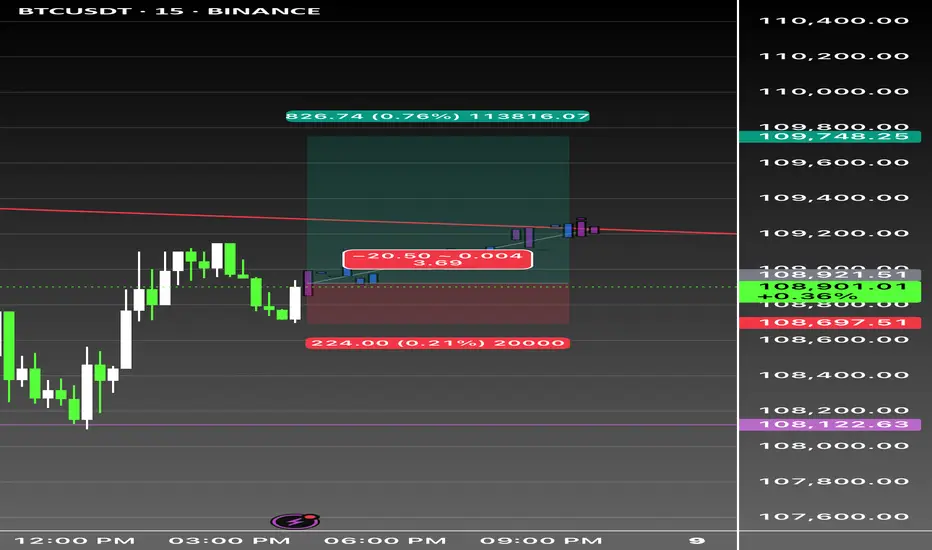
BTC Long scalp tight stop 📈 BTCUSDT 15min | Long Trigger Alert
Caught a breakout move 🔥
✅ Entry: 108,697
🎯 Target: 109,748 (+0.76%)
🛑 Stop: 108,473 (Tight 0.21% risk)
🔗 RRR: 3.69
Triggered after reclaim and retest near trendline resistance — flipped into support. Consolidation candles printed bullish structure above EMA. Watching for continuation 🚀
🎯 High confluence setup
💪 Clean structure
🔍 15m momentum shift confirmed
Leverage: 20x+ scalp friendly, manage tight.
Confidence: 8/10
#BTC #CryptoTrading #BTCUSDT #LeverageTrading #ScalpSetup
BTC accumulates momentum again in the range
Macroeconomic and policy impact
Trump tariff policy: The United States announced that it would impose 25%-40% tariffs on Japan, South Korea and other countries (effective on August 1), triggering market risk aversion, and Bitcoin once fell to the support level of $107,5004.
Federal Reserve policy: The market is concerned about the possibility of a rate cut in July. If the Fed turns dovish, it may boost the price of Bitcoin by 17.
Musk and Trump conflict: The public dispute between the two sides over the "Big and Beautiful Act" caused short-term fluctuations in the crypto market, with DOGE leading the decline and BTC once under pressure by 2.
Bitcoin is currently in the key liquidity-intensive area of 105,000-108,800 US dollars, and the long and short sides are fiercely competing here:
Above $108,800: A large number of short stop-loss orders are gathered, and a breakthrough may trigger a chain of short liquidations, pushing the price towards $113,000-130,000.
Below $107,100: There are dense long leveraged positions. A break below this level may trigger forced liquidation of long positions, causing the price to fall back to the $92,000-$95,000 support zone 1.
Technical aspects and market structure
Breakout-retracement mode: If the weekly close stabilizes at $107,720, the upward trend may be confirmed, with the target pointing to $110,000-$130,000. The historical analogy of the "step-up" structure in Q4 2024 indicates that the bull market may continue.
Short-term resistance and support:
Resistance level: $108,500 (if it breaks through, it may test $110,000).
Support level: $107,500 (if it breaks below, it may drop to $106,500)410.
Bitcoin has recently fluctuated between $106,000 and $110,000, with ETF inflows and long-term holders selling forming a seesaw 57.
Summary
Bitcoin is currently in a critical game range. The short-term trend may be determined by the liquidation trigger point (107,100-108,800 US dollars), and is also affected by macro policies (tariffs, the Federal Reserve) and institutional capital flows. The medium- and long-term bullish expectations are strong, but attention should be paid to high leverage risks and changes in market sentiment.
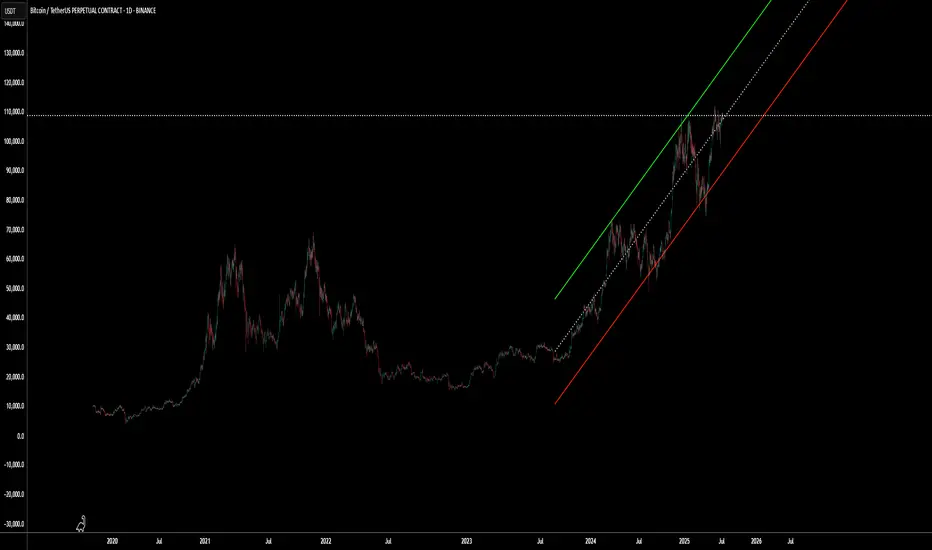
Delayed Cycle Kicks Off This March? (Chart)🚀📈 Delayed Cycle Kicks Off This March? 🔥💡
March has (almost) arrived, and Bitcoin has officially confirmed $79,478 as major structural support—a critical level that had to be checked before the next move. This aligns perfectly with my previous idea of a delayed cycle playing out.
📌 Long above 79K
📌 Short below 79K
📌 Short-term target: GETTEX:87K+
With this structural support holding, I expect Bitcoin to push toward the next major test: $113,800. This is the all-time trendline, a level of historical significance.
🔑 What happens at 113K?
This is where Bitcoin’s fate for this cycle will be decided:
✅ A breakout above 113K could unlock a run to 150K - 200K, a true extension of this cycle.
❌ A terminal rejection at 113K could mark the end of this cycle, signaling a broader correction phase.
At the moment, the probabilities lean toward further upside, with an 80% chance of continuation. The 20% downside risk remains for a dip to FWB:65K-66K, but as long as Bitcoin stays above 79K, the bullish thesis remains intact.
💡 March looks strong, and I’m stepping on the gas today.
Let’s make it a powerful month! 🚀
One Love,
The FXPROFESSOR 💙
video:

Orangeman vs The Federal Reverse: Season 1 (2018–2020)It all started in 2018... 🎬
🧱📈💼 March 21, 2018: Jerome Powell steps in as the new Fed Chair. Almost immediately, the Fed hikes rates from 1.50% to 1.75%, citing a strong U.S. economy.
💬📊🇺🇸 June 13, 2018: Another hike to 2.00%. Powell says the U.S. economy is “in great shape.” But markets? Not so thrilled.
🗣️📉🇺🇸 July 19, 2018: Enter The Orangeman—President Trump publicly attacks the Fed's policy, breaking tradition. He’s “not thrilled” with the hikes.
📉🏦 September 26, 2018: Yet another hike to 2.25%. The Fed stays firm. Trump? Getting louder.
❗😠💬 "I'm not happy with the Fed." – Trump
⚠️📉📉 December 19, 2018: Fourth hike of the year to 2.50%. Markets tank. Rumors swirl: Trump wants Powell gone.
🔥💣👔 Behind the scenes: Trump reportedly explores ways to dismiss Powell. The pressure is on.
📛🇺🇸📉 June 10, 2019: The battle heats up. Trump calls the hikes a “big mistake” and demands rate cuts.
✂️📉📉 July 31, 2019: Powell blinks. The Fed cuts rates by 0.25%—first cut since 2008. Trump tweets:
👎🐦💸 “Powell let us down.”
⬇️📉🔁 September 18, 2019: Second cut.
⚖️🔁🧩 October 30, 2019: Third consecutive cut. The Fed pivots completely. The Orangeman’s influence is undeniable.
🦠🧪📉 March 2020: COVID strikes. The Fed responds with emergency rate cuts.
🌀🧻💸 March 15 & 23, 2020: Rates slashed to near zero. QE infinity unleashed. Powell goes full printer mode. Bitcoin begins to stir...
Season 1 closes with markets melting down, a pandemic, and the Fed surrendering to zero rates.
But The Orangeman isn’t done...
And The Federal Reverse still lurks in the shadows.
Next up: tariffs, China, currency wars, and another campaign trail. 🐉💵⚔️
Season 2 is coming.
Stay tuned...
One tweets.
The other tightens.
Who controls our future?
One Love,
The FXPROFESSOR 💙

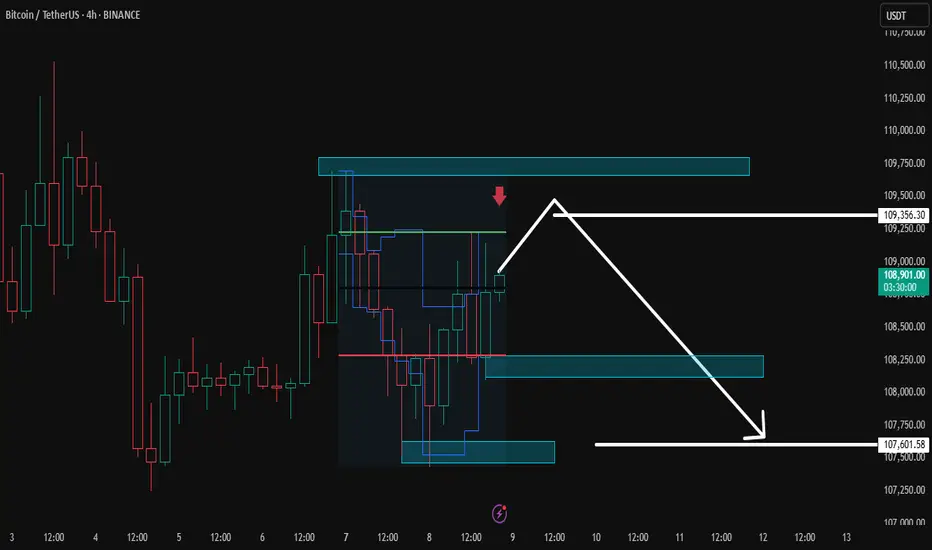
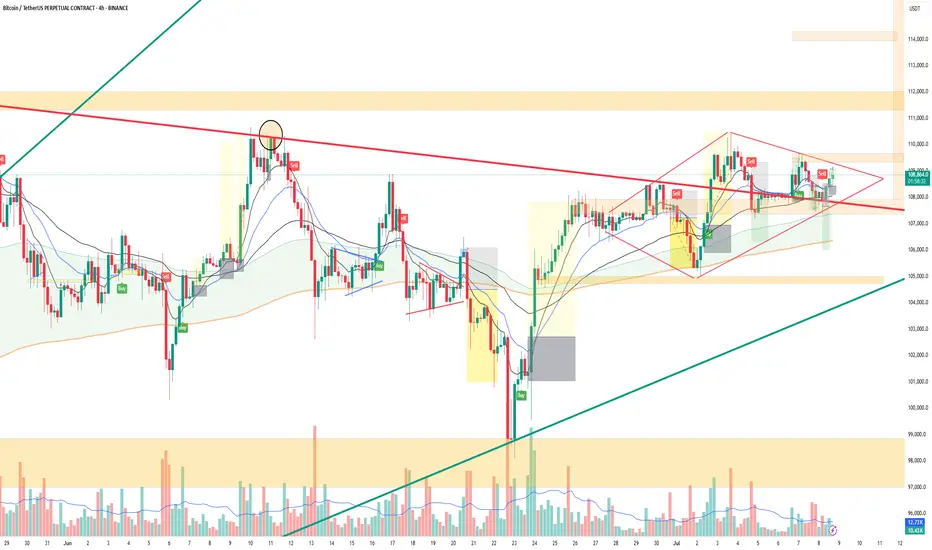
Diamond Pattern Context (4H BTC Chart)The structure forming from June 27 to July 8 appears to be a diamond top, a reversal pattern often seen after uptrends.
Price expanded (broadening left) and then started converging (right side) — classic diamond symmetry.
It has developed right at the macro trendline resistance (~109.5K), increasing its reliability.
Volume has declined during the right half of the diamond, which is consistent with pattern expectations.
✅ Implications of Diamond Pattern
Bearish Bias (Diamond Top):
If price breaks below the lower boundary (~107.8K), it confirms the pattern → potential move to 104.5K–102.5K zone.
Measured move ≈ height of pattern (109.8K–106K) ≈ 3.8K drop.
Invalidation/Bullish Flip:
Break and hold above 109.5K with volume would invalidate the bearish diamond.
In that case, it flips into a squeeze breakout with upside to 110.8K–111.5K+.
🎯 Conclusion:
The diamond top, combined with macro resistance and declining volume, strengthens the bearish breakdown scenario.
However, no confirmation yet — remain neutral to bearish unless either:
✅ Clean breakout >109.5K
🔻 Breakdown <107.8K with volume
BTC Forming Second Diamond: New ATH Targeting $115K–$120KAfter topping out at the previous ATH, Bitcoin formed a classic diamond top pattern which triggered a drop to the $98,115 level. Now, Bitcoin appears to be forming a second diamond — but this time, the breakout structure suggests a bullish reversal rather than a top.
This second diamond formation indicates consolidation before a strong upward move, potentially driving BTC toward a new all-time high between $115K and $120K.
Watch for confirmation of the breakout. If price holds above key resistance levels post-pattern, the bullish scenario gains strength.

BTC PRICE PREDICTION
According to my personal analysis, Bitcoin has the potential to reach between $112,000 and $120,000.
Everyone should hold onto their coins confidently and avoid panic. The market is expected to move upward. Stay focused and trust the process.

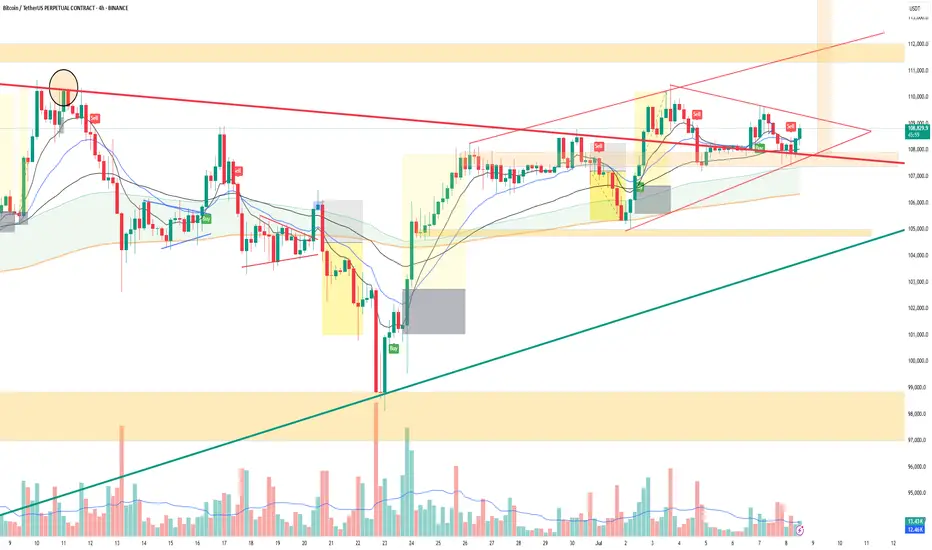
BTCUSDT 4H Analysis | Apex Decision ZoneStructure & Price Action
BTC is consolidating within a symmetrical triangle (red trendlines).
Price is squeezing near the apex, suggesting an imminent breakout.
Strong defense at ascending channel support (~108K zone) + green trendline.
Lower highs indicate sellers still active, but higher lows reflect buyer strength too.
Price bounced from previous demand block (green box), now pushing toward resistance.
📊 Indicator Confluence
RSI: Curling up from mid-range (~52–55), no divergence, neutral-to-bullish tilt.
DMI/ADX: ADX rising slightly, -DI weakening vs +DI → potential trend shift brewing.
MACD: Histogram flat; momentum hasn't confirmed either side yet.
Wave Trend: Bouncing from mid-line, bullish cross may form if price breaks triangle.
Volume: Gradual decline = typical pre-breakout compression. Watch for spike.
Stochastic: Flipped bullish from oversold — early bullish bias.
🎯 Summary & Probabilities:
BTC is coiling near triangle apex — breakout likely soon.
🔼 Break above 109.4K with volume → 60% chance of move to 110.5K–111.5K.
🔽 Drop below 107.9K → 40% chance of fall to 106.3K–104.4K.
Bias: Neutral-to-bullish — confirmation needed.
Is the Fear & Greed Index Becoming a Victim of Its Own Success?I’ve noticed something about the Fear & Greed Index that rarely gets discussed:
Its reputation as a “contrarian indicator” may actually dampen market declines. When everyone sees “Extreme Fear” and believes it’s time to buy, the panic doesn’t deepen as it might have in the past—potentially muting major market lows.
This creates a feedback loop:
The index signals “buy the fear,”
Enough traders pile in,
The market stabilizes before real capitulation sets in.
When a widely-followed counter-indicator becomes common knowledge, it can lose its edge. In today’s markets, these signals may serve more as social safety nets than as true predictors of sentiment extremes.
Bottom line: If the “fear” signal stops working, or stops triggering buying, it could be a warning that the market’s safety net is gone. I wonder, is the VIX subject to the same mitigating effect?
The Fear & Greed Index has never been truly tested during a long term bear market.
But then it may partly be why we have not had one in so long.
Would love to hear your thoughts—has anyone else noticed this effect?
Like the previous cycles!Our basis is the Fibonacci retracement with 78%. The 78% level should be aligned with the previous peak.


My Long term BTC-USDTP PLANmy long term plan or the rest of the year leading into April im working on.. still needs a little more confirmation but today pull was very significant indeed

Bitcoin is ready to fill the biggest gap and the largest liquidiBitcoin is ready to fill the big gap and the biggest liquidity, the range of 25,000 and 19,000 can be a good time to buy Bitcoin.
🤪🤪🤪

BTC/USDT Technical Analysis, 2025-07-07 11:30 UTC📊 BTC/USDT Technical Analysis, 2025-07-07 11:30 UTC
🕒 Binance Spot
📆 July 7, 2025 | 11:30 GMT Candle Observations
───────────────
💡 Price: 108712.97 USDT
📉 EMA200 (Dynamic): 108938.31
🟩 Support Watch: 107512.97
🟦 Resistance Target: 109782.97
───────────────
🔍 We're observing price action developing below EMA200, with a recent Piercing Line formation at a noted dip zone. This setup may suggest buyers are attempting to reclaim short-term control.
⚠️ Key tactical support remains near 107512.97, where historical reaction zones and liquidity zones intersect.
📈 A move toward 109782.97 is being monitored as a potential resistance test, in line with local OBV divergence and recovering bid pressure.
📌 Market Microstructure Notes:
• Order Book Imbalance leaning toward bids (+0.45)
• OBV Trend: +10.17% vs 5-period MA
• Thunder Engine Volume Acceleration: ⚡ Observed
• Whale Ask Cluster: ~640k USDT near top of range
📉 No guarantees of breakout or reversal watching how price reacts around key levels. Maintain cautious positioning near support/resistance pivots.

Bitcoin: The night before the plunge? →104,000?
Bitcoin fell under pressure from highs, with short-term bearishness but strong long-term fundamental support.
1. Market fundamentals
Institutional holdings continue to grow
BlackRock Bitcoin ETF (IBIT) exceeds $72 billion in size, dominating the market
MicroStrategy holdings increased to 597,000 BTC (about $63 billion), continuing to increase holdings on dips
Global Bitcoin ETF Net inflow of $4 billion in June shows strong demand for institutional allocation
Policy and regulatory progress
The U.S. Treasury Department plans to include Bitcoin in the "strategic reserve assets" to enhance its legal status
The SEC will make a ruling on spot ETF option transactions on July 15, which may bring new liquidity
The Trump administration plans to impose a 60% tariff on China, and market risk aversion may heat up again
On-chain data changes
A 14-year dormant address recently transferred 80,009 BTC (about $8.69 billion), triggering concerns about selling
The lightning network capacity exceeded 5,000 BTC, and Tether (USDT) completed the lightning network integration
II. Technical depth Degree analysis
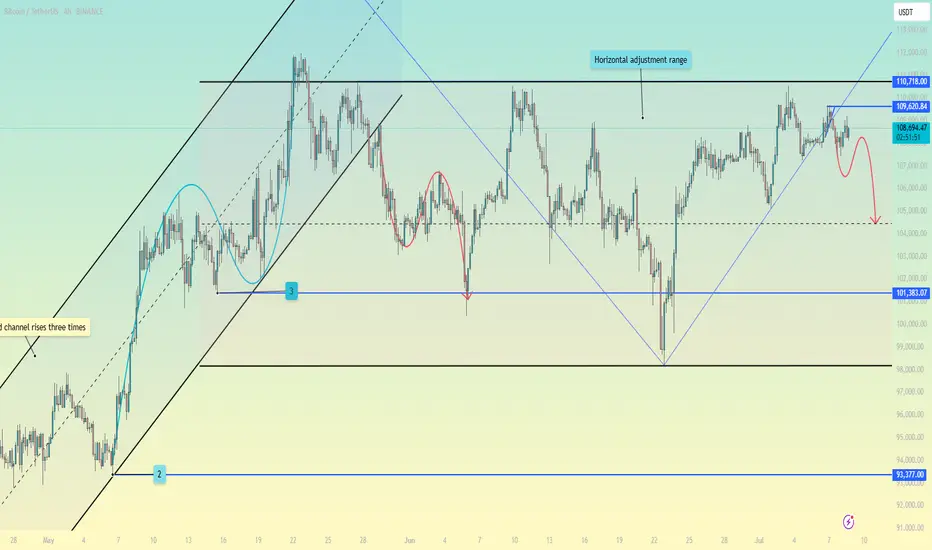
(1) Medium-term trend structure (4-hour level)
Rising channel break: After the price peaked at $112,000, it continued to fall below the rising trend line support
Range oscillation formation: Currently, $98,000-110,700 constitutes the main trading range, and the middle track support is $104,000
Volume change: The recent decline is accompanied by an increase in trading volume, indicating that the short-term momentum is increasing
(2) Short-term trading signals (1-hour level)
Double top pattern confirmation: $110,700 was tested twice without breaking, forming a typical reversal structure
Moving average system short arrangement: EMA5/10/30 formed a death cross, suppressing price rebound
Key support level:
▶ First support: $106,500 (Fibonacci 38.2%)
▶ Second support: $104,000 (psychological barrier + previous low)
▶ Strong support: $98,000 (lower track of the range)
III. Trading strategy suggestions
1. Aggressive short position layout
Entry range: $109,000-109,500
Stop loss setting: $111,000 (above the previous high)
Target: $106,500→$104,000
Technical basis: downward trend line suppression + RSI top divergence
2. Steady retracement of short positions
Entry signal: 108,000-108,500 rebound encountered resistance
Stop loss setting: $110,000 integer barrier
Target: $104,000 (break down to see 98,000)
3. Long defense area
Key observation position: 104,000 US dollars (if there is a large volume to stop the decline, you can try long with a light position)
Breakthrough signal: Stabilizing 110,700 US dollars will restart the upward trend
IV. Multi-dimensional market outlook
Short-term (1-2 weeks):
Affected by technical suppression and whale movements, it is expected to maintain 104,000-110,700 range fluctuations
Focus on the effectiveness of 106,500 support, breaking down will accelerate the test of the lower track of the range
Medium-term (Q3 quarter):
Institutional continued holdings + Fed rate cut expectations constitute long-term support
If it breaks through 112,000 US dollars, it will open up to 120,000-125,000 upside space
Risk warning:
The SEC option trading ruling on July 15 may cause violent fluctuations
Global macroeconomic data (especially CPI) will affect market risk preferences
V. Professional trading suggestions
▶ Currently, the "rebound short" strategy is preferred, and stop loss is strictly set
▶ Long-term investors can arrange in batches in the range of 98000-104000
▶ Pay close attention to:
Daily ETF fund flows, changes in on-chain whale addresses (glassnode alert system), US CPI data (released on July 12)
Conclusion: Although the short-term technical side is bearish, the long-term fundamental support of Bitcoin remains solid. It is recommended that traders seize the opportunity of range fluctuations, operate flexibly at key support/resistance levels, and wait for new trend signals to be confirmed.
