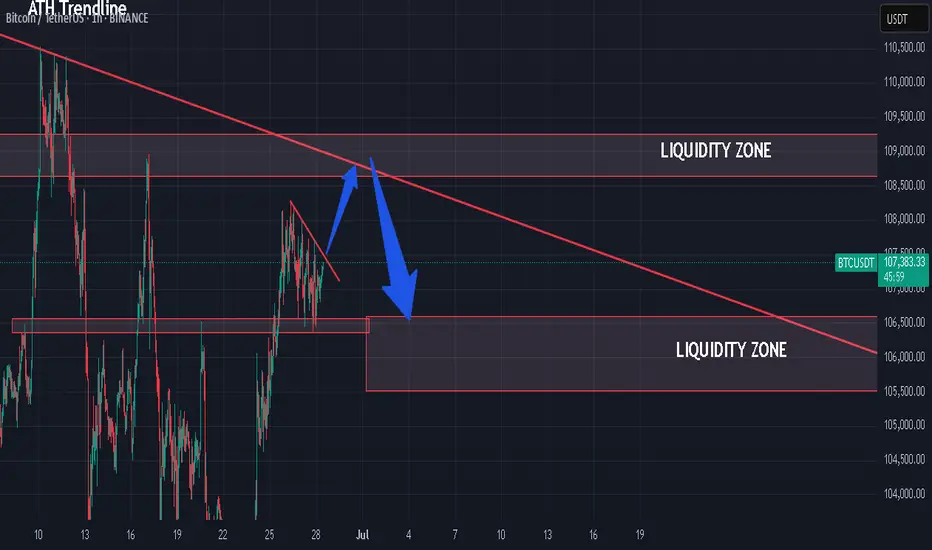
BTC to sweep liquidity?4 Hour Analysis:
- Market moving out consolidation phase (Accumulating late buyers)
- May sweep the 1st buyside liquidity (see chart)
- Or may sweep the ATH above the 1st buyside liquidity (see arrow on the right of the chart)
USTBTC trade ideas

Analysis of Bitcoin Market StrategyTechnical Analysis of Bitcoin (BTC) Contracts: In terms of today's market, the daily chart of the large cycle closed with a small bullish candle yesterday. The K-line pattern shows consecutive upward movements, with the price above the moving averages. The attached indicators are in a golden cross, indicating an obvious upward trend in the long term. However, the current upward momentum and sustainability are relatively weak. Therefore, it is recommended to maintain short-term trading and strictly control risks.
In the short-term hourly chart, the overall price has been consolidating at high levels. The current K-line pattern is in consecutive bullish candles, with the price above the moving averages, and the attached indicators are in a golden cross. Therefore, an upward movement is highly probable today, with the support level near the 106,300 area.
you are currently struggling with losses,or are unsure which of the numerous trading strategies to follow,You have the option to join our VIP program. I will assist you and provide you with accurate trading signals, enabling you to navigate the financial markets with greater confidence and potentially achieve optimal trading results.
Trading Strategy:
buy@106300-106500
TP:108000-108500

Bit coin buy for long term.It is very break out to almost double. The profit booking will be update when it reaches target.

6HR CPR StratMultiple examples of trending price action using the 6Hr CPR Start, combining with momentum ribbons using PAR.

Bitcoin Update
Just to make it simple panda fam, Lets analyze it ! 💭
— Scenario #1 - PBr2 still possible we get rejected since we are on PBr2 keylevel resistance ranging 108099 - 107465, Same time we are under major trend resistance also. 📉
— Scenario #2 - PBr1 bounce support at 102188 - 101786 this will be valid if we get rejected at PBr2 and retest as normal correction movement. 🐂
— Scenario #3 - Breakout above major trend resistance, valid if we sit on trend major resistance as support . Short term possible target at 112004. 🚀
Always trade safe and stay updated to our updates panda fam ! Kupit kupit lang muna tayo sa altcoins. 🙌

BTC Breakdown Stp Bearish triangle Sell below $60.5k target 58k$Chart Overview:
Asset: BTC/USDT (Bitcoin)
Chart Type: Candlestick
Timeframe: Likely intraday (short-term, possibly 15m or 1h)
Indicators/Tools Used:
Trendlines
Support/Resistance levels
Pattern formation (possible descending triangle)
---
Technical Analysis:
🔻 Bearish Bias (Sell Signal):
Pattern: A descending triangle pattern is visible—typically a bearish continuation pattern.
Lower Highs: Indicates selling pressure increasing over time.
Flat Support Zone: Around $60,500–$60,600. Price is testing this zone repeatedly.
Breakdown Likely: If price breaks and closes below this support, a sharp drop can be expected.
---
📉 Put Direction: Sell BTC
Entry (Sell): On break below $60,500
Target 1: $59,200 (near previous consolidation zone)
Target 2: $58,000 (measured move from triangle)
Stop Loss: $61,000 (above descending trendline)
---
✅ Summary:
BTC is under pressure below resistance and forming lower highs.
If it breaks $60,500 support, a downward continuation is expected.
Strategy: Sell on breakdown, target $58,000 short-term.

BTC LONG TRADE BTC LONG TRADE
ENTRY : 106398.1
PROFIT : 107512.7
STOP : 106028.8
ALL trading ideas have entry point + stop loss + take profit + Risk level.
hello Traders, here is the full analysis for this pair, let me know in the comment section below if you have any questions, the entry will be taken only if all rules of the strategies will be satisfied. I suggest you keep this pair on your watchlist and see if the rules of your strategy are satisfied. Please also refer to the Important Risk Notice linked below.
Disclaimer

BTC/USDT high win scalping signals in 15 minutes are as follows- Signal: LONG
- Admission: 107,260 ~ 107,340
- Take Profit: 107,620, 107,880

Bitcoin ready to move towards 85,000Be prepared to fall after breaking the trend line and back to the target of 85,000.
Bitcoin ready to move towards 85,000🤪🤪🤪🤪🤪

Bitcoin Next Move These are the two levels I am currently looking at to trade.
If we sweep the local high at 109k then we will be trading into a zone of supply as well which is good confluence in terms of a setup, most important is going to be the reaction of price off of that level.
My higher probability setup will be around the 111k level as that is where we have multiple sets of Poor highs and it is closer to the range high. I always prefer trading near the extremities of the ranges for higher probability setups.
I would also consider a long from 103k if we get a fast flush into that level but I prefer 101-102s to long as that is at the range low.
Note:
1. Always observe reaction at key levels before entry to avoid forced trades.
2. Maintain disciplined stop loss placement especially near supply sweeps and flush longs.
3. Prioritize setups at range extremes (102k or 111k) for optimal entries aligned with your edge.

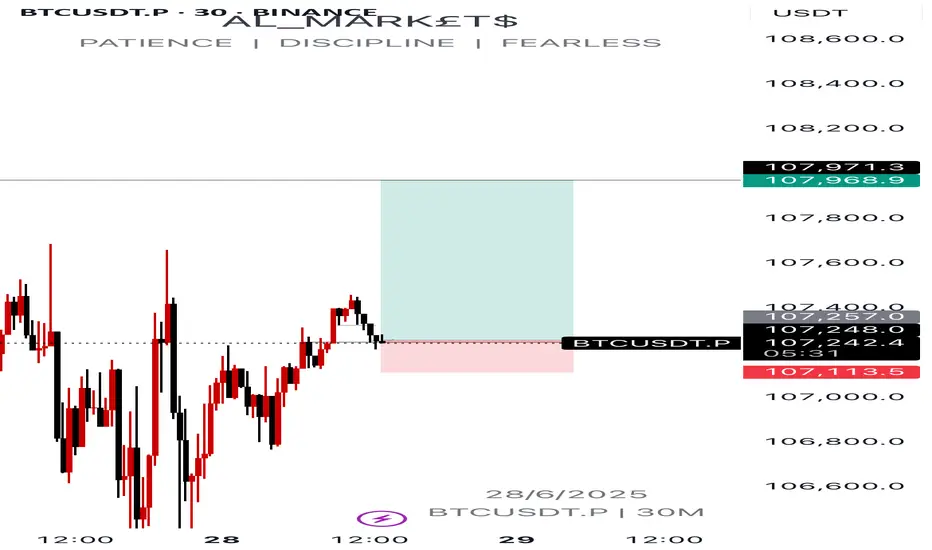
BTCUSDT.P potential short term buysCurrent price action is pointing out to potential short term buys on btc.
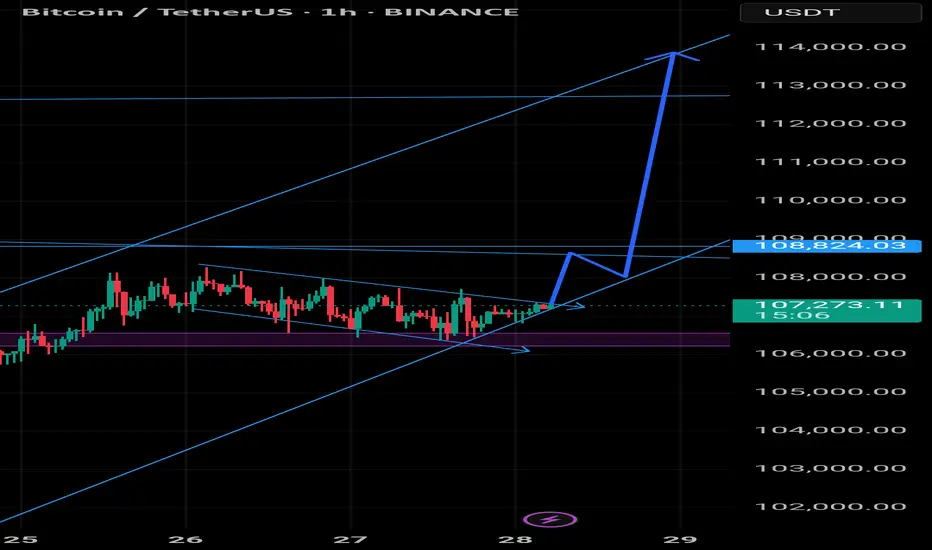
BTCUSDT 30min Breakout Watch | Micro to Macro AlignmentSummary
Bitcoin is showing a classic multi-timeframe confluence setup. On the weekly chart, BTC is holding above key EMAs with bullish continuation patterns. The daily chart shows a breakout from a descending triangle, while 4H and 30-min charts confirm a narrowing price wedge inside a larger compression zone. Momentum is rising, but volume remains subdued. A confirmed breakout above $108K may trigger a measured move toward $114K–$118K, while a breakdown below $105K could lead to deeper retracements.
BTC 30m chart forming a tight triangle with bull flag structure inside.
Price hugging EMAs, RSI ~52, Kalman flipped green, ADX ~23 = prepping for move. Breakout above $107.6K can push fast to $108.3K+. Breakdown below $106.6K weakens structure.
Scaling out
4H: Descending wedge with bullish RSI divergence, ADX rising, support at $104.5K.
1D: Breakout from falling wedge, reclaiming EMAs, but needs volume.
1W: Bullish flag breakout setup; EMAs aligned; RSI > 57, room to run toward $114K if $108K clears.
Watch volume confirmation across timeframes for trend validation.

Bitcoin's Growth Potential Intact Despite Short-Term UncertainyBitcoin has rallied to $108k after sweeping liquidity below $98k, driven by easing geopolitical tensions in the Middle East. The cryptocurrency's fundamentals and structural trends suggest room for growth, but it appears to have exhausted its momentum, entering a consolidation or accumulation phase. Technically, the 4-hour chart is limited, but a potential correction to $104k-$103k could occur before further growth. For now, traders can focus on short-term buys and sells in the $106k-$108k range, awaiting clearer direction.

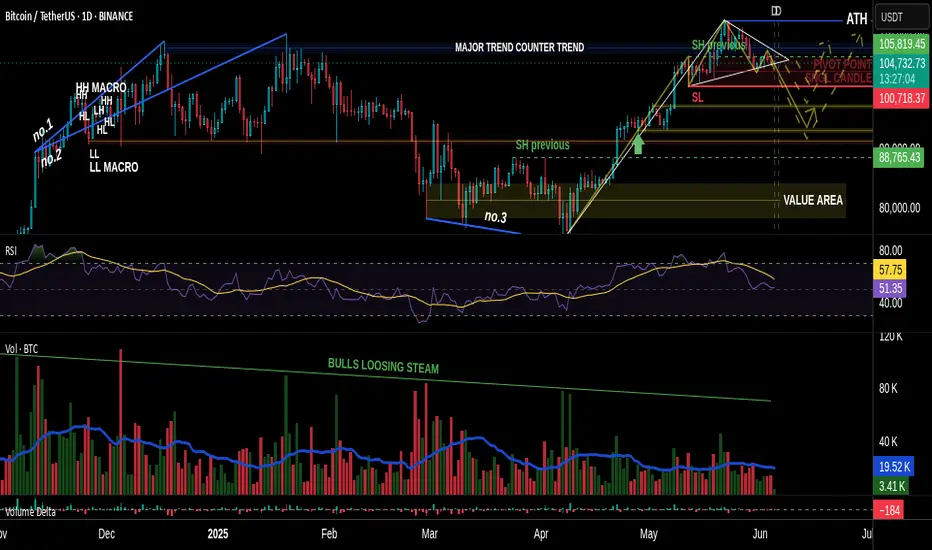
VSA vs BTC: Into a Bearish Scenario or Not?Predicting the market requires skill.
Most traders fail at one crucial point: they don’t see the market as a living, breathing organism—a structure where one move leads to another, like cause and effect in motion.
That’s what we often call reading the psychology of the market. When you begin to grasp the fundamental principles behind that, you step into the realm of elite traders.
And yes—Volume Spread Analysis (VSA) is a powerful tool, but only if you know how to read it properly.
I’m not a certified trader or financial advisor, and I don’t give signals, entries, or exits. I’m simply a solo observer, sharing a slice of what true technical and fundamental analysis looks like.
And yes—it takes time. It takes skills. Now, if we want to even attempt predicting the future of price action, we must understand something: A chart is not a single truth. It’s a battlefield of conflicting signals.
Patterns, marks, levels—some suggest bullish continuation, others hint at sharp reversals. Confusion is inevitable if you don’t learn to distinguish which signs matter.
In our current BTC chart, we’re witnessing this contradiction unfold clearly:
• A bullish flag formation...
• Yet within it, the emerging completion of a Head & Shoulders pattern!
How arrogant can the market be! 😄
A moment to laugh—but also a moment to observe how cleverly the crowd is misled.
This is classic manipulation, wrapped in a textbook setup.
But what’s most telling isn’t the pattern on the surface—it’s the volume beneath the structure.
It’s always the quiet details that speak the loudest.
Before price shows its true face, volume often leaves footprints. In our case, those footprints were already leading toward a bearish path—long before the structure began to shape itself clearly.
So while retail eyes focused on the bullish flag, the underlying volume had already begun withdrawing support.
Not aggressively—no. Subtly, almost elegantly, in that familiar way institutions mask intention:
• Spikes that don’t hold
• Buying that doesn’t follow through
• And a steady fade in commitment as price climbs into weakness
It’s in those quiet inconsistencies where VSA earns its value.
It tells us: the move isn’t about what’s obvious.
It’s about what never fully materialized.
So yes, the pattern may still remain incomplete. The Head & Shoulders may yet fail to validate.
But for those who were watching volume first—not structure—the script was already being written.
✒️ From now on, professionally speaking, we must still wait:
• For the Head & Shoulders to confirm or dissolve. So eyes targeted at the swing low level near 107k
• And for volume to either legitimize or invalidate the entire setup
Only then does the chart grant us permission to speak in certainties.
🐾 But so far…
• The clues have favored the bears.
• Sell opportunities appeared early and often—for those who know what to look for.
• Bullish spikes in volume? They were met with silence.
• Momentum fizzled under a macro backdrop of fading demand.
If you were in the right mindset, and aligned even the lower timeframes to basic structural zones,
you already saw the path ahead wasn’t being carved by the bulls.
Let them finish the patterns.
Let the candles paint the story.
But for those trained in volume, the ink has already dried.
And if you're still reading, maybe you already sense it—
real insight doesn’t shout, and it never floats in abundance.
Value has never been about noise. It’s about what’s rare, quiet, and overlooked by the crowd.
Just like in the markets—the true signals aren’t loud, and they’re never free in the economic sense.
Just as price rises where supply thins, the same applies here:
what’s scarce... holds weight.
PS For last A little exercise, something to grasp on. Have you noticed how Volume & RSI behaves in lower time frames? 4Hour or 1Hour for example. Can you identify how volume confirms a bearish move. Do you discover the correct correlation and combined use between VSA & RSI. Remember my previous insight
See you next time!

BTC Trade Setup 28.06.2025 BTC Possible Trade Setup.
Entry 108.600 - 109.000
TP.1 106.500
TP.2 105.500
SL 110.000
its my own analysis, i am not liable of any loss.
Btcusdt A break above the trend line could lead to a potential run up in BTC price but a break below the purple support could lead to a drastic drop in price
BITCOIN PRICEACTION TRADING STRATEGIESBitcoin’s price is influenced by macroeconomic factors, including U.S. inflation trends and institutional adoption (e.g., Bitcoin ETFs with $138B in assets). Its volatility remains high, with 10% daily moves possible, driven by 24/7 trading and sentiment shifts. Recent recovery from a dip below $102,000 was tied to geopolitical tensions, but macro signals suggest a risk-on environment supporting further gains.
Outlook: Bitcoin is at a critical juncture, with technical indicators leaning bullish but resistance at $108,000 posing a challenge. A decisive breakout above $108,950 could signal a move toward $111,000-$115,000, failure to hold this level will retest 100k$ level or below.and below 100k could turn bearish .

BTC - Its Constipated!This is BTC 4H SVP
Birds eye view says its just negating all moves, neither down or tops,
In simple words: right now BTC is stuck in a tight box. If it breaks down, we may see a fast drop to $106,000. If it breaks above $107,600, it may go higher. Until then, avoid entering blindly and wait for one side to win.
Chances are way higher for it to move up! Hoping to make EQH and a small fall.

BTC next bull runBTC is expected to undergo a short-term retracement before reigniting its bullish momentum and advancing toward new highs

BitSupport and resistance levels are identified on the one-hour timeframe, and the momentum increases in either direction when broken.

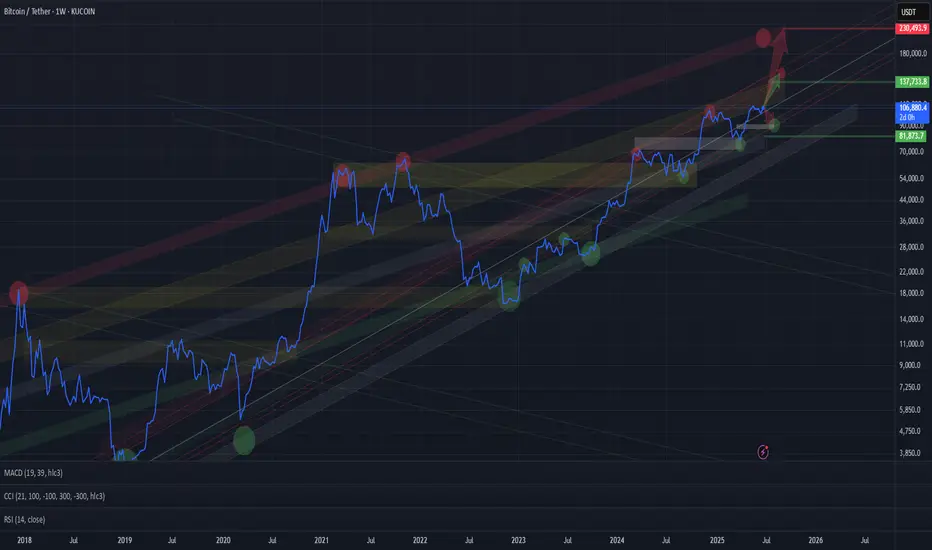
BTC BTC/USDT LONG_TERMChannels are drawn, long-term targets are clear. The upper extreme visible so far is around $200K for Bitcoin — possible within this cycle.
More realistic targets for this cycle are around $135K.
In the short term, a correction to the lower red channel zone ($88K–94K) is possible.
Watching closely.
BTC - A New Oregon Trail or Fool's Gold?The ranch hand (chart) reckons Bitcoin hit a big wave‑3 peak, then swung into a corrective wave‑4 saddle.
Now it's circling the watering hole, teetering around a key resistance near $110k—the cowboy‑critical line in the sand.
If that line holds strong, expect another surge—an “inverse wave‑4, strong 5” push higher toward $115–120k.
But if it buckles, a darker scenario’s afoot: a red‑inked, five‑wave drop galloping down toward $85k.
Bottom line: keep your hat on—$110k is the frontier. Break above that, and the herd’s heading north; if not, saddle up for a ride downhill.
BYBIT:BTCUSDT.P
BITSTAMP:BTCUSD
