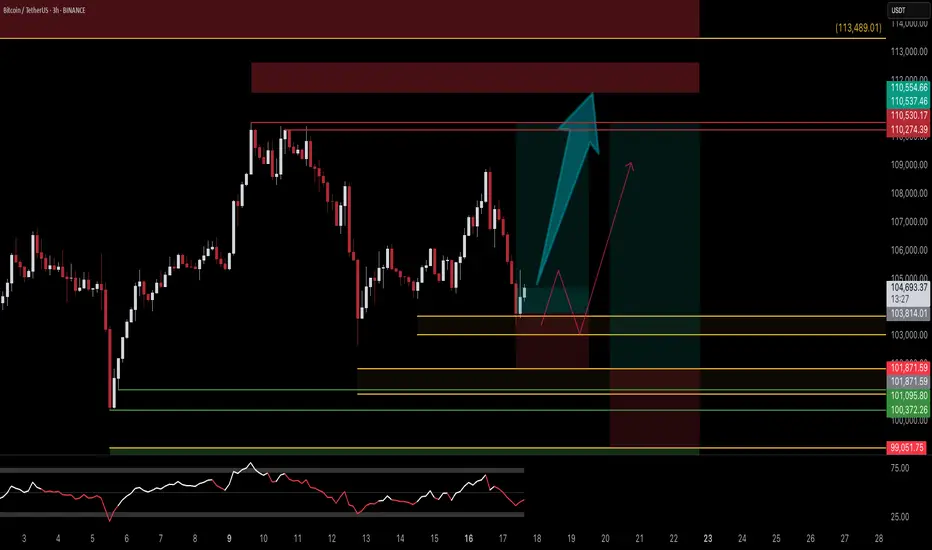
$BTC Breaks Out $110K in Sight?CRYPTOCAP:BTC has broken out of its descending channel and is now trading around $105K.
This breakout signals a potential trend reversal, with a projected move toward $111K.
Holding above the breakout zone could confirm further bullish momentum.
DYRO, NFA
USTBTC trade ideas

Is BTC having War INDUCED PA? - 110k?
Owing to this the movement has been commenced due to the ceasefire! Whats next?
The move can be seen on the bit up 106,500 can be eyed, just expect a bit

Is Bitcoin Signaling Risk-Off? Structure Breakdown Explained💥 BTC/USD Outlook – Is Bitcoin Losing Steam? 🧠📉
I'm keeping a close watch on Bitcoin (BTC/USD) this week, and the current price action is flashing some key signals.
🔍 Over the past several sessions, BTC has struggled to hold momentum, and we’re now seeing a shift in tone. On the 4-hour timeframe, the market structure is tilting bearish, with a pattern of lower highs and lower lows developing — a classic sign of weakness ⚠️📉.
📐 The most recent downside leg has caused a clear break in structure, and BTC is now retracing back into a potential supply zone, hovering around equilibrium of the recent move. This zone will be critical to watch for signs of seller re-entry.
⏳ On the 30-minute chart, I’m waiting for a decisive shift in structure — a break of local support or a failed rally that confirms bearish continuation. Should that play out, it could signal a high-probability short setup.
🪙 A breakdown in BTC often has broader implications — especially in the risk asset space. If we see weakness here, JPY pairs may strengthen as capital rotates into safer assets 💴🌐.
⚠️ Disclaimer:
This is not financial advice. The information provided is for educational purposes only. Please conduct your own analysis and consult a licensed professional before making any investment decisions. 📚💼

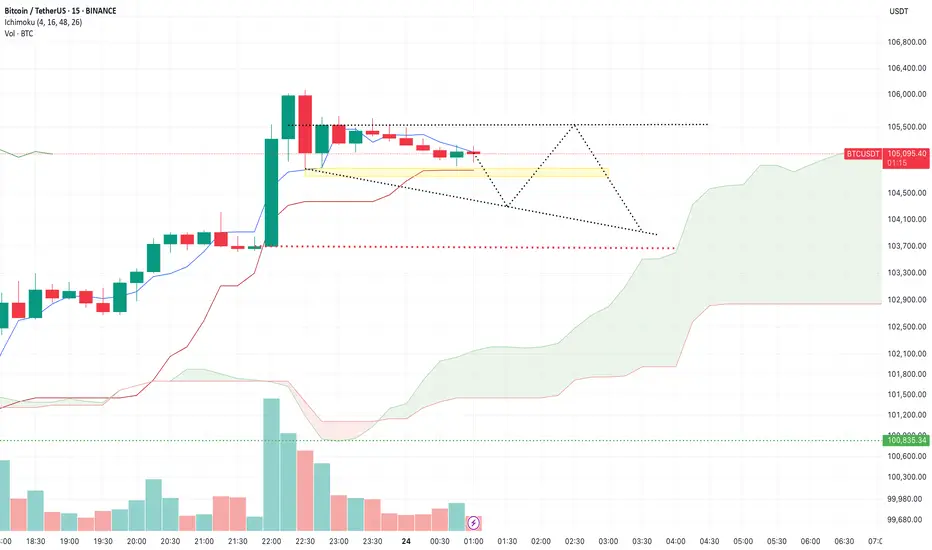
BTC/USDT – Intraday Plan (15m, Ichimoku) by RiscoraWe’re approaching a major liquidity zone in the yellow highlighted area. I expect this zone to be swept soon — likely triggering a wave of stop-losses and liquidations. Once this liquidity is taken, I anticipate a sharp move down on increased volume.
After this liquidity event, my base case is a buyback from lower levels, with price rebounding towards the upper boundary at 105,500. From there, I’m watching for renewed selling pressure to create another push down, forming a descending wedge pattern and a retest of the 104,000 zone.
The key price range I’m focused on for the coming session is 104,400 – 105,500.
I expect BTC to spend most of tomorrow trading within this range, as it consolidates after the volatility spike.
However, if in the next few hours we see a 1H candle close decisively below the red-marked level at 103,700, this would be a strong bearish signal. In that case, I expect the move to extend further down toward the 102,300 area.
Whether price eventually breaks higher or lower from this range will depend on macroeconomic flows and the market’s reaction inside the outlined zone. I’ll continue to update as the situation unfolds.
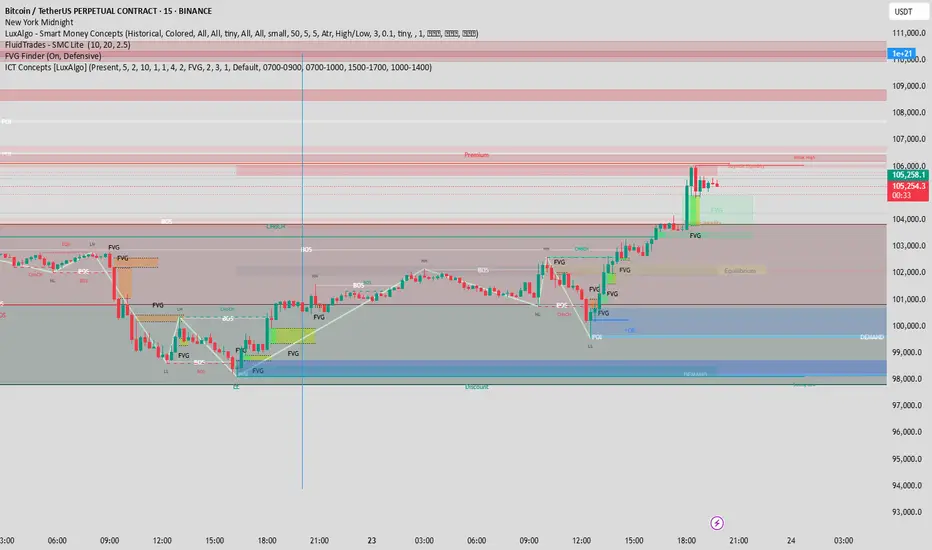
Breakdown: BTC/USDT 15m – Riding the Trend
🔹 Smart Money Confluences:
CHoCH at the bottom with a clear liquidity sweep (LL formed, then reversal)
Multiple FVGs aligned with structure—price keep respecting mitigation blocks
POI + OB near $99,800 gave the final long confirmation
BOS and strong HHs show clean bullish order flow
🟩 Premium/Discount Zones:
You entered at da discount, targeting premium—textbook ICT
Midline equilibrium held nicely before bullish continuation.
💡 Final Push:
Price is consolidating under weak high and buy-side imbalance.
Possible continuation if new FVG near $105k holds
🔔 Watch for:
Higher timeframe liquidity grab above $106k
Rejection near inefficiency = potential partial TP zone
BTC cup and handle After today’s bounce off the bottom trend line, it looks like a clear cup and handle pattern forming on BTCUSD Usually indicating a measured move around the height of the cup. Target 140k. I would be buying around the bottom of the bear channel if it retests the trendline.

Today's BTC trading strategy, I hope it will be helpful to youBitcoin is currently fluctuating around $105,500, rebounding 4.5% from yesterday's low of $101,000 and successfully breaking through the key psychological threshold of $105,000. Looking at recent trends, the price touched $105,000 in early June before pulling back, and now standing above this level again indicates that bullish forces are attempting further breakthroughs. Notably, this rally has been accompanied by continuous inflows of institutional capital—BlackRock's Bitcoin ETF (IBIT) has reached a scale of $71.9 billion, holding 660,000 BTC, making it the largest institutional holder in the market. Such "whale"-level position changes provide solid support for prices.
The market is currently in a phase where an "institutional bull market" intersects with an "emotional market". $105,500 is both a breakthrough point and a divergence point between bulls and bears. Investors need to maintain rationality amid greedy sentiment: in the short term, take advantage of volatility for high-throw and low-suction trading, while in the long term, adhere to the overarching logic of increasing institutional holdings and loose liquidity to seize opportunities amid fluctuations.
Today's BTC trading strategy, I hope it will be helpful to you
BTCUSDT BUY@104500~105500
SL:102500
TP:106500~107500

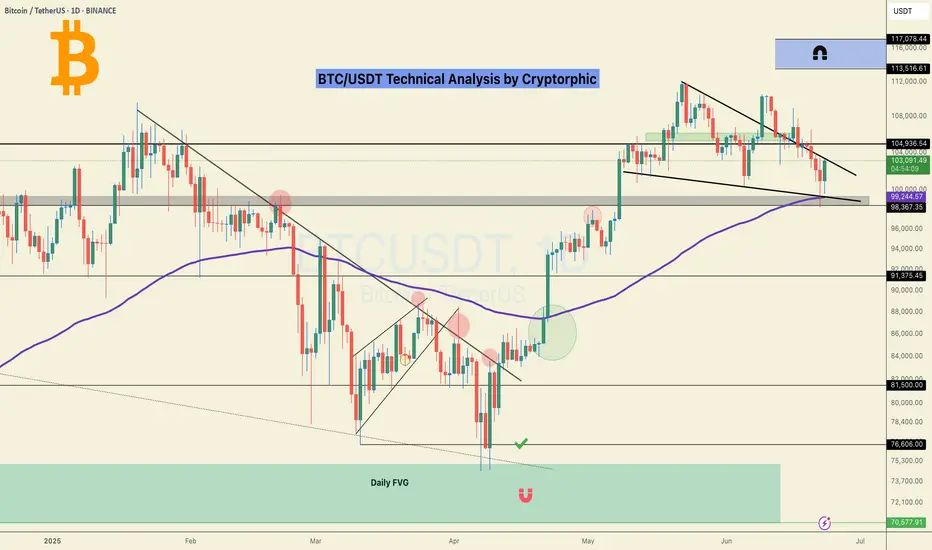
BTC is breaking out of a falling channel 🚀
Bitcoin has pushed strongly off the lower boundary and is approaching the top of a descending parallel channel on the daily chart 📈
A confirmed breakout could lead to a continuation rally toward key upside targets ✈️
🎯 Targets:
1️⃣ $111,233.01
2️⃣ $114,942.31
3️⃣ $118,490.33

Bitcoin (BTCUSDT) - Price Testing Resistance after Morning StarBitcoin (BTCUSDT) price is currently testing the resistance zone of $105,000 to $110,000 (yellow lines).
A morning star candle pattern has formed above the 100 ema (orange line), which is also $100,000 price support.
Some bullish momentum is forming on the MACD Histogram, however, Bitcoin is still technically in a short-term downtrend for the past 30 days.
Bitcoin price needs to create a new uptrend on the daily chart, a series of higher-highs and higher-lows in the price, which could take several months.
At this time, Bitcoin is still reacting to global news and stock market correlations.

BTCUSD next target releasedNo comment needed. All information is in the chart analysis.
Steps to follow:
Analyze yourself.
Take the position with SL and Take Profits.
Wait, it may take a couple of days, so take a break and step away from the screen from time to time, just like I do :)
Get the result.
I will update the trade every day.
Like, comment with your good mood or viewpoint, share with your circle. It’s together that we get stronger!
Good trades, Traders!
The golden bear

Little market update on btc 23/07/25. hope you enjoycheers just a quick one yo update people on my current thoughts on btc

BTC Short to 93.3My target is at least SSL on 93.3
WTF, there is no need to post a huge text description to understand what is depictured on the chart!

Bitcoin Crash Will Continue to Levels that will REKT majority!??MARKETSCOM:BITCOIN crashed towards $98k so far! Almost 10% drop so far! Crypto noobs and mass media manipulators will blame this CRYPTOCAP:BTC crash on the Iran and Israel conflict! Professional traders will, however, tell you that this was orchestrated and the crash was already planned beforehand, and the best traders caught the crash from the top at $109k and made a profit on this Bitcoin correction! Professional insider trading against news manipulation, artificial conflicts, and emotional trading !

BTC is the champion our portfolio needs. BTC has some work to do. Either it will correct for a nice confrimatio low or strucure out for a bull fag. Either way, the price remains within a downward-sloping channel. That keeps me neutral bullish. But until I see a pivot point structure with signs of divergence in oversold conditions, it's difficult to get a proper RR.
Full TA: Link in the BIO

#BTC Bounced, 100EMA saved the day!100 EMA saved the day.
But the one concern? We’ve printed a new Lower Low, not a great sign.
The chart looks bouncy, but the overall structure still feels uncertain.
No point guessing or forcing trades here, I’d rather wait for clear confirmation.
I’ll share updates if I spot any changes or interesting altcoin setups.
For now, patience is our best edge. I know many altcoins might look great, but BTC Dominance is not yet done. I'll be sharing that chart tomorrow.
Stay sharp.
Hit that like button if you find this short update useful.
Thank you
#PEACE
Markets Rally as Iran’s Strike Falls Short of Expectations🟢 Markets Rally as Iran’s Strike Falls Short of Expectations
One key point here is that global markets were bracing for a much more severe response from Iran toward the U.S. But when the actual attack turned out to be less intense than expected, risk assets — including crypto and stocks — started to climb, while oil prices dropped. Normally, heightened tensions in the Middle East would push oil prices higher, but this time, the opposite happened.
Another important factor is Bitcoin’s exchange outflows. As I’ve mentioned before, BTC leaving exchanges is a bullish sign — it means fewer coins are available to sell, which can fuel quick upward moves when a long trigger appears.
📍Wait for a clean long setup, and avoid emotional trades.
---
💬 Do you think the market is reacting rationally or emotionally right now? Drop your thoughts in the comments!

btc dirrectionnow days btc was bleeding much but to day was was recovering little as you see my last analyst it approaches the exact direction and I hope the coming days will go as I will insh Allah be ready for big bull run after it finish the last liquidity swept

BTC MTF AccumulationThis is the current accumulation model i am watching to bring BTC back to ATH's and form the second deviation of the HTF distribution model. I would prefer if we could go lower and form a range from there, but at the moment thats all i got.

BTCUSDT Short Setup at Fresh Supply ZoneBTCUSDT is currently trading near $102,397, approaching a clean supply zone between $102,887 – $104,030, where strong historical rejection has occurred.
A short entry around $102,887 offers a high-probability setup with a stop above the zone at $104,030, targeting $98,780 as the take profit level. This aligns with a previous demand structure and offers an excellent Risk:Reward ratio of approximately 1:3.6.
Trade Setup:
- Entry: $102,887
- Stop Loss: $104,030
- Take Profit: $98,780
- Risk:Reward Ratio: ~1:3.6
This setup expects sellers to defend the supply zone, rejecting bullish attempts and triggering a downward move.

Bitcoin | Long | 3hrsThis technical analysis is for informational and educational purposes only. It does not constitute financial advice. Remember to always research and consult with a professional before making investment decisions. Good luck! 📈💼🚀
Bitcoin Crash To $93k Incoming?!!!!I am discussing the bearish signs i am seeing right now on Bitcoin, and talking about the confirmations I want to see, that will confirm that Bitcoin is about to crash down to 93k!!!

BTCUSDT Update — Big Macro Forces In Play!!Hey Traders!
If you’re finding value in this analysis, smash that 👍 and hit Follow for high-accuracy trade setups that actually deliver!
Bitcoin once again testing key support levels as global tensions continue to fuel uncertainty in the markets.
Chart Overview:
BTC broke down from short-term resistance and is now retesting the major support zone between $102K–$103K. The structure still remains within a broader consolidation range, but this support zone is absolutely critical for bulls to defend.
Immediate Resistance: $106K → $110K
Immediate Support: $102K → $100K
A breakdown below $100K could trigger deeper liquidations towards $95K–$98K, while a successful defense here could push BTC back toward previous highs.
Geopolitical Impact:
Global headlines are heavily influencing risk assets right now:
🇮🇱 Israel-Iran tensions are escalating.
🇺🇸 The US is signaling stronger involvement diplomatically, adding more fear to markets.
📉 Traditional markets have already started to show signs of caution.
Bitcoin, as a risk asset, remains vulnerable to these global macro shocks in the short term.
The Game Plan Right Now:
If we see sustained support at $102K–$103K, there’s still room for a relief bounce towards $106K–$110K in the near term.
However, if global tensions escalate further, expect increased volatility with downside liquidity grabs.
Stay cautious with tight risk management. Macro headlines are still driving sudden sentiment shifts.
📊 My Bias:
Watching for potential sweep of $102K with possible reversal structure forming. Any clear reclaim of $105K may signal a local bottom.
📝 Key Takeaway:
Global narratives are bigger than technicals right now. The next few days could dictate whether BTC holds or faces another sharp liquidation event.
Stay patient. Stay disciplined. And most importantly: manage your risk.
👉 Follow for more real-time updates as we track both price action and macro headlines impacting crypto.

Bitcoin Breakout Incoming? Flash PMI & CME Gap in FocusBitcoin ( BINANCE:BTCUSDT ) started to fall ( about -4%) after the news that the US was involved in the Middle East tension , but it has risen again with good momentum .
Do you think Bitcoin will go below the previous bottom($98,200) again on the 1-hour time frame?
Bitcoin is trading in the Resistance zonezone($102,130-$100,700) and near the Resistance lines .
In terms of Elliott Wave theory , it appears that a Double Three Correction(WXY) has been completed near the Potential Reversal Zone(PRZ) . Also, the first 5 microwaves of the Impulsive have now been completed .
---------------------------------
Bitcoin traders should monitor today’s Flash Manufacturing (expected 51.1) and Services PMI (expected 52.9) . Both forecasts are already lower than last month’s figures (51.3 and 54.8) , but I see a chance they come in even weaker.
Why weaker PMI is likely?
Slowing retail sales and softer labor data point to reduced consumer demand.
High interest rates are starting to pressure both the production and services sectors.
Regional Fed surveys already showed a cooling in business activity.
If the PMI prints below expectations, the market may anticipate a more dovish Fed, pushing the dollar( TVC:DXY ) down and giving Bitcoin a potential bullish boost.
---------------------------------
I expect Bitcoin to move towards filling the CME Gap($103,730-$102,275) after breaking the Resistance lines , and if the Resistance zone($104,380-$103,060) is broken, we should expect further increases.
Cumulative Short Liquidation Leverage: $103,391-$103,934
Cumulative Long Liquidation Leverage: $100,800-$100,250
Cumulative Long Liquidation Leverage: $97,691-$97,241
Note: Increased tensions in the Middle East or new and important news surrounding this news can make the analysis invalid, so be more careful with capital management.
Note: If Bitcoin can touch $98,170 , we can expect more dumps.
Please respect each other's ideas and express them politely if you agree or disagree.
Bitcoin Analyze (BTCUSDT), 1-hour time frame.
Be sure to follow the updated ideas.
Do not forget to put a Stop loss for your positions (For every position you want to open).
Please follow your strategy and updates; this is just my Idea, and I will gladly see your ideas in this post.
Please do not forget the ✅' like '✅ button 🙏😊 & Share it with your friends; thanks, and Trade safe.
