Bitcoin Expecting Bullish FormationBitcoin could be triggered by negative news from the U.S. regarding tariffs, which may create market uncertainty and push investors toward risk-off or alternative assets like crypto.
Currently, Bitcoin is reacting to the decline caused by fundamental negative data, but bullish sentiment remains alive as buyers attempt to hold key support zones. The focus now shifts to the psychological resistance near 110K
You may find more details in the chart.
Ps support with like and comments for more better analysis.
USTBTC trade ideas
BTC/USDT Chart Analysis (4H)Patterns and Structure:
Bitcoin remains inside a larger converging structure (symmetrical triangle/wedge) visible from the diagonal trendline.
The price has recently broken above the descending resistance trendline but is hovering near the red resistance area (~$109,000–$110,000).
Ichimoku Cloud:
The price is currently above the Ichimoku Cloud, which acts as support (~$107,000–$108,000 area).
The cloud below the price is green, indicating bullish momentum.
Key Areas:
Resistance Area: $109,000–$110,000 (red box). Multiple previous rejections from this area.
Support Zone: $106,000–$107,000 (cloud and trendline support).
Key Lower Support: The green box near $98,000–$100,000, in case of a deeper retracement.
Possible Scenario:
As your blue arrow suggests, if Bitcoin consolidates above the breakout level (~$108,000), a rally towards the next major resistance between $112,000–$114,000 is likely.
Conversely, losing the breakout zone could see BTC return to retest lower support levels around $106,000 or $100,000.
Short-term Outlook:
The trend bias remains bullish as long as BTC stays above ~$107,000.
Monitor price reaction to the red resistance zone for breakout confirmation or potential rejection.
Conclusion:
BTC is showing signs of strength, but the $109,000-$110,000 resistance zone is crucial. A confirmed breakout above this zone could accelerate the move towards the $112,000-$114,000 targets.
Stay tuned for updates and key levels to watch!
Thanks for your support!
DYOR. NFA

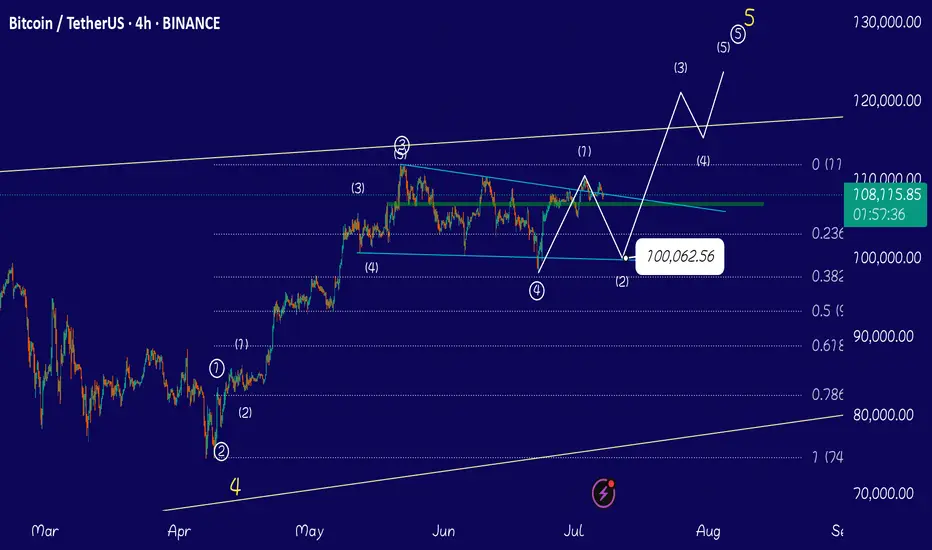
Wait for 100k ( read reasons)If you look at my chart you can see the truth, Elliott waves are well marked on the chart, we are now completing the micro wave 2 of the main wave 5, I expect the corrective micro wave 2 to correct the price to Fibonacci 0.78, which is exactly touching the lower descending line of the channel and includes the 100k price range. Wait for the micro wave 1 correction to complete and buy again in the 100k range. I will not open a short position and I advise you to wait for the price correction to 100k.
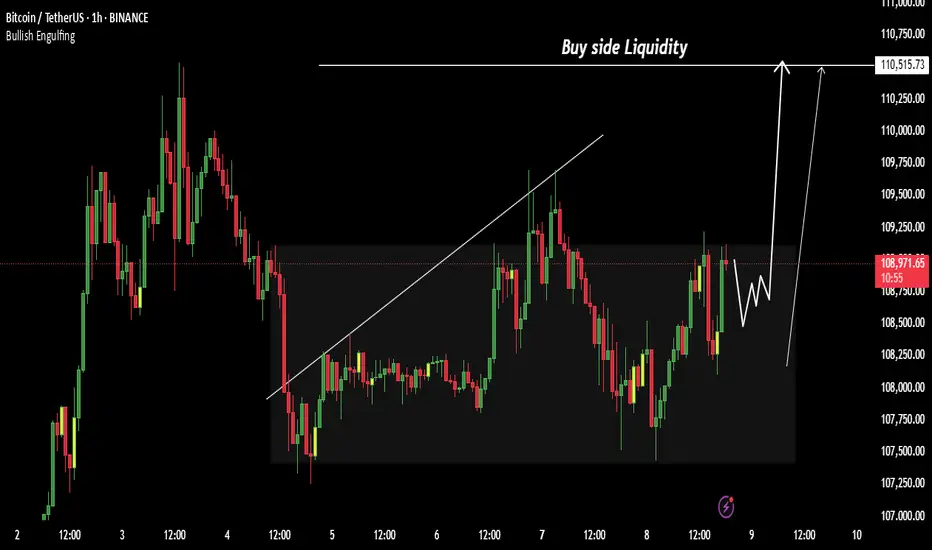
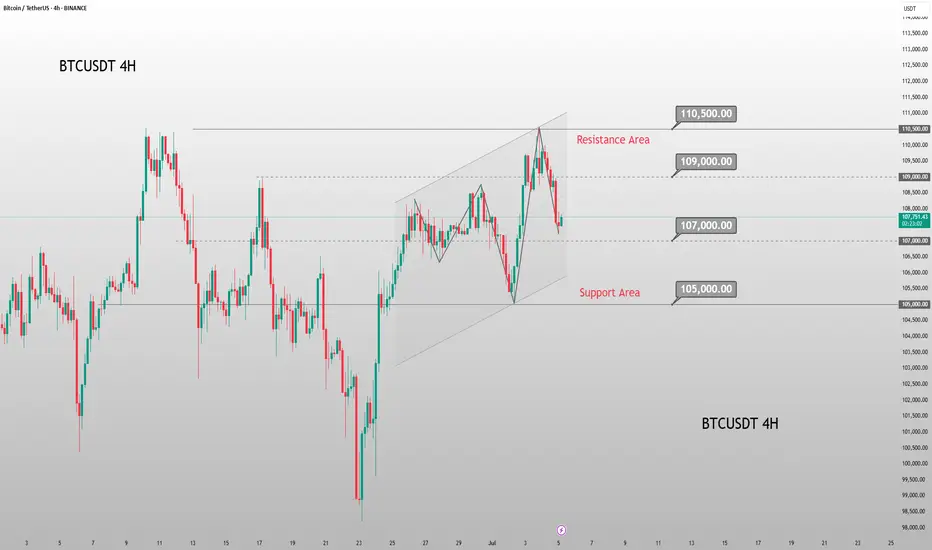
Lingrid | BTCUSDT Short-Term Bullish Momentum The price perfectly fulfilled my last idea . BINANCE:BTCUSDT continues to trade within a strong upward channel, supported by consecutive higher highs and an ascending trendline. After breaking above the range near $108,200, price briefly peaked above $110,000 before pulling back to retest the mid-support zone. Current action shows a rebound from the upward trendline, suggesting buyers are preparing for another leg up toward $110,500 and possibly the $112,000 resistance zone.
📈 Key Levels
Buy zone: around 108,000 or below
Sell trigger: break below 107,000 with close under channel
Target: 110,500 – midpoint resistance, followed by 112,000
Buy trigger: bounce from trendline and reclaim of 109,000
💡 Risks
Weak rebound could signal range re-entry and stall upside
Break below the trendline may shift bias to 105,000
Multiple rejections near 110,000 could indicate topping pressure
If this idea resonates with you or you have your own opinion, traders, hit the comments. I’m excited to read your thoughts!

Check support at 108316.90-111696.21
Hello, traders.
If you "Follow", you can always get new information quickly.
Have a nice day today.
-------------------------------------
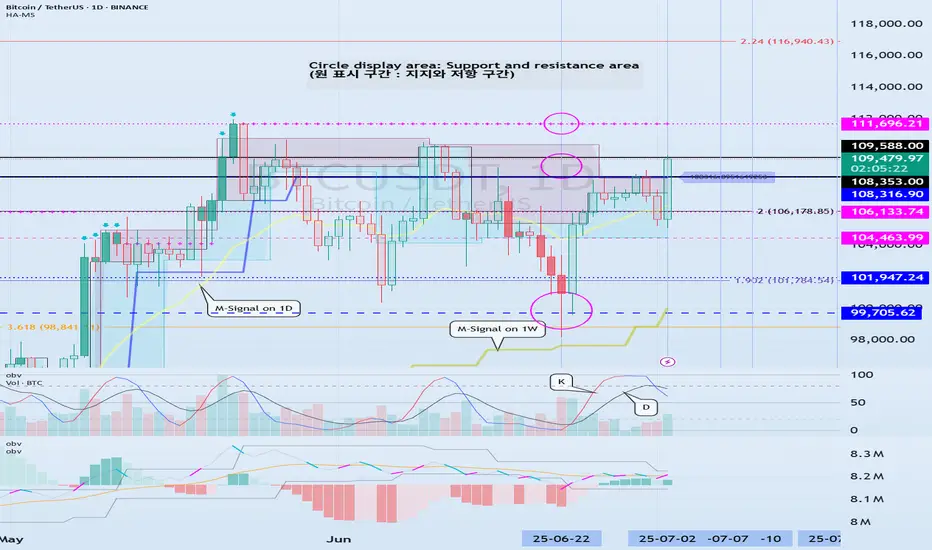
(BTCUSDT 1D chart)
Among the many trend lines, the one marked 1W is the important one.
Therefore, we need to look at whether it can rise above the 1W trend line or rise along the trend line.
If not, and it falls below 108316.90, it may lead to further decline, so we need to think about a countermeasure for this.
This volatility period is expected to continue until July 3, but it is expected to last until July 11, so caution is required when trading.
-
Indicators that indicate high points are DOM(60), HA-High, and StochRSI 80.
HA-High and StochRSI 80 are formed around 108316.90, and DOM(60) is formed at 111696.21.
Therefore, the 108316.90-111696.21 section is a high point boundary section, and if it is supported and rises in this section, it is highly likely that a stepwise uptrend will begin.
The conditions for a stepwise uptrend to begin are:
- The K of the StochRSI indicator must show an upward trend below 80,
- The PVT-MACD oscillator indicator must show an upward trend above the 0 point,
- The OBV of the Low Line ~ High Line channel must show an upward trend. If possible, it is better for the Low Line ~ High Line channel to form an upward channel.
When the above conditions are met, I think that if it is supported and rises in the 108316.90-111696.21 section, it is highly likely that a stepwise uptrend will continue.
If the above conditions are not met, it is likely that it will show a downward trend again while pretending to rise.
-
Thank you for reading to the end.
I wish you successful trading.
--------------------------------------------------
- This is an explanation of the big picture.
(3-year bull market, 1-year bear market pattern)
I will explain more details when the bear market starts.
------------------------------------------------------
BTC 1 hr technical analiysis Asset: BTCUSDT.P (Bitcoin Perpetual Futures)
Timeframe Provided: 1-Hour (1H)
BITGET:BTCUSDT.P
1. Higher Timeframe Bias (Assumed for 1H Context):
Based on the observed price action, specifically the strong impulsive bullish move around July 2nd-3rd, followed by a corrective pullback, it is reasonable to assume a bullish bias from the higher timeframes (Daily/4H). This assumption is crucial, as the 1H timeframe should ideally align with the dominant higher timeframe trend for high-probability setups. The strong push above previous resistance and the subsequent retracement suggest the potential for a continuation of an uptrend.
2. 1-Hour Structure Analysis:
Initial Structure: The price was generally ranging or in a slight downtrend until around July 2nd. We observe multiple internal bearish Break of Structures (1H BOS in red).
Change of Character (CHoCH): A significant bullish 1H CHoCH is observed around July 2nd, indicating a shift from a bearish to a bullish internal structure. This shift was followed by strong bullish momentum.
Break of Structure (BOS): After the CHoCH, the market showed clear bullish 1H BOS, confirming the new bullish impulse.
Current Structure: The market has recently pulled back significantly after the strong bullish impulse. This pullback has tested a key demand zone. We are looking for a continuation of the bullish trend from this pullback.
3. Liquidity and Inducement:
Sell-Side Liquidity (SSL): Prior to the bullish CHoCH, there were clear areas of sell-side liquidity that were swept, fueling the subsequent upward move.
Inducement: The current pullback, while corrective, may be acting as an inducement, drawing in early buyers or trapping sellers, before potentially continuing the upward movement. Price has swept some internal liquidity during this retracement.
4. Valid Demand/Supply Zones (1H):
Primary Demand Zone: The most prominent demand zone of interest is located roughly between $107,000 and $107,300. This zone represents an unmitigated order block (or a clear area of strong institutional buying) that initiated the significant bullish impulse. It also aligns with previous resistance that was broken and is now potentially acting as support (a "flip zone"). This is our primary point of interest for a long entry.
Mitigation: Price has begun to tap into this demand zone, indicating a potential mitigation phase.
5. Trade Setup Proposal (High Probability Long Setup):
Considering the assumed higher timeframe bullish bias and the current 1H structure, a long setup from the identified demand zone presents a high-probability opportunity.
Bias: Bullish
Entry Strategy: We are looking for confirmation within the demand zone. Given the 1H chart, a refined entry could be sought on a lower timeframe (e.g., 15M or 5M) for further confirmation (e.g., an internal CHoCH, aggressive entry within the order block). However, based on the provided 1H chart:
Proposed Entry Price: Around $107,150 - $107,250. This is within the heart of the unmitigated demand zone. The visual suggests an entry around $107,200.
Stop Loss (SL): Slightly below the low of the demand zone/order block, and crucially, below any structural low that would invalidate the bullish short-term structure.
Proposed SL Price: Around $106,750 - $106,900. The visual places the SL at approximately $106,900. This allows for some wick hunting but protects capital if the demand fails.
Target (TP): We will target the high of the recent bullish impulse, and potentially higher if the higher timeframe bias confirms a sustained uptrend.
Proposed TP Price: Initial target at the recent high around $110,900 - $111,000. The visual suggests $110,950.
Rationale for TP: This target represents the next logical liquidity pool (buy-side liquidity) and a significant structural high that, if broken, would confirm further bullish continuation.
Risk to Reward Ratio (RRR):
Entry: ~$107,200
SL: ~$106,900 (Risk: $300)
TP: ~$110,950 (Reward: $3750)
Calculated RRR: Approximately 1:12.5. This is an exceptional RRR and highlights the potential of this setup.
6. Important Considerations & Trade Management:
Confirmation: While the 1H demand zone is strong, for institutional-level entries, further confirmation on lower timeframes (e.g., a CHoCH or clear bullish momentum shift on the 5M/15M chart once price enters the demand zone) would be ideal.
Market News/Events: Always be aware of upcoming high-impact economic news (e.g., CPI, FOMC minutes, NFP) that could induce high volatility and invalidate technical setups. For crypto, major exchange news, regulatory announcements, or large whale movements can also impact price. As of Saturday, July 5th, 2025, there are no immediate high-impact economic data releases on the calendar for this weekend, but traders should always check the economic calendar for the upcoming week.
Partial Take Profits: Consider taking partial profits at intermediate highs or psychological levels to secure gains and reduce risk.
Trailing Stop Loss: Once the trade moves significantly in profit, consider trailing your stop loss to break-even or beyond to protect capital.
This detailed analysis, even with the limitation of a single timeframe, provides a clear, high-probability long setup based on advanced SMC principles. Monitor price action closely at the entry point and manage risk diligently.
Disclaimer: This analysis is purely for educational and analytical purposes and does not constitute a buy or sell recommendation or financial advice. All trading decisions must be made based on individual analysis, proper risk management, and careful consideration of market conditions by the trader themselves. As an AI model, I bear no financial responsibility for the outcomes of your trades.

A Comprehensive Analysis !!!This market has shown disregard for technical patterns, and every time the price approaches historically significant levels, it reveals its true intentions and disappoints us. This cycle tends to repeat.
In my opinion, we’re likely to see one more drop in Bitcoin’s price. After that, instead of continuing the expected downtrend from the pattern, the price could break the descending formation and experience a strong upward move.
Stay Awesome , CobraVanguard.

Bitcoin : Missed $100K? Don’t Miss What’s Coming Next!!MARKETSCOM:BITCOIN BINANCE:BTCUSDT continues to show exceptional strength and strong bullish momentum. When we look back at the charts from 2023 and 2024, a clear and reliable pattern stands out. Each time Bitcoin touched the 50 EMA on the weekly chart, it triggered a significant rally that led to new all-time highs. That same setup appears to be forming once again.
MARKETSCOM:BITCOIN tested the 50-week EMA around the $75,000 level and has since bounced with conviction. The price has reclaimed the $100,000 mark and is now challenging previous all-time high resistance. Historically, a successful bounce from this key moving average has not only signaled recovery but also sparked explosive upside moves.
Following this repeating pattern, the current cycle target is positioned at $150,000. A clean breakout above the current resistance zone could act as the trigger that launches Bitcoin into uncharted territory. The technical structure remains bullish, momentum is clearly accelerating, and the overall trend continues to favor the upside.
This moment represents a textbook Buy and HODL opportunity. Technical indicators are aligning, market sentiment is turning increasingly optimistic, and all signs suggest that Bitcoin could be preparing for another historic rally. Stay ready for what could be the next big move.
Follow Our Tradingview Account for More Technical Analysis Updates, | Like, Share and Comment Your thoughts

TradeCityPro | Bitcoin Daily Analysis #120👋 Welcome to TradeCity Pro!
Let’s dive into the Bitcoin analysis and key crypto indices. As usual, in this analysis I want to review the futures triggers for the New York session.
⏳ 1-Hour Timeframe
In the 1-hour timeframe, as you can see, Bitcoin has finally broken out of the range it formed yesterday and is now moving upward.
✔️ If this upward move continues, we can open a long position in these zones by getting confirmation in the lower timeframes. The main long trigger is still activated after breaking 110256.
💥 The RSI oscillator entered the Overbuy zone in the previous candle. We need to see how the price reacts to this move and what impact this oscillator will have on the price.
⚡️ In my opinion, this RSI move won't have much impact. Although the price is moving upward, the main trend has not yet formed, so there's no real momentum in the market, and RSI is basically useless for now.
✨ If this upward move turns out to be fake, we can enter a short position with the 107853 trigger.
👑 BTC.D Analysis
Let’s look at Bitcoin Dominance. Yesterday, dominance had an upward move and broke its ascending trendline but failed to stabilize above 65.52, resulting in a fake breakout and a move downward.
☘️ The fake breakout trigger for the trendline was the 65.38 zone, which was activated, and now the price is heading downward. If this move continues, the next target will be 65.04.
📅 Total2 Analysis
Alongside Bitcoin’s upward move, this index also activated the 1.14 trigger and is moving up, now reaching 1.15.
💫 If the move continues, the next entry trigger is at 1.17, which is still quite far from the current price.
📅 USDT.D Analysis
Looking at Tether Dominance, the 4.82 trigger was activated, and dominance is now moving down, having reached 4.78.
📈 If it stabilizes below 4.78, we can confirm the continuation of the downtrend in dominance, which could push it down to 4.72.
❌ Disclaimer ❌
Trading futures is highly risky and dangerous. If you're not an expert, these triggers may not be suitable for you. You should first learn risk and capital management. You can also use the educational content from this channel.
Finally, these triggers reflect my personal opinions on price action, and the market may move completely against this analysis. So, do your own research before opening any position.

BTC there was a limit seller yesterday 109700 BTC there was a limit seller yesterday 109700 . Today I'm looking at sales locally

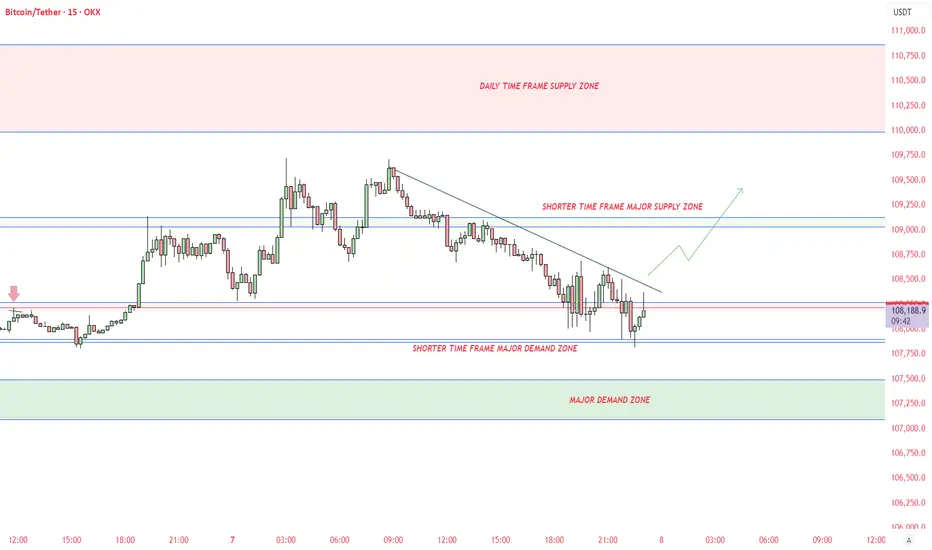
BTCUSDT - MOSTLY UPTREND DIRECTIONAll supply demand zone identified.
May breach till 110000$. Please do your own research before taking any trades
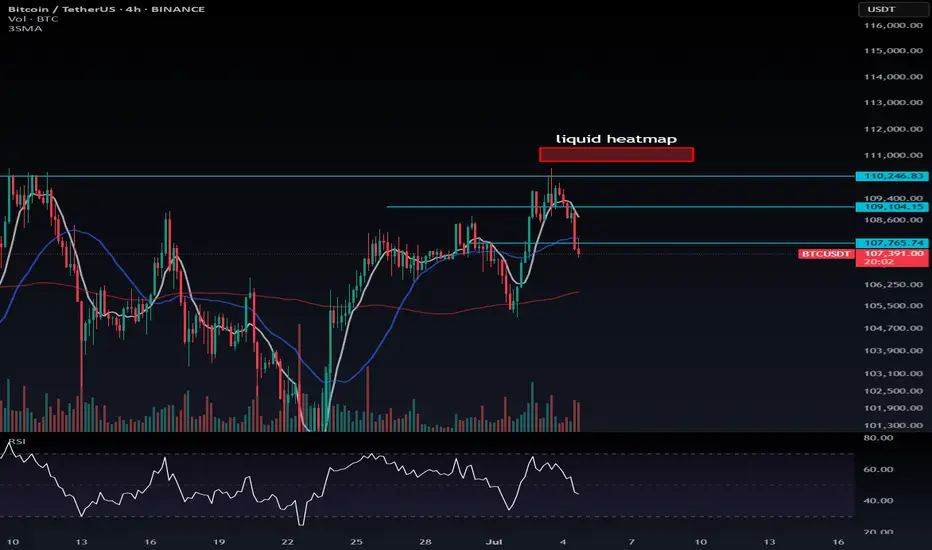
Evening BTC Trend Analysis and Trading SuggestionsLet's review this afternoon's market performance. The BTC price, as we anticipated, rebounded to around 109,000 in the afternoon before plummeting sharply. Living up to "Black Friday", this violent drop was well within our expectations. In the afternoon's live trading, we also reminded everyone that as long as there was a rebound to the upper zone, it was a good opportunity to go short. This drop has created a space of nearly 1,500 points. Currently, the BTC price has pulled back to around 107,800.
From the current 4-hour K-line chart, after a strong upward surge, the market encountered significant resistance near the upper track of the Bollinger Bands. As bullish momentum gradually faded, the price started to come under pressure and decline, suggesting that the short-term upward trend may come to a temporary halt. At present, the market has recorded multiple consecutive candlesticks with large bearish bodies. The price has not only effectively broken below the key support level of the Bollinger Bands' middle track but also caused the Bollinger Bands channel to switch from expanding to narrowing, indicating that market volatility is decreasing. In terms of trading volume, it showed a moderate increase during the price pullback, which further confirms the authenticity of the bearish selling pressure.
BTCUSD
sell@108000-1085000
tp:107000-106000
Investment itself is not the source of risk; it is only when investment behavior escapes rational control that risks lie in wait. In the trading process, always bear in mind that restraining impulsiveness is the primary criterion for success. I share trading signals daily, and all signals have been accurate without error for a full month. Regardless of your past profits or losses, with my assistance, you have the hope to achieve a breakthrough in your investment.
DeGRAM | BTCUSD once again trading above $105k📊 Technical Analysis
● Fresh bounce off the confluence of the 8-month up-sloping purple trend-line and 102-103 k green demand box prints a higher-low inside the rising wedge, keeping bulls in control despite June’s pull-back.
● Price is reclaiming the minor down-trend line from the 12 Jun high; a daily close above 106 k confirms a bear-trap and unlocks the 111.8-112.5 k supply at the wedge cap.
💡 Fundamental Analysis
● Spot-ETF desks absorbed >5 400 BTC in the last three sessions while exchange reserves fell to a four-year low, signalling supply drain.
● Cooling US PCE expectations trimmed real yields, and Mt Gox repayment delays ease overhang fears—both supportive for risk assets.
✨ Summary
Long 102–104 k; hold above 106 k targets 111.8 k → 115 k. Bull thesis void on a 16 h close below 99 k.
-------------------
Share your opinion in the comments and support the idea with a like. Thanks for your support!

PULL BACKFriends as per my analysis btc is forming an inverse head and shoulder pattern. with in a couple of days we will see a pull back up 101k area.

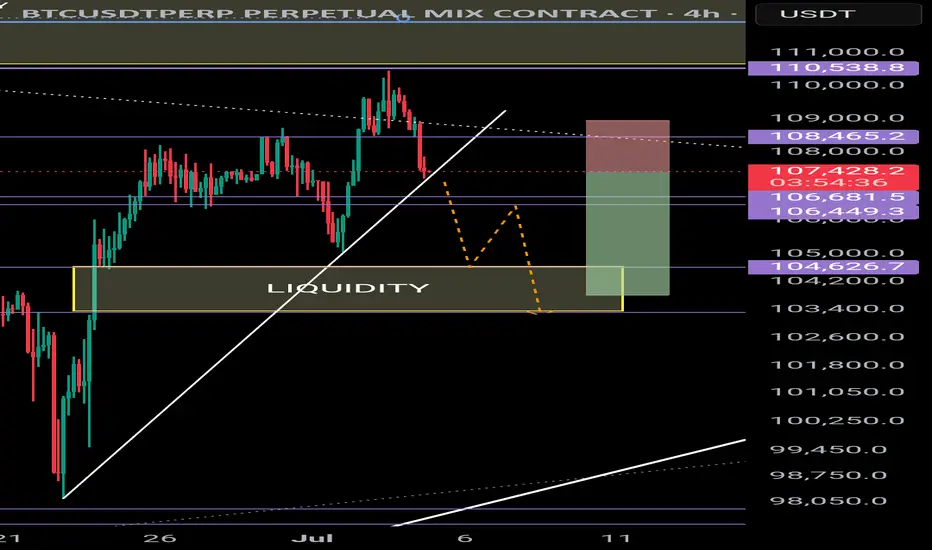
BTC correction - target4H
A break below the uptrend (white line) could result in a move down to 103,400 📉 which would fill a Fair-value-gap and grab liquidity.
Short position:
-3% vs +1%
2.3:1 Reward to Risk
07/07/25 Weekly OutlookLast weeks high: $110,529.95
Last weeks low: $105,108.81
Midpoint: $107,819.38
The "Big Beautiful Bill" was signed into law last week on the 4th July, a huge event in the financial world and undoubtedly the world of crypto. The debt ceiling is now instantly raised by $5T making risk-on assets even more appealing than ever, incoming demand shock will likely help BTC but also the struggling altcoin market as well.
Last week the BTC ETFs saw a net inflow of $294m. This takes the total 30-day inflows to nearly 50K BTC and this is before the big beautiful bill was passed. PA wise, BTC is still struggling to break the $110k level and flip ATH, however the consolidation just under ATH with increasingly shallow pullbacks suggests a run at the highs is in the near future IMO.
For this week US CPI & PPI data are the important release for the week. It's hard to tell if the data releases will actually provide any volatility this time around, they usually do but the FEDs refusal to act has made the last few CPIs very flat in terms of volatility for BTC.
Key battleground for me this week would be the midpoint, clearly last week provided good support, however a larger area of inefficiency rest just under that it so there is a natural pull for price to revisit those areas. Could be a choppy week once again...
Good luck this week everybody!

BTC/USDT.P ShortMy Trade Thesis & Rationale:
Here is my thinking on this short setup. I believe this is a high-confluence opportunity where the price action aligns perfectly with what I'm seeing in the underlying market dynamics.
1. The Big Picture (Daily/4H Context):
Price is currently operating at a major historical resistance zone ($110k+). This level has acted as a "ceiling" multiple times, making it a high-probability area for sellers to step in.
I've noticed that momentum on the 4-hour chart has clearly stalled, which to me signals buyer exhaustion after the last run-up.
2. The Tactical Setup (1H/15M Price Action):
After stalling at the highs, the price formed a clear distribution range on the 1-hour chart—a sign that sellers were likely absorbing the remaining buying pressure.
✅ THE TRIGGER: My entry is based on a decisive, high-volume breakdown below the key support of this range at $107,300. This breakdown was followed by what I see as a weak, low-volume retest, confirming buyer weakness and offering a prime entry.
3. My Logic:
🎯 TARGET: I've set my take profit at $106,800 because it's located within a dense pool of long liquidations. I believe these levels often act as a strong magnet for price.
❌ INVALIDATION: My stop loss at $107,550 is placed just above the broken structure. If the price reclaims this level, my bearish breakdown thesis would be proven wrong, and it's my signal to get out.

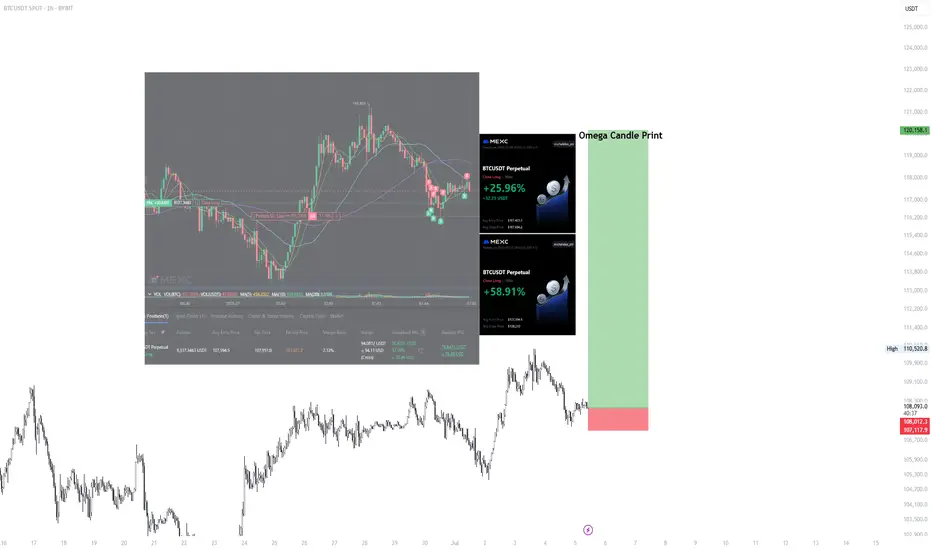
BTC/USDT BYBIT IDEA #2 – Local Range Hold and OMEGA CANDLE PRINTThis is my second Setup I am currently in - apart from going to 6h orderblock we will hold the LTF range and continue higher breaking new highs and starting price discovery.
Combined this with Bullish News could bring amazing BTC Run, followed by Altcoin Season in Mid August/September. If you look into Bitcoin Balance and the way this token is being bought and accumulated by institutions.
The way you know Bull Run is about to start is because no Grandmas and Taxi Drivers are talking about it.
I would not believe it myself but here we are.
The way I do this I keep my position running from lows (bought at 107 400) and I am buying LTF ranges for extra 30-40% of existing position and then closing around the same amount on highs of LTF like 15M-30M.
looking for longs, my SL is set for break even.
Good luck.
Outside of the analysis🔔 The Awakening of Legendary Whales | 9 Transactions from 14-Year-Old Wallets! 🔔🕯
Today, the market witnessed a rare event:
Addresses that had been completely dormant since 2011 (back when BTC was under $2!) suddenly woke up — each moving 10,000 BTC, worth around $1 billion!
📌 Details of some transactions:
💸 10,000 BTC
💵 Approx. ~$1.08B
📤 From: A wallet inactive for 14.2 years
⌛️ Time: 18:15
💸 10,009 BTC
💵 Approx. ~$1.079B
📤 From: A similar address, slightly different amount
⌛️ Time: 18:32
🖥 Analysis:
This simultaneous awakening of multiple ancient wallets, along with the movement of BTC toward exchanges, suggests:
There might be a large-scale plan behind the scenes
Possible market play by first-generation whales
Or a project undergoing restructuring and asset redistribution
👀 Interesting fact: In 2011, these addresses were only worth around $34,000. Today? They're moving billions.
💎 When Bitcoin’s past wakes up, the future starts to tremble…
BTC Prediction This is a Bitcoin price chart with a potential short entry strategy. The chart shows a resistance level at 252.53, and a support level, indicating a key point for price movement. The entry for the short trade is marked at 108,126.76, with a target price of 107,000. The stop loss is placed at 108,126.76, suggesting a minimal risk for the trade. The chart also highlights the target value and a potential loss scenario.

BTC - Drooling for 110K!So my acc was banned for a day and Im soo back! So i feel if it stays sideways for the orange line what we want, looks really good to take 110k to 110,202! breaks below orange line goes to red, stances - GETS CHANGED!

BTC - Reaching to the highest resistance.Bitcoin is approaching its highest resistance zone ever. As it approaches this zone, we need to closely observe the reactions including:
- Price patterns
- Candlestick patterns
- BTC Chart.D

Bullish on $BTC🧠 Wyckoff Overview
🔻 This chart follows Accumulation Schematic #1 in Wyckoff theory.
🔻 The Spring phase (Phase C) is confirmed.
🔻 BTC has broken out from the accumulation zone.
🔻 We are now in Phase D, expecting a move into Phase E (new ATH).
📊 Technical Details
🔻 Accumulation zone: Around $72,000 – $88,000.
🔻 Spring (Phase C): A fakeout happened near $68,000, matching Wyckoff structure.
🔻 Breakout is confirmed after price moved above the downtrend line and Ichimoku cloud.
🔻 Main resistance: $95,000 – currently testing the supply zone.
🔻 Target: If breakout continues, BTC could reach a new ATH above $110,000.
📈 RSI and Volume
🔻 RSI at 66.71: Not overbought yet, still has room to go up.
🔻 Volume is increasing along with the breakout → shows strong buying pressure.
🎯 Personal Prediction
🔻 If BTC holds above $92,000 – $95,000 and continues to consolidate:
→ Short-term goal: $100,000
→ Mid-term goal (Wyckoff Phase E): $110,000 – $112,000
