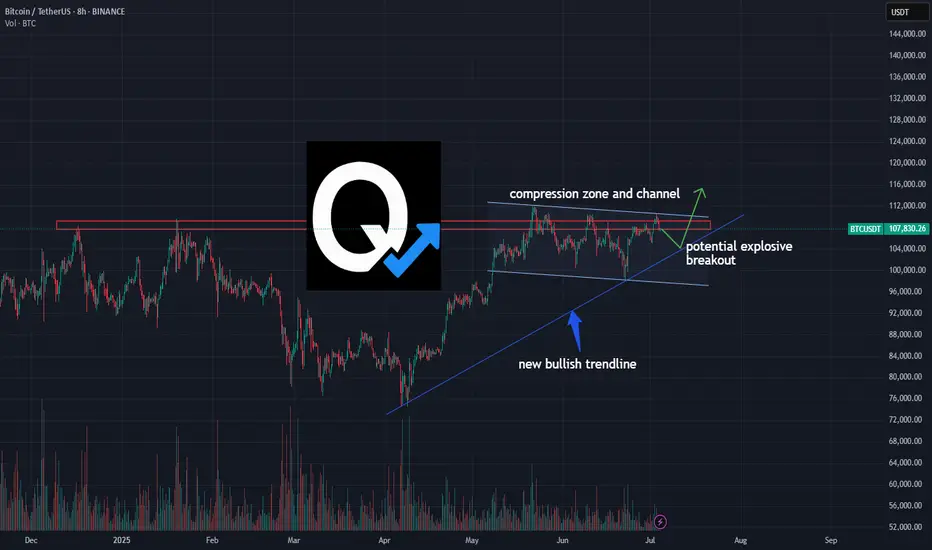
BTC/USDT – Compression Points to Potential Explosive BreakoutBitcoin is grinding into a major compression zone between horizontal resistance and a new bullish trendline. Volume is tightening, structure is intact, and the pressure is building.
This 8H chart highlights a classic breakout setup — a squeeze inside a channel, supported by an ascending trendline that has held clean since April.
🚀 A breakout above $110K could open up rapid upside continuation.
🧭 A retest of the trendline would offer a possible high-reward long entry.
📉 Breakdown invalidates the structure — watch $104K closely.
This is not financial advice — just a breakdown of what the chart is showing. Trade safe, think independently, and manage your risk.
#BTC #Bitcoin #CryptoTrading #BTCUSDT #TechnicalAnalysis #BreakoutSetup #CompressionZone #QuantTradingPro
USTBTC trade ideas
All this just before Fedwire implements ISO20022?#bitcoin #btc price attempted a breakout but today failed with dumps. There "may" be other attempts but while ISO20022 subject is approaching, isn' t it wise to think about #xrp and other ISO20022 licenced coins will overperform the others (BTC, ETH, SOL and all other non iso certified coins) in near future? Not financial advice.

BTC Daily Chart Analysis
Trend: BTC is currently trading within a short-term descending channel.
Strong Resistance: Zone around $110k–112k, multiple failed retests observed.
Key Support: Around $105k (Ichimoku Cloud upper edge & recent local bottom).
RSI: Clear bearish divergence indicating weakening bullish momentum.
Elliott Wave: Completed 5-wave impulse from $75k up to $112k, now correcting (likely waves 4-5 within the descending channel).
Fibonacci: Breakout above $110k targets approximately $117k (1.414 Fib extension). Failure to break may lead price back down toward $102k.
Probability:
Bullish scenario (35%): Clear breakout above $112k, targeting $117k.
Bearish scenario (65%): Rejection at $112k, potential retest toward $105k → $102k.
⚠️ Recommendation: Closely watch the $110k zone. If BTC fails to clearly breakout, consider defensive actions (reducing position size, risk management).

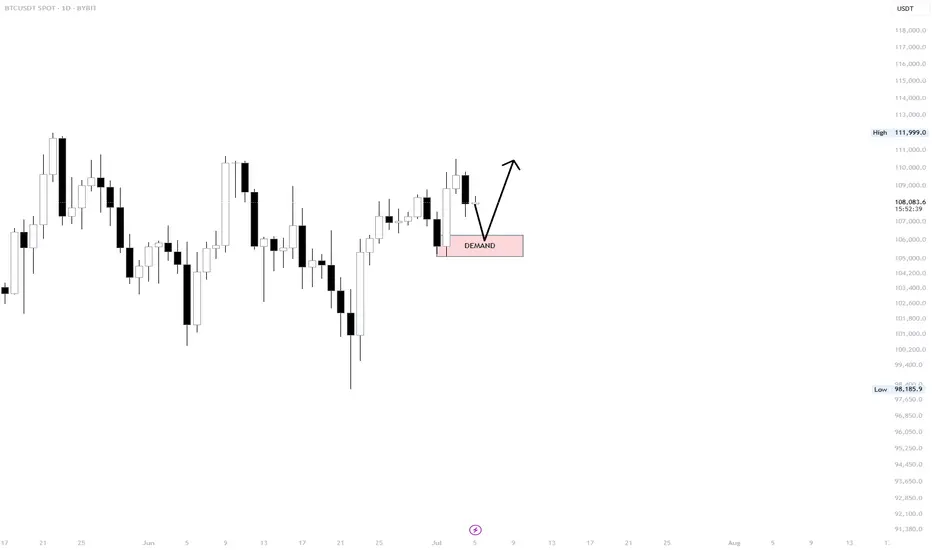
BTC/USDT BYBIT IDEA #1 – Daily Demand Zone Setup
We have an bullish OB with imbalance on Daily, 6 HOUR REFIMNET with some stoplosses underneath 107 200. If we do not hold local LTF -15M- 1H range I would be favoring this setup.
Otherwise I am already in position and already took two TPs.
Setup Thesis:
If price tags the demand zone (highlighted in pink) and holds, we could see a continuation toward recent highs. The setup favors a reactive long entry from this zone, as long as buyers defend the area with conviction.
Key Factors:
Demand zone: High probability support area
Clean structure: HL-HH continuation in play
Market strength remains intact above this zone
Plan:
Wait for reaction at demand
Long on confirmation (rejection candle, reclaim, or strong 4H close)
Invalidation below the zone lows
All Binance Coins Watchlist 2025 JULY If you want to create a full list of all coins from the exchange you use, you can:
1. Go to Screeners
2. Set these filters:
a. Exchange (eg. Binance)
b. Quote currency - USDT
c. Symbol type - Perpetual
3. Keep Scrolling till the end of the list so that all coins are populated. There should be about 400+ coins.
4. Select one of the coins, then click Ctrl A to select all.
5. Right click > Add to an existing Watchlist or Create a new watchlist.
Here's my list i created on 4th July 2025. You can import it if you want.
www.tradingview.com

Tripple Top There was a clear Tripple top pattern by BTC from the 1day chart view. According to how to trade Tripple top.
HOW TO TRADE TRIPPLE TOP
Wait for price to fall below neckline (bottom line under mountains).
Boom! Price break neckline = sell
Target:
Measure from top of mountain to neckline
That size = profit distance down
Stop loss:
Put above last mountain (safe from bear attack
No guess. No hope. Wait for break. Then smash sell.

BTCUSDTCryptocurrency Futures Market Disclaimer 🚨🚨🚨
Trading cryptocurrency futures involves high risks and is not suitable for all investors.
Cryptocurrency prices are highly volatile, which can lead to significant gains or losses in a short period.
Before engaging in crypto futures trading, consider your risk tolerance, experience, and financial situation.
Risk of Loss: You may lose more than your initial capital due to the leveraged nature of futures. You are fully responsible for any losses incurred.
Market Volatility: Crypto prices can fluctuate significantly due to factors such as market sentiment, regulations, or unforeseen events.
Leverage Risk: The use of leverage can amplify profits but also increases the risk of total loss.
Regulatory Uncertainty: Regulations related to cryptocurrencies vary by jurisdiction and may change, affecting the value or legality of trading.
Technical Risks: Platform disruptions, hacking, or technical issues may result in losses.
This information is not financial, investment, or trading advice. Consult a professional financial advisor before making decisions. We are not liable for any losses or damages arising from cryptocurrency futures trading.
Note: Ensure compliance with local regulations regarding cryptocurrency trading in your region.
thanks for like and follow @ydnldn to have more information outlook and free signal.
About me :
"I am a passionate swing trader focused on analyzing financial markets to capture profit opportunities from medium-term price movements. With a disciplined approach and in-depth technical analysis, I concentrate on identifying trends, support-resistance levels, and price patterns to make informed trading decisions. I prioritize strict risk management to protect capital while maximizing profit potential. Always learning and adapting to market dynamics, I enjoy the process of refining strategies to achieve consistency in trading."

30/06/25 Weekly OutlookLast weeks high: $108,531.02
Last weeks low: $99,592.69
Midpoint: $104,061.86
Overall a positive week for BTC in isolation as price moves steadily all week reclaiming the losses made in the week from the 16th-23rd June. This comes after a $2.2B BTC ETF weekly inflow, the 3rd consecutive week of net inflows.
Having now hit the key S/R level of $108,500 it will be interesting to see where BTC goes from here. Jumping up above the level will require a lot from the bulls as ATH is within touching distance and so buying into major resistance is a tough ask. We also have Geo-political uncertainties to add to the situation, one bad tweet is all it takes sometimes to do a lot of damage.
On the other hand the SNP500 hits new ATH in the same conditions and so BTC is more than capable of doing the same.
So far in the first hours of this weeks trading we do have a SFP of the weekly high setup, not ideal for the bulls in any way and so from here the a retest of the range quarters, midpoint being the key area would make sense, invalidation would be a clean break above weekly high with acceptance and strong volume on the move to break the rangebound/choppy environment.
There is also the "window dressing" element to the months &quarter end today. History shows a de-risking going into these events and more money flowing back into risk-on assets in the days following monthly/ quarterly end. For that reason a bullish move (if there were to be one) would come later in the week IMO.
Good luck this week everybody!

BTC ANALYSIS🌸#BTC Analysis : Bullish Trend 🚀🚀
🚀As we can see that there is a formation of Flag & Pole Pattern in #BTC in daily time frame. Right now we can see that #BTC again retest from the resistance zone and we can see a bounce back from its support zone 💪
🔖 Current Price: $1,08,050
⏳ Target Price: $1,20,000
⁉️ What to do?
- We can trade according to the #BTC chart and make some profits. Keep your eyes on chart price action, observe trading volume. Always observe market sentiments and update yourself everyday.🔰🔰
#BTC #Cryptocurrency #Breakout #TechnicalAnalysis #DYOR
Bitcoin at a Crossroadshello guys!
In the current 1D chart of BTCUSDT, a Head & Shoulders pattern has formed, suggesting potential for significant price movement in the near term. The structure includes a defined left shoulder, head, and right shoulder, with a descending trendline acting as a critical resistance level.
🔹 Bearish Scenario:
If the price respects the descending trendline and fails to break above the neckline (around $109,480) , a bearish reversal is likely. In that case, the target based on the pattern lies near the $93,500–94,000 support zone. This level aligns with a previous consolidation area, making it a strong candidate for a reaction or bounce.
🔹 Bullish Scenario:
On the flip side, if the price breaks above the neckline and the descending trendline, invalidating the pattern, a strong bullish continuation could unfold. The potential breakout target would be around $127,000–130,000, in line with the projection from the head of the pattern.

BTCUSDTBitcoin has two paths: if it stabilizes above 111,800, it can go to the target of 144,540, but if this move is a fake break, it can go to the targets of 91,410 and even 85,662, but it is expected to fall and then move.

BTC - Bullish retest to ATH?Made a composite profile of that little range we had last week.
We took out the lower npoc, then took out the higher npoc and the internal equal highs (which was the only short I see for now)
I'm looking for 107.2-3 to get a bullish reaction, long from there into a clean-up of the 112k highs.
If the July 2nd lows don't hold, I'd look for the 101k npoc, or maybe a frontrun of that at the imbalance fill around 103k.

BTC - 4H chart - $105k KEY ZONE, up or we try again7/4
1. As long as price finds support above 105k, the structure remains to go up, breaking the bull flag to ATH.
2. Below 105k, bottom bull flag for support

PVSRA Bitcoin AnalysisMay 08 2025 a bullish candle's parallel volume bar broke the threshold in the below pane; indicating price instability, or unfilled orders if you will. June 22 price returns to that full candle body and dips $500 below it, to feel the opposing force and realize orders have been filled and we are in equilibrium. This set up is usually set up and finished in 1-2 weeks (volume absorption) so this 1.5 month setup was an outlier and a grind that paid off BIG patience and knowing your plan of attack is everything in this game, you have to have a plan for every single variable and NEVER stray.
Present day, a 30 minute candle has broken our volume threshold, and weve moved aggressively away from that magnetic force inevitably pulling price back towards it EVENTUALLY as it did june 22nd. Due to the commonality and the recentness of the move that just happened of 5/8-6/22, we can suspect price pattern will repeat and price will be bid up, from 115-120k, where we will then reverse to 103. The bar pattern from the 5'8 6'22 move was copied, pasted, and retrofitted to current time.
Regardless of the exact pattern of the move we expect price eventually to resolve those orders at the 103 mark and our moves are based in that zone. This seems like a range out as we capitulate these 6 figures whilst remaining in a bull market.

BTCUSDT: building up for a bigger pullback.As it stands, BTC is at a very important area. There's a first sign that the trend will change for the coming days and I expect the price to drop towards the 103k area.

BTC - LONG UPDATEI'm taking profit on the long here, nice weekend pump.
For me low 109s is the inflection point, I rather take profit here and start the week fresh.
See previous BTC post for a more zoomed out version and higher timeframe levels, nothing has changed.

BITCOIN SELL TRIGGERED Following our previous analysis, BTC took both the sell-side and buy-side liquidity. It's currently within a premium zone and has major supply, so a sell entry was triggered.
Risk management is intact, target 1:3 RR. Good luck fams.

BTC - Perfect Trendline TestOur previous post can be found here: www.tradingview.com
From what we were pointing out yesterday how BTC was testing our trendline of support - today we have seen the fulfillment of this move as we saw two more touchpoints of support on the trendline and are now making our way back towards the red trendline as stated in our last post.

BTCUSDT: Positive CDV Divergence for Potential Long Setups• Market Overview: Bitcoin currently sits at a pivotal point. Although the price movement has been somewhat indecisive, we’re watching closely for signs of bullish momentum.
• CDV Divergence Focus: Our attention is on a potential positive Cumulative Volume Delta (CDV) divergence. This takes shape when the price makes a lower low but CDV registers a higher low (regular bullish divergence), or when the price posts a higher low and CDV shows a lower low (hidden bullish divergence). These patterns can hint at growing buying interest even if price action hasn’t caught up yet.
• Support Zones (Blue Boxes): The highlighted blue zones on the chart signal potential support levels where buyers may step in. These are mapped from prior demand areas or structural support points.
• Trade Setup: Should a confirmed positive CDV divergence appear near or inside one of these blue zones, it could offer a strong case for a long entry. This would suggest that while the price may look weak, buying strength is quietly building underneath.
• Managing Risk: Any long entry must be accompanied by a well-defined invalidation level—typically just below the blue box support or the lowest point of the divergence.
Disclaimer: This is a technical pattern-based analysis intended for informational purposes only. Trading involves risk. Always perform your own due diligence and assess your risk appetite before entering any trades.

BTC - Channel is Broken, Now What?
We are currently retesting the upper trend line of the channel I gave in this analysis, the most bullish scenario is that it breaks upwards and BTC stages a determined rally. If you cannot catch an entry during this rally, do not worry, we can retest the upper part of the trend again or go to manipulation areas such as green bubbles.

"BTC to $108,800 – How Likely Is It?"Bitcoin is showing strong bullish momentum as key technical indicators align in favor of a major breakout. With increasing institutional interest, rising ETF inflows, and a favorable macroeconomic environment, BTC appears to be setting up for a potential rally toward the $108,800 level. Historical price action also suggests that once Bitcoin breaks past major resistance zones, it often surges rapidly. If the current support levels hold and buying pressure continues, the $108,800 target may be closer than expected.

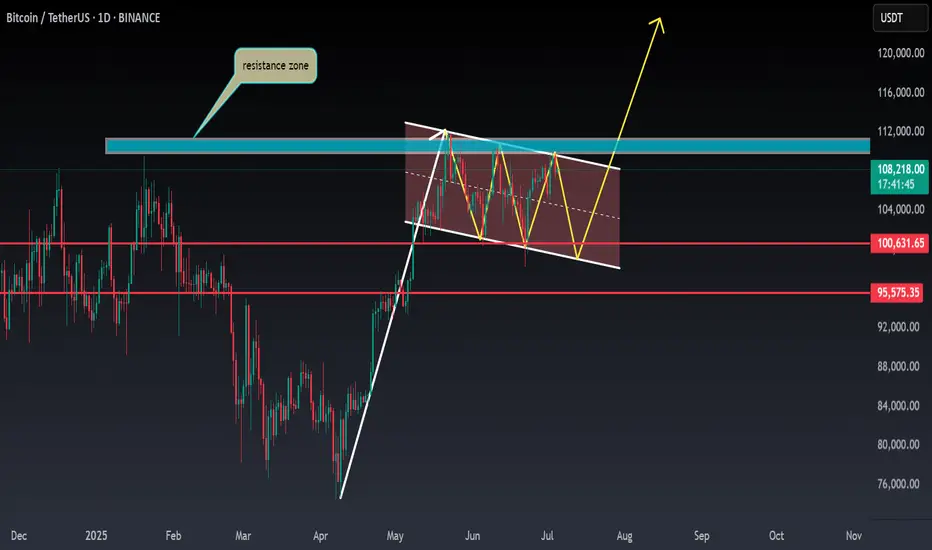
Bitcoin 100K$ is strong soon range will end and bulls will winSoon we are looking for a heavy rise here like the green arrows on chart and new ATH which would be nonstop and first target for that is around 120K$.
Also we should consider that we have range zone around 100K$ support to 110K$ resistance zone and we need breakout first and then next possible move is obvious.
DISCLAIMER: ((trade based on your own decision))
<<press like👍 if you enjoy💚

Btcusd techinical analysis.Btcusd techinical analysis next move psibale at h1 time frame.not finchinal advice.
