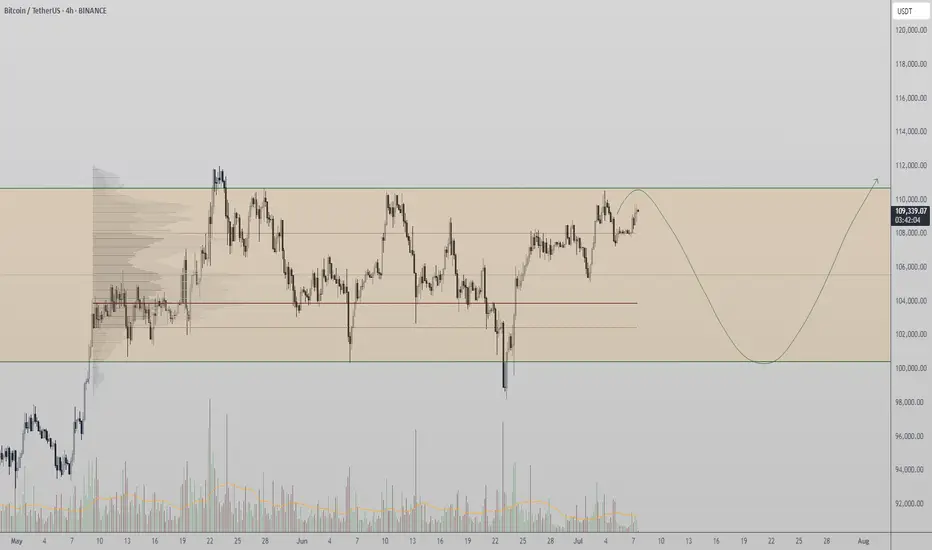
Bitcoin - Time to sell, huge drop will follow (must see!)Bitcoin is currently approaching a very strong resistance of this major bullish flag! We definitely want to sell resistances and buy supports, not the other way around, until we have confirmations. Bitcoin's price action is statistically very boring during summer seasons! Usually high volatility kicks in in September. I think we cannot really expect a new all-time high in the next few weeks. Instead, we should see a big range. In the short term, Bitcoin should go back at least to around 102,600 USDT to fill up the FVG. Also, markets always move in waves, and this move from 98,200 seems to be exhausted already.
On the chart we can clearly see a blue trendline, and price went below this trendline at the end of May. This indicates that the uptrend is over and a consolidation/distribution phase is in progress. This phase is usually represented as a bull flag, triangle, rectangle, or wedge. When we look at the current price action, it looks like a bullish flag consolidation pattern. Bitcoin is currently in the sell around 109k
There are 2 types of traders. The first one they love to trade ranges, and the second they love to trade breakouts and higher volatility environments. Currently I think Bitcoin is creating a range, so do not expect any crazy movements until this bullish flag is valid.
Bullish flags are usually bullish patterns, but often they break down and act like bearish patterns. So what would happen if this bullish flag breaks down? That would send the price of Bitcoin to the 0.618 FIB, which is at 88,882 USDT. What if this bullish flag breaks out? That would send the price of Bitcoin to 116,000 to 125,000, but to establish this price, we first need to see the low of the bull flag, which is not confirmed yet. I will definitely inform you in one of my next analyses, so write a comment with your altcoin + hit the like button, and I will make an analysis for you in response.
Trading tip at the end: "A trader needs to accept the losses to maintain their emotional stability. Losses are a crucial internal part of trading that helps traders to learn how to grow from their losses. Traders learn from losses and implement required changes in their strategies for better results in future trades." Trading is not hard if you have a good coach! This is not a trade setup, as there is no stop-loss or profit target. I share my trades privately. Thank you, and I wish you successful trades!
USTBTC trade ideas

The only plays you need this week! 🚀 Join us as we dive into the highs and lows of Bitcoin this week! 🔥
Opportunities like this don’t show up every day — and we’ve got a strong feeling there’s a 10X trade hiding somewhere in this video! 👀💰
We’re locked in on the charts like eagles 🦅, watching closely to see if any of our setups come to life. You won’t want to miss what’s coming next! 📈📊
✨ Stay tuned for daily updates, smart setups, and sharp moves! ✨
📅 Weekly Schedule:
🛠️ Daily Setups: Monday to Friday
🎓 Class: Every Tuesday (if stars align 🌟 – subject to confirmation)
Let’s make it a big week! 💪🚀

Bitcoin Tests Range High Again — Will This Time Be the Breakout?Bitcoin is once again at the top of its multi-week range, testing resistance near previous highs. A decisive breakout remains elusive as price struggles to sustain momentum without volume confirmation.
Bitcoin is back at a familiar technical level — the top of its long-standing trading range. After a weekend rally that pushed price toward range resistance, BTC now finds itself hovering near the weekly open, raising questions about whether this move will finally lead to a breakout or simply mark another deviation. With historical price action showing repeated failures at this level, all eyes are on volume and confirmation to validate the next directional leg.
Key Technical Points:
- Range High Resistance Reached Again: BTC testing resistance zone that has capped price for weeks
- Weekend Pump, Weekday Fade: Price surged over the weekend but is now settling near the weekly open
- Volume Still Lacking: No breakout confirmation without a strong influx in volume
The recent price surge in Bitcoin occurred over the weekend — a time when liquidity is typically thinner and institutional volume is reduced. While this move did push BTC back into the upper portion of its range, it’s important to recognize that the price is once again stalling near the range high. This level has historically acted as a firm resistance, and prior attempts to break above it have resulted in deviations followed by re-entries into the range.
This time is no different — so far. The current consolidation just below the high suggests the market is undecided, awaiting further confirmation through volume or macro developments. Without a high-time-frame close above the range resistance — and without meaningful volume behind it — the likelihood of this being another deviation remains high.
It’s also worth noting that BTC is back near the weekly open, which suggests the weekend rally may lack sustainability. In similar past instances, Monday retracements have confirmed that weekend pumps were driven by thinner liquidity and lacked conviction. Until proven otherwise, this appears to be more of the same.
From a structural standpoint, Bitcoin continues to trade within a well-defined horizontal range. This means oscillations between the range low and range high are still valid expectations until a breakout or breakdown occurs. These types of consolidations often persist until a major catalyst, and while the breakout is inevitable, it hasn’t happened yet.
Expect Bitcoin to continue ranging between its established high and low unless volume confirms a true breakout. A failure to hold above the current highs may trigger another rotation back toward range support.
Breakout vs Fakeout: How to Spot the DifferenceHello, Traders! 🖖🏻
There’s probably no phrase that triggers more mixed emotions in crypto trading than: “Looks like we’re breaking out!”. Because let’s be honest…For every clean breakout that follows through with momentum…
…there’s a fakeout waiting to trap overconfident entries.
So, how do you tell the difference? Let’s break it down!
🧱 What Is a Breakout?
A breakout occurs when the price moves decisively beyond a key level, such as support, resistance, a trendline, or a range boundary, and holds.
What makes it a REAL breakout?
Volume Expansion: More participants step in as the price moves through the level.
Strong Candle Closes: Especially on higher timeframes like 4H or 1D.
Follow-Through: The market doesn’t just poke above the level. It builds on it.
No Immediate Rejection: You don’t see a sharp wick straight back below.
Example from BTC (2021):
Look back at January to February 2021. BTC had been stuck under the $42K–$43K resistance for weeks. Every push got sold off, until it didn’t.
When the breakout finally came, it was clean. The massive daily candle closed right through the level. Volume exploded. And there wasn’t even a polite little retest, price just launched straight toward $58K, leaving anyone waiting for a pullback completely behind.
Pure trend breakout energy. Everything lined up: the context, the volume, the structure — textbook 🤌🏻
🪤 What Is a Fakeout?
A fakeout, on the other hand, looks like a breakout… until it isn’t. The price briefly moves beyond a key level, but then snaps back inside the range, often trapping late buyers (or sellers) and triggering stop-losses.
Common Signs of a FAKEOUT:
Low or Declining Volume (at the breakout moment).
Quick Rejection with a Long Wick (especially on intraday charts).
Failure to Hold Above the Level on Retest.
Divergence Between Timeframes: For example, a 15M breakout that looks strong while the 4H still shows consolidation.
Classic BTC example:
This one was sneaky! After BTC hit its all-time high around $65K, the market started looking shaky. Price tried to recover by pushing back into the $58K–$60K zone, a pretty critical level at the time. It looked like a breakout attempt… but something was off. No real volume. No strong candle closes. And then, BOOM, hard rejection. The price popped just enough above resistance to lure in breakout traders (and probably clear out some stop-losses)… then completely reversed. And not just a minor pullback, this fakeout basically triggered the entire leg down toward $30K. Classic liquidity grab. The kind of move that looks like strength for a second… until it absolutely isn’t.
🕵️♂️ Key Differences: Breakout vs Fakeout (Checklist)
🧠 What Causes Fakeouts in Crypto?
Honestly, fakeouts aren’t some kind of accident. They’re almost baked into how crypto markets work.
Part of it comes down to simple liquidity hunting. The market knows exactly where traders tend to place their stop losses, right above resistance or just below support. Price often spikes into those zones, triggers stops, fills larger orders for bigger players… and then reverses completely.
Another reason? A lack of real conviction. Sometimes, it’s mostly retail traders chasing a move. Price pokes above a key level, but there just isn’t enough momentum to sustain it. Without bigger buyers or sellers stepping in, the move collapses right back.
And let’s be honest. When everyone on Crypto Twitter is watching the exact same level, fakeouts become almost inevitable. The more obvious the setup, the more likely it gets front-run, faded, or manipulated.
Plus, a huge mistake? People ignore the higher timeframe context. A breakout on the 15-minute chart might feel exciting… but if the 1D or 4H is still clearly in a downtrend, that breakout is fighting against the bigger picture. No surprise it fails. Fakeouts happen because the market’s job is to make most people wrong, at least for a moment.
🧭 Final Thought
Breakouts and fakeouts are part of the same game: they involve both liquidity and psychology. The market rewards patience, context, and waiting for confirmation. Sometimes, missing the first candle can save you from being a liability to someone else. So, next time an asset “breaks out,” take a second look. Is it really moving with force? Or is it just another trap waiting to be sprung?
What’s the last fakeout that caught you off guard? Drop your story in the comments. Let’s compare lessons learned!

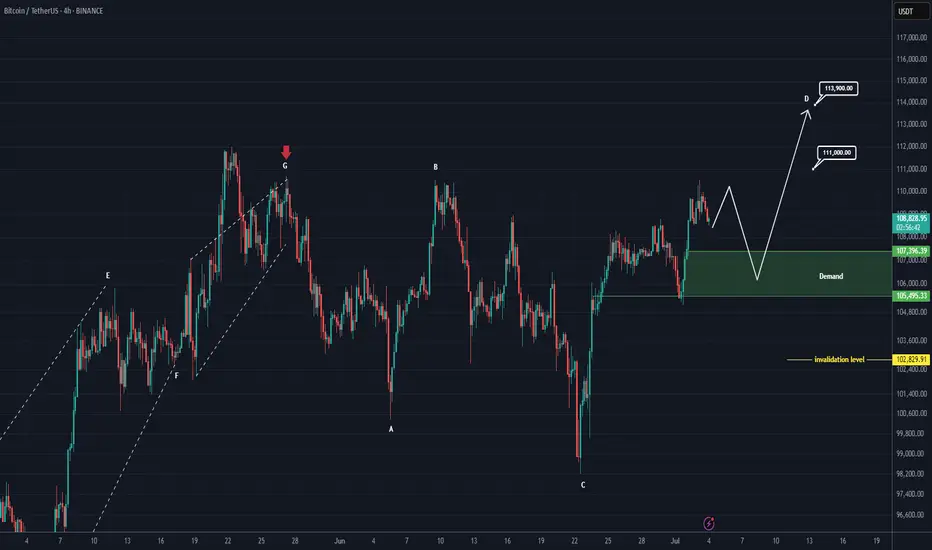
Bitcoin New Update (4H)This analysis is an update of the analysis you see in the "Related publications" section
If we were to publish an update for Bitcoin, wave D could move toward higher levels.
After hitting the green zone and gaining momentum, it could once again move upward to liquidate short positions.
In this update, we've naturally raised and revised the invalidation level.
The new targets have been marked on the chart.
A daily candle closing below the invalidation level would invalidate this analysis.
For risk management, please don't forget stop loss and capital management
Comment if you have any questions
Thank You
Bitcoin - Flag pattern is brokenBitcoin had been consolidating within a flag pattern for the past three months. That pattern has now officially broken to the upside, with the price surging to $109K — a strong bullish signal fueled by encouraging news around institutional adoption.
Based on both the technical flag breakout and ongoing fundamental momentum, the next target for Bitcoin is $145K. Any move beyond that would be considered a bonus in this current bull cycle.
Stay tuned for more updates.
Cheers,
GreenCrypto

Bitcoin shortBitcoin has lost the daily level, has been rejected by weekly level
Not only, but also Bitcoin has lost weekly open, previous week's high and Monday high
I am currently short

Bitcoin Rejected at Value Area High — Full Market Auction Lower?Over the past 24 hours, Bitcoin has seen a short-term pullback after being rejected from the daily resistance level, which aligns with the value area high. The reaction also coincides with a volatility squeeze shown on the Bollinger Bands — hinting at a controlled, technical rejection rather than a panic selloff. If the market follows traditional auction theory, a full rotation toward the value area low may now be in progress.
Key Technical Points:
-Value Area High Rejection: Price was rejected from high time frame resistance and respected auction theory principles
-Targeting $103,000 Value Area Low: Price may rotate lower if resistance continues to cap upside
-$100,000 Psychological Support Untapped: Remains a magnet for liquidity if the range plays out fully
Bitcoin’s structure over the past week has remained range-bound between $108,000 and $100,000. The recent failure to break through the value area high at the upper end of this range has now triggered a controlled pullback — technically expected based on market auction dynamics. Once a value area high is respected and price cannot sustain above it, the natural response is for the market to seek equilibrium by rotating toward the value area low.
This theory aligns with current confluences: the rejection occurred exactly where daily resistance, the value area high, and upper Bollinger Band resistance converged. The rejection was not sudden or erratic, but gradual — indicating that this is likely a technical rejection, not emotional selling. If this rotation plays out as expected, the next key support will be found near the $103,000 region.
What further supports this narrative is the untouched $100,000 psychological level, which remains a natural magnet for both liquidity and sentiment. From a market structure perspective, $100K serves as a clean test zone for buyers to step in and attempt to form a bottom — particularly if the pullback is slow and controlled rather than volatile and sharp. Until then, all signs suggest that the upper limit of the current range has held.
If Bitcoin remains capped beneath $108,000, expect further downside pressure. A full market auction rotation could bring price to $103,000, with the potential to dip as low as the $100,000 psychological level. This zone will be key for judging the strength of buyers and determining whether the range continues or a broader breakdown begins. Only a reclaim of the value area high would invalidate this structure.

Volatility period likely to continue until July 11th
Hello, traders.
Please "Follow" to get the latest information quickly.
Have a nice day today.
-------------------------------------
This volatility period is expected to last until July 11th.
The first volatility period, July 1-7, 3 days passed, and the second volatility period began on July 6.
It is important to explain it in words, but I think it would be better if you could intuitively understand the flow by looking at the chart.
For that reason, I divided the chart into a chart with a trend line drawn and a chart with indicators.
Since the trend line is used as a tool to calculate the volatility period, it is not necessary to show it after the volatility period is displayed.
What we need to look at is the support and resistance points drawn on the 1M, 1W, and 1D charts after the calculated volatility period, or the support in the indicator to find the trading point.
-
It seems that support is being checked around 108316.90, which is the HA-High indicator point of the 1D chart.
Therefore, we need to see if it can rise after receiving support near 108316.90 during this volatility period.
If not, it will eventually show a downward trend.
As a basic trading strategy, we use buying near the HA-Low indicator and selling near the HA-High indicator.
Therefore, considering the current price position, it can be said that it is a section where we should sell to make a profit.
However, since the HA-Low and HA-High indicators are intermediate values, if it falls from the HA-Low indicator, it is possible to show a stepwise downward trend, and if it rises from the HA-High indicator, it is possible to show a stepwise upward trend.
Therefore, we need to respond with a split transaction.
Conditions for continuing the uptrend include:
1. When OBV is above the High Line and shows an upward trend,
2. When PVT-MACD oscillator is above the High Line,
3. When StochRSI is above K > D, showing an upward trend,
If the above conditions are met, there is a high possibility that the uptrend will continue.
-
If it falls below the M-Signal indicator on the 1D chart, it is highly likely that it will select the trend again when it meets the M-Signal indicator on the 1W chart.
At this time, whether there is support near 99705.62 is important.
If it rises, you should check whether it is supported near 111696.21.
If it is not supported, it means that it has not broken through the high point section, so you should prepare for a decline.
The high point boundary section is the 108316.90-111696.21 section.
Therefore, if the price is maintained within this section, there is a possibility that it will continue to attempt to break through upward.
-
Thank you for reading to the end.
I hope you have a successful trade.
--------------------------------------------------
- Here is an explanation of the big picture.
(3-year bull market, 1-year bear market pattern)
I will explain more details when the bear market starts.
------------------------------------------------------

Bitcoin ready to move towards 85,000When a trend line is broken, it suffers for a few days and then moves
Tp1:85000
To2:80000
2p3:63000

Bitcoin Eyes $112K, Liquidity Magnet AheadCRYPTOCAP:BTC Eyeing Breakout?
Bitcoin is consolidating tightly between 107.7K and 108.3K after a strong bounce from local support.
Short-term support has formed near 107.7K, but there's still liquidity below ~106.5K that may get swept before the next move.
If BTC holds above 107.5K and breaks 108.3K cleanly, we could see a quick move toward the $110.6k – $112K liquidation zone, with ATH in sight.
According to HTF, we need a daily close above 110k to confirm it in the HTF.
The market remains bullish unless 106K fails.
Will the magnet zone pull us higher?
Like & follow for more sharp updates.
DYOR. NFA
CRYPTOCAP:BTC BITSTAMP:BTCUSD BINANCE:BTCUSDT

Bitcoin Bulls Are Losing Power - Signal To Sell NOW!!!?Bitcoin Bulls seem to be losing power. If this rising wedge aka Contracting triangle starts to break down, the descending triangle we are trading at will resume and MARKETSCOM:BITCOIN might go as low as $93k!!! Is your trading strategy ready for that?

Bitcoin will Bearish conformed Structureon Thursday Bitcoin Price briefly reclaimed at 110K this morning as macro tailwinds and institutional flows lifted crypto but analysis say clear catalyst is still needed to break all time high after the long impulsive rally earlier in the year.
BTC has been trading with in descending channel on the daily time frame looking after the Long time price will needs break and catch there Support 105K Level if the price stays below more then could next zone formed 102K
You may find more details in the chart i need support from you Guys And feel free to share your thoughts other views in the comments.

$BTC/USDT daily chart $121K next.CRYPTOCAP:BTC just broke out of a descending wedge on the daily chart, a strong bullish signal.
It’s now holding well above key support and the 50-day moving average, showing buyers are in control.
If BTC stays above $106,400, we could see a move toward $121K next.
DYRO, NFA

$BTCUSDT: Bullish trend resumingBitcoin turning bullish in the daily confirming the correction is likely over and longer term timeframe trends will resume next if it gets follow through.
See monthly, it fired a trend on close during June, bullish till EOY easily as per this forecast:
Best of luck!
Cheers,
Ivan Labrie.
BTCUSDTThe Bitcoin market is overbought. I expect a change in trend. A diamond with traders' stop points will be great as a reversal pattern. Let's see

BTCUSDT: Bullish Outlook Following Liquidity Sweepnavigating around pivotal areas defined by Breaker Blocks (BB) and Fair Value Gaps (FVG) on both the 1-hour and 2-hour charts. These zones represent high-probability areas for market reactions, whether as support for continuation or as points for potential short-term retracement before a larger rally.
strongly favors a bullish continuation for BTC. monitor interactions with the identified BB/FVG zones for optimal entry points, anticipating a potential dip to sweep short-term BSL or mitigate imbalances before the next significant leg up.

BTC COMING UP"I believe the price might face a rejection at these levels. I plan to continue my buys from the Fair Value Gap (FVG) zone marked with a dashed line below. Wishing everyone successful trades!

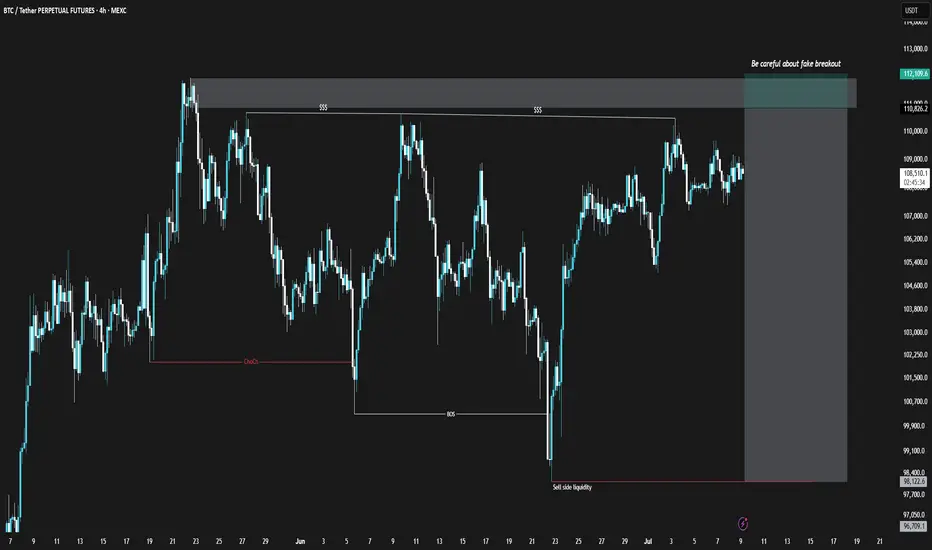
BTCUSDT Short Position (25/Jul/9)Bitcoin, similar to the TOTAL chart, is showing weakness in its bullish momentum. However, unlike TOTAL, the divergence in Bitcoin is clearly noticeable. Additionally, within the marked zone on the Bitcoin chart, there is a possibility of a fake breakout and liquidity grab. I suggest entering only with proper confirmation.
⚠️ This Analysis will be updated ...
👤 Sadegh Ahmadi: GPTradersHub
📅 2025.Jul.9
⚠️(DYOR)
❤️ If you apperciate my work , Please like and comment , It Keeps me motivated to do better
Can #BTC reach a new high?📊Can #BTC reach a new high?
🧠We cannot be too optimistic before we break through ATH, because the daily adjustment expectation still exists.
➡️We are currently in a heavy resistance area near 110,000. This is our third test. Regardless of whether we can successfully break through, don’t chase the rise here, because the cost-effectiveness is not high. If you want to go long, you should also wait patiently for the callback to occur before considering it. Or wait for the callback after breaking through ATH before considering it.
➡️If you want to participate in short trading, you can only participate in a small amount with ATH as a defensive point. Or wait for the rebound after breaking through the upward trend support line before participating.
🤜If you like my analysis, please like 💖 and share 💬
BITGET:BTCUSDT.P

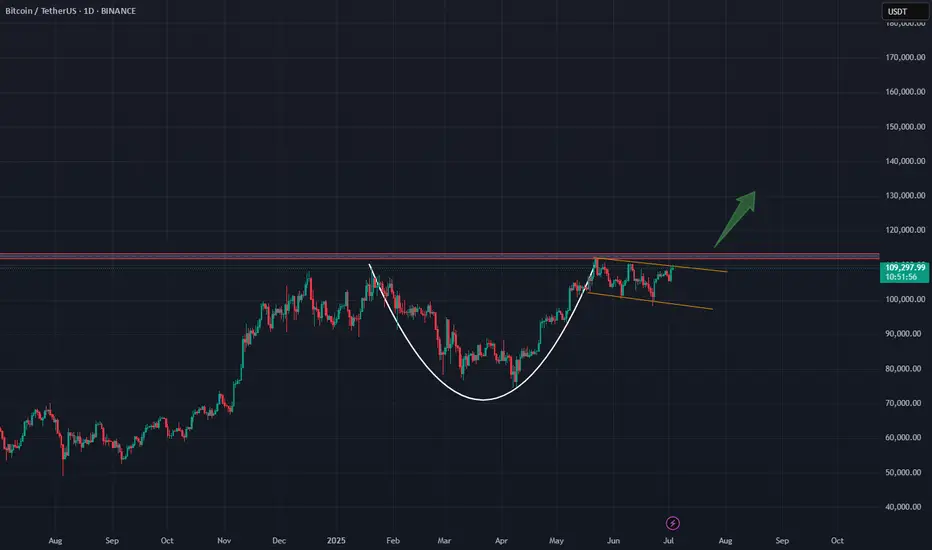
btc usdtbtc usdt
cup patern
I think my eyes are seeing correctly! After the breakout from above and confirmation on the red line, it will move upward.”
Long IdeaI'm seeing a possible bullish cypher pattern forming for the mini blow off top for btc. This mimics the SPX500 and currently in lagging state. Ater that, it will go back around 50k - 60k area, probably to eliminate saylor out before going to the 240k - 280k region..

Bitcoin Price Analysis! What's Next?Bitcoin Price Analysis! What's Next?
From our last analysis, Bitcoin increased from 107K to 108.5K
The price reached the limits of the pattern so far making everything more difficult because it increased, but with very low volume.
This time, BTC added some more data.
You may watch the analysis for further details
Thank you!
