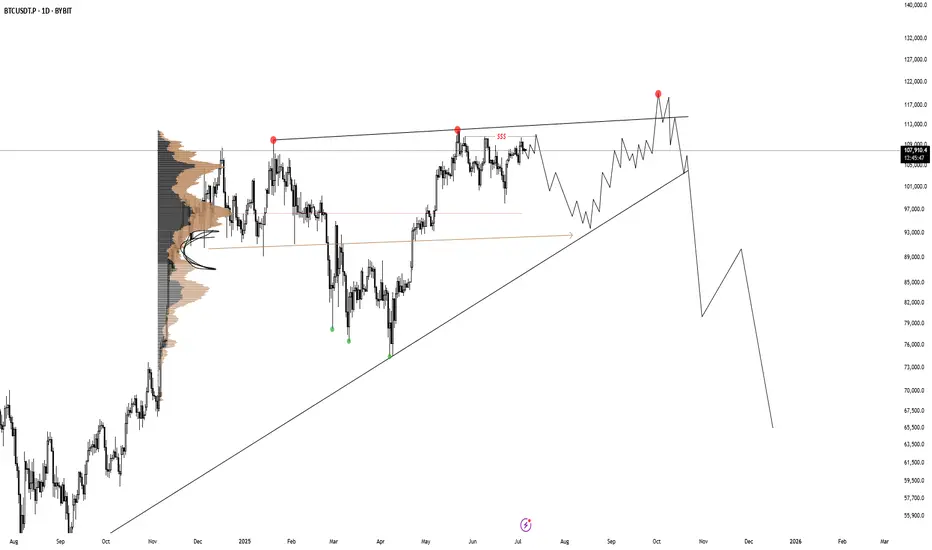
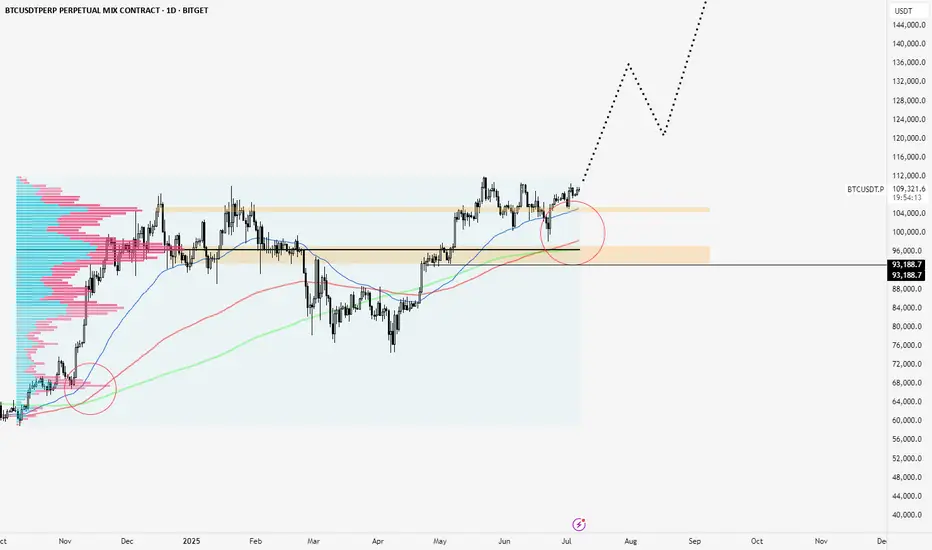
BTC shorting opportunity comes againBTC climbed above 108000 again, and the short-term bullish power was slightly stronger. According to the current strength, BTC still has room for growth, but it is still under pressure in the 109000-110000 area in the short term; if there is no major positive news, BTC may find it difficult to break through the resistance area in the short term under the current conditions, and may even experience stagflation and retreat again after approaching the resistance area.
Therefore, I think shorting BTC with the help of the resistance area is still the first choice for short-term trading. We can boldly short BTC in the 108500-109500 area and look towards the target area around 106000 again.
USTBTC trade ideas

#BTC Rising Wedge📊#BTC Rising Wedge📉
🧠From a structural point of view, we are trading sideways above the support-resistance conversion zone, and the bullish force is gradually weakening. Only if we break through the blue turning point 109669, will new bullish expectations appear, otherwise we need to be alert to the correction at the daily level.
➡️From a graphical point of view, a rising wedge is formed here, and we usually fall according to this model. At present, it has fallen below the lower edge of the wedge and rebounded to the lower edge and was blocked. I expect a further decline.
Let's see👀
🤜If you like my analysis, please like💖 and share💬 BITGET:BTCUSDT.P

BTC HTF Distribution V2This is still the main scenario I'm looking for until it's invalidated. A build up like this, followed by a fake breakout out of this rising wedge as 3rd tap would be perfect.
Bitcoin long back to $110000Recently opened a long position on bitcoin. Aggressive entry. Soon I anticipate a push back up to 110000
4hr trend is still in tact. 1hr trend is bearish failed to make new LL.
Lets see how it goes.
2RR trade roughly.

BTCUSDTIt seems that the price of $110,000 is a strong resistance for Bitcoin, and as long as the price is below $110,000, its trend is bearish, and we can consider the targets of $107,000 and $105,000 for it.

BITCOINBITCOIN ,we are seeing some liquidity and a break of our 4hr supply roof ,if we return to retest in the same zone 108k-107.99k , we might take long position .first target 111k 113k and 116k.
take profit is key, trading is logical probability. If you dont take profit and secure it, the market will turn back and take both your capital and profit because its probability.

BITCOINBITCOIN ,the structure broke back out of the descending trendline on 4hr ,be patient if it comes for retest go long and hope that 110-111k is broken and target 116k-118k.

Bitcoin turns bullish again | Price target = $140k++After 2 months of consolidating within a descending channel, Bitcoin has finally broken out, confirming a major technical breakout and shifting the structure back to bullish. The breakout was followed by a clean retest of the channel resistance turned support, which is now acting as a launchpad for the next leg up.
🧠 Technical Analysis:
Descending Channel Breakout: Price has convincingly broken out of the downward sloping channel, invalidating the bearish structure and flipping it bullish.
Retest Confirmation: The price is currently retesting the upper boundary of the channel — a textbook bullish retest. This confirms buyer strength and shakes out weak hands.
Liquidity Magnet Above 111k: A significant cluster of buyside liquidity sits above 111k. Once that level is breached, expect an explosive acceleration toward 120k.
Measured Move Target: Based on the height of the prior impulse (from April to May), the projected extension points to ~140k.
🌍 Macro & Sentiment Drivers:
ETF Flows & Institutional Demand: U.S. Bitcoin Spot ETFs continue to show consistent inflows, signaling strong institutional accumulation — a major shift in long-term demand.
Fed Pivot Speculation: Expectations for a Fed rate cut later in 2025 are building. Lower interest rates could fuel risk-on sentiment, pushing capital back into crypto.
Big Beautiful Bill: This bill is expected to inject money into the economy, increasing liquidity — ultimately going into crypto. This bill will be signed into law today.
Bullish crypto developments: Settlement of the XRP SEC case, spot crypto ETFs, mainstream crypto adoptions, etc. will all contribute to the bullish sentiment.
🧩 Final Thoughts:
This setup combines strong technical structure, favorable macro tailwinds, and clear liquidity targets. The coming days are critical — if Bitcoin clears 111k cleanly, it could trigger a short squeeze and FOMO-driven rally straight into 120k.

BITCOINBITCOIN , continues to see in flow of liquidity ,investors confidence is high ,institutional adoption could change the layer of demand and supply and set a new bench mark for trading highs and low trading on intraday.
feels good to see that my correction video came 100% correct, now the confirmation will be if 108.03-107.89k will hold support. This is a classic retest to broken 4hr descending trendline ,if we adopt it ,then 111k-113k-116k will be watched.
on a second thought if price adopt the new structure we are selling in 100k-90k and below.
trading is logical probability ,keep that in mind that every key level can be broken, manage your risk, back test on your strategy and make sure you are winning.
there are many ways to win this market without big grammar.
have a blessed new week.

BTCUSD | Long | Breakout Above Value Area High | (July 4, 2025)BTCUSD | Long | Breakout Above Value Area High | (July 4, 2025)
1️⃣ Insight Summary
Bitcoin is showing strong bullish momentum after consolidating sideways. We recently pushed from $99,000 to around $110,750, and now eyes are on whether it can hold above the value area high or break even higher.
2️⃣ Trade Parameters
✅ Bias: Long (bullish)
✅ Entry Zone: Around $111,000 — watch for a clear reaction at this level (especially if retested).
✅ Stop Loss: Below $99,000 — this protects against a deeper pullback if bulls lose control.
✅ TP1: $111,874
✅ TP2: $121,000
✅ TP3 (final target): $135,000
3️⃣ Key Notes
We’re currently seeing buyers step in around the VWAP and higher value area levels, suggesting strong support from big players. Keep an eye on correlated markets like S&P 500 — a possible correction there might temporarily affect Bitcoin’s strength. Always wait for a solid reaction (a bounce or strong volume confirmation) before entering. Avoid chasing blindly; confirm that big players are interested at that level.
The idea of entering on a second touch can offer better risk-reward. The first touch often shows strength, while the second touch is usually the safer entry for many traders.
4️⃣ Follow-up Note
I’ll keep monitoring this setup and share updates if Bitcoin approaches key levels or shows reversal signs.
Please LIKE 👍, FOLLOW ✅, SHARE 🙌 and COMMENT ✍ if you enjoy this idea! Also share your ideas and charts in the comments section below! This is the best way to keep it relevant, support us, keep the content here free, and allow the idea to reach as many people as possible.
Disclaimer: This is not financial advice. Always conduct your own research. This content may include enhancements made using AI.

Monday - Trade of the day Hello I took a week off from trading — life got a bit hectic 🌀. Looking back, I actually needed that break from the charts 🧠💆♂️.
But we’re back this week! Let’s see how many X’s we can cream off the market 💸🔥
Here are the immediate levels I’m watching 👀 — mainly some range deviations from both internal and external ranges.
If we break either side of the range, I’ll be looking to enter from the last supply or demand zone for a continuation 🚀📉📈
That said, I’ll stay mindful of any supply and demand zones that could get in the way ⚠️📊
Let’s get it 💪📅
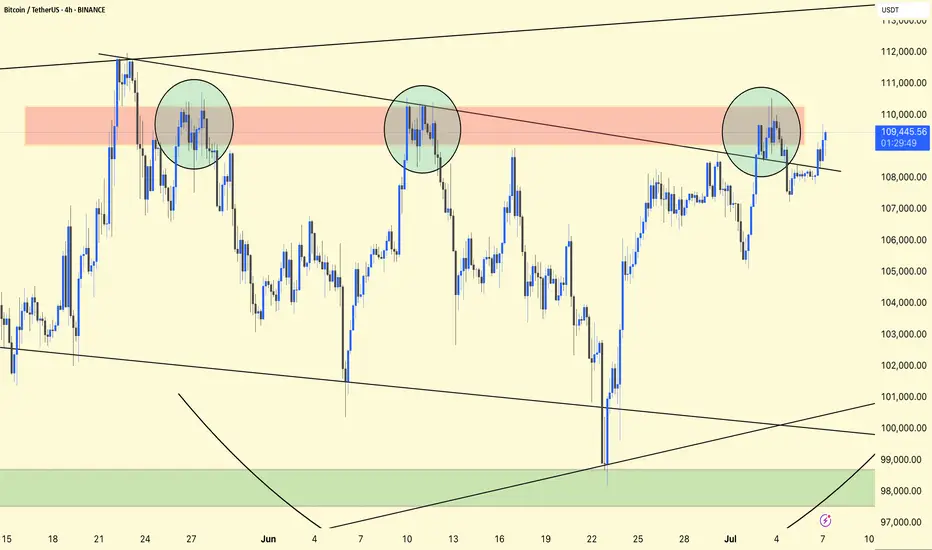
BTC/USDT CHART ANALIYSIS !!BTC/USDT
You have three circles highlighting repeated price rejections around the $109,000–$110,000 area (red resistance band).
A descending trendline connects those high points, creating a sloping resistance.
There is a broad support area around $98,000–$100,000 (green area below).
The price recently broke above the trendline and is now retesting around that $109,000–$110,000 area.
If BTC stays above ~$108,500–$109,000, it could head further towards $112,000–$113,000.
A drop below the trendline and back to $107,500 could trap the bulls, leading to a retest of $105,000 or lower support around $100,000.
Bullish setup: Entry $108,800–$109,200, target $112,000–$113,000, stop-loss below $107,000.
Bearish setup: Short if price rejects $109,500–$110,000, target $105,500, stop-loss above $110,800.
Stay alert!

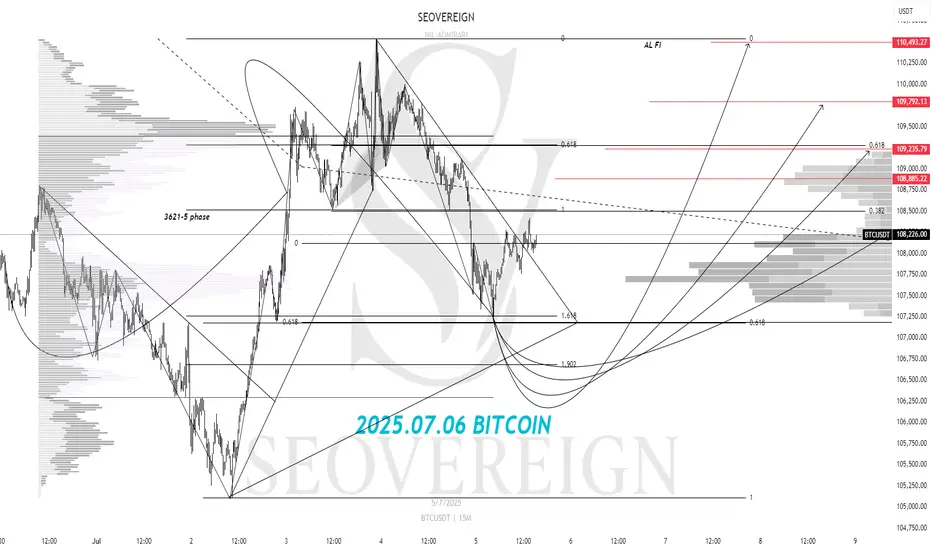
[SeoVereign] BITCOIN Bearish Outlook – July 6, 2025We are the SeoVereign Trading Team.
With sharp insight and precise analysis, we regularly share trading ideas on Bitcoin and other major assets—always guided by structure, sentiment, and momentum.
🔔 Follow us to never miss a market update.
🚀 Boosts provide strong motivation and drive to the SeoVereign team.
--------------------------------------------------------------------------------------------------------
Hello,
This is SeoVereign.
As of July 6, 2025, I present a bullish outlook on Bitcoin.
It has been a while since I last shared a long position perspective.
Those of you who have consistently followed SeoVereign’s ideas would know that, until now, most of the entry points have been centered around short positions. We have closely tracked the market, identifying opportunities amid the downtrend.
However, after comprehensively analyzing the recent overall market atmosphere, we have come to the conclusion that upward pressure is gradually increasing rather than downward pressure. After reviewing technical indicators and wave structures, we have determined that it is reasonable to consider a buy — in other words, a long position — at this stage.
The first target for this idea is set at an average of around 109,500 . This figure is based on a comprehensive judgment that includes the current wave structure, previous key support/resistance zones, and momentum trends. Of course, this target may be flexibly adjusted depending on how the market develops, and if necessary, the rationale will be clearly revised accordingly.
As always, we will continue to track this idea and refine our logic based on the real-time developments and structures, further solidifying the grounds for the long bet.
Wishing you continued good fortune.
BTC: 650 Point Long Trade To 108,650$ (Date: Sat 05 Jul 25)High potential signal as my all signals. Don't miss this opportunity. At least open a trade in demo just to test.
Details:
Entry: Now - 108,100 $
Target Price: 108,650 $
Stop loss: 107,700 $
Trade Ideas:
There is a flag pattern here after a good down trend. So here is possibility for a small pull back till my target price.
Trade Signal:
I provide trade signals here so follow my account and you can check my previous analysis regarding BITCOIN. So don't miss trade opportunity so follow must.
BINANCE:BTCUSDT BINANCE:BTCUSDT.P BYBIT:BTCUSDT.P

Bitcoin Breakout Ahead of Crypto WeekBitcoin has a great chance at cracking new all time highs and breaking out into price discovery this month. On July 14th, the US is considering it Crypto Week. Signing in the GENIUS bill, and more around crypto assets.
Bitcoin has held this volume shelf at around 104/105k for a while and these relative equal highs on the daily look like they can crack. I have highlighted some zones on the chart that I'd consider extremely important levels.
If we do crack these highs , I am on the side that the price action will be extremely expansive after all the work that has been done at those high volume clusters. If it fails I believe we should trade back to the high volume clusters, and if that doesn't hold, then we should trade through the thinner volume to do more business before bouncing off of the POC at around 96.5k.
The 50,150 & 200 EMAs are all signing ideal strength. Virtually all expansions in their early stages from 2023 to now contained these crosses on the Daily TF.
I am long BTC on a high timeframe. Macro narratives are strong, the asset is strong, and the downside is always in our control to be limited.
Bitcoin is in a downward trend.Hello dear friends.
Considering the trend of Bitcoin, it is expected that this Bitcoin will fall to around $100,000.
❌Please note that this is just a prediction, so be careful with your capital.

Bitcoin (BTC) 4H Chart – May see new ATH SOON !!Bitcoin is currently moving tightly within a broad symmetrical wedge structure. Despite multiple fakeouts and low-conviction moves, the price has managed to stay range-bound and is holding above key support, a sign of underlying strength.
Chart Structure:
Price has broken out of the downtrend resistance but is yet to confirm momentum.
The structure suggests a larger move is imminent, with bulls gradually gaining control.
Key Levels:
Immediate Resistance: $108,700
Major Resistances Ahead: $111,862 → $116,818 → $122,341
Immediate Support: $105,189
Major Support Below: $97,205
Potential Setup:
A confirmed breakout above $108,700 with volume could initiate a rally toward the next resistance zones.
Bulls must hold the $105,000 area to avoid another deep pullback into the lower structure.
Bias:
Cautiously bullish — market is waiting for a catalyst to trigger follow-through.
Stay patient, and watch for confirmation through price and volume.
DYOR. Not financial advice.

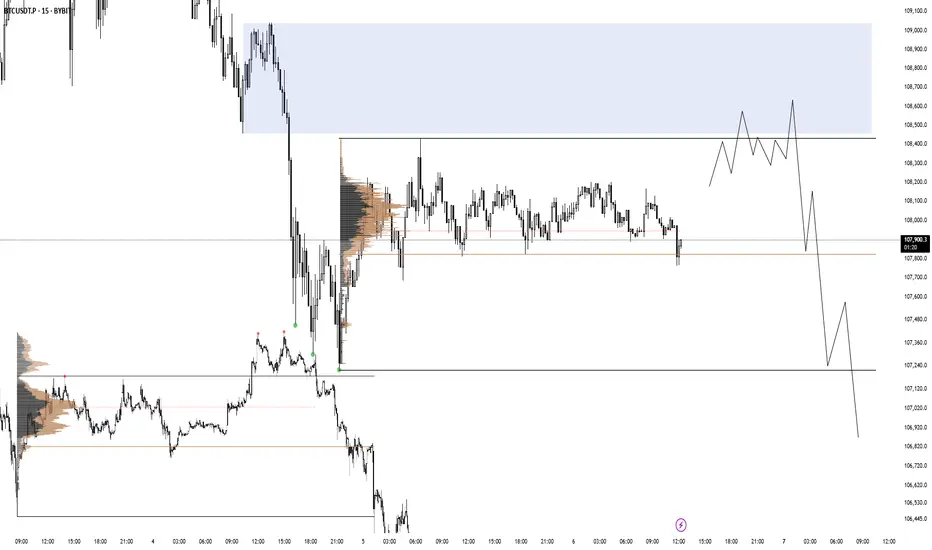
BTC 06.07.25There is a range imbalance with no price action in discount after BTC accumulated on friday afternoon. I am looking for a valid distribution like in the picture on the left.
Bitcoin will Return all-time high Interestingly Bitcoin (BTC) has not been particularly impressive over the weekend, which has been a somewhat consistent theme of the cryptocurrency market so far in the year 2025. The premier cryptocurrency continues to hover around the $108,000 mark, showing signs of indecision amongst the investors.
Resistance zone 111K
Support zone 107K
The conversation has been about when the Bitcoin price will return to its all-time high. Interestingly, the latest on-chain data shows that investors are becoming increasingly confident in the long-term promise of the flagship cryptocurrency.
Hope you can understand all our chart Pattern According the Bitcoin analysis.
Thanks for your Support.
if you found this analysis share you Opinion in comments I'm Tankful from you.

Bitcoin(BTC): Buyers Took Control | $120K is More Than RealisticBitcoin is getting ready to form a new all-time high (ATH), where after a slight rejection near the $110K area, buyers are back.
As we had recently broken the major resistance zone, and now we are seeing signs of a successful retest to occur as well, we are looking for proper volume to come in, which would then give us a possible BOS here; that's what we are looking for.
As soon as we form that BOS near $110K, we will be looking for another healthy bullish movement.
Swallow Academy

BTC Analysis (4H)This analysis is an update of the analysis you see in the "Related publications" section
Since the red arrow was placed on the chart, Bitcoin's bullish phase has ended and it has entered a corrective phase. This correction appears to be forming a Diametric pattern, and we are currently in the middle of wave E.
After interacting with the demand zone, the price may move toward the specified targets.
A daily candle closing below the invalidation level will invalidate this analysis.
For risk management, please don't forget stop loss and capital management
Comment if you have any questions
Thank You

BITCOINBITCOIN , continues to see in flow of liquidity ,investors confidence is high ,institutional adoption could change the layer of demand and supply and set a new bench mark for trading highs and low trading on intraday.
feels good to see that my correction video came 100% correct, now the confirmation will be if 108.03-107.89k will hold support. This is a classic retest to broken 4hr descending trendline ,if we adopt it ,then we buying into 111k-113k-116k watch it critically.
On a second thought if price adopt the new structure we are selling in 100k-90k and below.
trading is logical probability ,keep that in mind that every key level can be broken, manage your risk, back test on your strategy and make sure you are winning.
there are many ways to win this market without big grammar.
have a blessed new week.
