Understanding SFP In Trading1. What is a Swing Failure Pattern (SFP)?
A Swing Failure Pattern (SFP) occurs when the price temporarily breaks a key swing high or low but fails to continue in that direction, leading to a sharp reversal.
This pattern is often driven by liquidity grabs, where price manipulates traders into taking positions before reversing against them.
An SFP typically consists of:
A false breakout beyond a previous swing high/low.
A sharp rejection back within the prior range.
A liquidity grab, triggering stop-loss orders and fueling a reversal.
SFPs provide powerful trade opportunities, signaling potential reversals and the exhaustion of trends.
2. Understanding Liquidity Grabs & Stop Hunts
The financial markets are structured around liquidity. Large institutions and algorithmic traders require liquidity to execute their large orders efficiently.
One way they achieve this is by triggering liquidity grabs and stop hunts.
Liquidity Grab:
Occurs when price moves beyond a key level (e.g., swing high/low), activating orders from breakout traders and stop-losses of trapped traders.
Smart money absorbs this liquidity before pushing the price in the opposite direction.
Stop Hunt:
A deliberate price movement designed to trigger stop-loss orders of retail traders before reversing.
Often seen near major support and resistance levels.
These events are crucial for understanding SFPs because they explain why false breakouts occur before significant reversals.
3. Why Smart Money Uses SFPs
Institutions, market makers, and algorithmic traders use SFPs to:
Fill large orders: By grabbing liquidity at key levels, they ensure they can enter large positions without causing excessive price slippage.
Manipulate retail traders: Many retail traders place stop-losses at obvious swing points. Smart money exploits this by pushing the price beyond these levels before reversing.
Create optimal trade entries: SFPs often align with high-probability reversal zones, allowing smart money to enter positions at better prices.
Understanding how institutions operate gives traders an edge in identifying manipulative moves before major price reversals.
4. Market Structure & SFPs
Market structure is built upon a series of swing highs and swing lows. Identifying these key points is crucial because they represent areas where liquidity accumulates and where price is likely to react.
Swing High (SH): A peak where price makes a temporary high before reversing downward.
Swing Low (SL): A trough where price makes a temporary low before reversing upward.
Types of Swing Points in Market Structure
Higher Highs (HH) & Higher Lows (HL) – Bullish Trend
Lower Highs (LH) & Lower Lows (LL) – Bearish Trend
Equal Highs & Equal Lows – Range-Bound Market
5. Liquidity Pools: Where Traders Get Trapped
Liquidity pools refer to areas where traders' stop-loss orders, pending orders, and breakout entries accumulate. Smart money uses these liquidity zones to execute large orders.
Common Liquidity Pool Zones:
Above swing highs: Retail traders place breakout buy orders and stop-losses here.
Below swing lows: Stop-losses of long positions and breakout sell orders accumulate.
Trendline & Range Liquidity:
Multiple touches of a trendline encourage traders to enter positions based on trendline support/resistance.
Smart money may engineer a fake breakout before reversing price.
6. Identifying Bullish SFPs
SFPs can occur in both bullish and bearish market conditions. The key is to identify when a liquidity grab has occurred and whether the rejection is strong enough to confirm a reversal.
Bullish SFP (Swing Low Failure in a Downtrend)
Price sweeps a key low, triggering stop-losses of long traders.
A strong rejection wick forms, pushing price back above the previous low.
A shift in order flow (bullish market structure) confirms a potential reversal.
Traders look for bullish confirmation, such as a higher low forming after the SFP.
Best bullish SFP setups occur:
At strong support levels
Below previous swing lows with high liquidity
After a liquidity grab with momentum confirmation
7. Identifying Bearish SFPs
Bearish SFP (Swing High Failure in an Uptrend)
Price takes out a key high, triggering stop-losses of short traders.
A sharp rejection forms, pushing the price back below the previous high.
A bearish shift in order flow confirms downside continuation.
Traders look for bearish confirmation, such as a lower high forming after the SFP.
Best bearish SFP setups occur:
At strong resistance levels
Above previous swing highs where liquidity is concentrated
With clear rejection wicks and momentum shift
8. How SFPs Signal Reversals
SFPs provide early warning signs of trend reversals because they expose areas where liquidity has been exhausted.
Once liquidity is taken and the price fails to continue in that direction, it often results in a strong reversal.
Key Signs of a Strong SFP Reversal
Long wick rejection (indicating absorption of liquidity).
Close back inside the previous range (invalidating the breakout).
Increased volume on the rejection candle (confirming institutional activity).
Break of short-term market structure (trend shifting).
Divergences with indicators (e.g., RSI divergence at the SFP).
9. Identifying High-Probability SFPs
One of the most critical aspects of a valid SFP is how the price reacts after a liquidity grab. The candle’s wick and close determine whether an SFP is strong or weak.
A. Wick Rejections & Candle Closes
Key Features of a Strong SFP Wick Rejection
Long wick beyond a key swing high/low (indicating a liquidity grab).
Candle closes back inside the previous range (invalidating the breakout).
Engulfing or pin bar-like structure (showing aggressive rejection).
Minimal body size relative to wick length (e.g., wick is 2–3x the body).
Bullish SFP (Swing Low Failure)
Price sweeps below a key low, triggering stop-losses of buyers.
A long wick forms below the low, but the candle closes back above the level.
This signals that smart money absorbed liquidity and rejected lower prices.
Best bullish SFPs occur at major support zones, previous swing lows, or untested demand areas.
Bearish SFP (Swing High Failure)
Price sweeps above a key high, triggering stop-losses of short sellers.
A long wick forms above the high, but the candle closes back inside the range.
This signals that smart money absorbed liquidity and rejected higher prices.
Best bearish SFPs occur at resistance levels, previous swing highs, or untested supply areas.
❌ Weak SFPs (Avoid These)
❌ Wick is too small, meaning the liquidity grab wasn’t significant.
❌ Candle closes above the swing high (for a bearish SFP) or below the swing low (for a bullish SFP).
❌ Lack of strong momentum after rejection.
B. Volume Confirmation in SFPs
Volume plays a crucial role in validating an SFP. Institutional traders execute large orders during liquidity grabs, which often results in spikes in trading volume.
How to Use Volume for SFP Confirmation
High volume on the rejection wick → Indicates smart money absorption.
Low volume on the breakout move → Suggests a lack of real buying/selling pressure.
Increasing volume after rejection → Confirms a strong reversal.
Spotting Fake SFPs Using Volume
If volume is high on the breakout but low on the rejection wick, the move may continue trending rather than reversing.
If volume remains low overall, it suggests weak market participation and a higher chance of chop or consolidation instead of a clean reversal.
Best tools for volume analysis:
Volume Profile (VPVR)
Relative Volume (RVOL)
Footprint Charts
10. Key Takeaways
SFPs are Liquidity Grabs – Price temporarily breaks a key high/low, triggers stop losses, and then reverses, signaling smart money absorption.
Wick Rejection & Close Matter – A strong SFP has a long wick beyond a swing point but closes back inside the range, invalidating the breakout.
Volume Confirms Validity – High volume on rejection wicks indicates smart money involvement, while low-volume breakouts often fail.
Higher Timeframes = Stronger SFPs – 1H, 4H, and Daily SFPs are more reliable than lower timeframe setups, reducing false signals.
Confluence Increases Probability – SFPs are most effective when aligned with order blocks, imbalances (FVGs), and major liquidity zones.
Optimal Entry Methods Vary – Aggressive entries capitalize on immediate rejection, while confirmation and retracement entries improve accuracy.
Proper Stop Loss Placement Prevents Fakeouts – Placing SL just beyond the rejection wick or using structure-based stops reduces premature exits.
Take Profit at Key Liquidity Levels – Secure profits at previous swing highs/lows, order blocks, or imbalance zones to maximize returns.
USTBTC trade ideas

BTC - Daily Chart - Bull flag route 7/1/2025July 1st, 2025
BTC - Daily Chart
A bull flag route = Two Scenarios
1. Breakout - UP
- Retrace before the $105k area
- Consolidate
- Break out the top line
SL $104k
TP1 @ 108k
TP2 @ 111k
Final TP @ 113k NEW ATH
2. Fail support - DOWN
- 105k fail to support
- Aim for the button of the flag for support
SL $106k
TP @100k
Final TP @96k

do not SHORT Bitcoin with 20XA consolidation range happens when the market trades sideways, in a neutral capacity. This sideways trading is neither bearish nor bullish, thus neutral. The bearish or bullish tendencies can only be defined based on the broader market structure.
If the consolidation range develops coming from a major drop, you can say that the market is bearish and the consolidation a bearish consolidation even if the breakout happens to the upside. Once it happens to the upside we can say that a reversal developed but the tendencies were bearish nonetheless.
If the consolidation range develops coming from a major rise, you can easy say while being correct that the market is bullish and the consolidation phase a bullish one, because of the bigger structure, previous price action and the chart.
Bitcoin is consolidating with bullish tendencies but there is a boundary which we call resistance and another boundary which we call support, this is the trading range. When the market is ranging, this is when margin traders lose the most because the trend remains hidden and money tends to be made when the market is in a clear trend.
Whenever the upper boundary gets challenged we get a retrace and a test of support. Whenever the lower boundary gets tested prices recover and move back up. This process gets repeated for as long as it is needed to remove all the weak hands, most of the signals are pure noise.
This is the situation in which we find Bitcoin today. Ultra-bullish but sideways and anything can happen short-term. Do not SHORT Bitcoin with 20X. You might end up with some fast and easy profits.
Thank you for reading.
Namaste.

Middle East peace/war = Bitcoin’s Explosive Price CoilDo you know why every time tensions rise in the Middle East, Bitcoin springs upward like a compressed coil?
This market reaction isn’t just a coincidence it’s the result of a mix of psychological and economic factors we’ll explore today.
Get ready to understand how these crises can create golden opportunities for the world’s favorite digital currency.
Hello✌
Spend 3 minutes ⏰ reading this educational material.
🎯 Analytical Insight on Bitcoin:
Price is approaching a significant support level that has held strong historically. A potential rebound from this zone could lead to at least a 7% upside move 📈, with the primary target set around $115,000—near a key descending trendline on the daily chart. Watching this level closely for confirmation 🔍.
Now , let's dive into the educational section,
Market Psychology: When War Plays with Fear and Greed 🧠
Middle East crises act like a spring: when released, they trigger intense fear in the market. Many traders react emotionally and start selling their holdings. The key point: this fear often flips into greed.
When Bitcoin’s price drops due to war fears, savvy traders seize the opportunity and enter the market. This cycle of fear and greed causes Bitcoin’s price to surge faster than usual just like a compressed spring suddenly releasing.
If you understand these market emotions and trade without bias, you can maximize gains from such volatility.
Key TradingView Tools for Bitcoin Analysis 📊
When the Middle East conflict heats up, market volatility spikes, affecting Bitcoin as a high-risk asset.
Using essential indicators like RSI , Fibonacci retracements , and volume on TradingView helps you pinpoint precise entry and exit points and better understand market reactions.
Practical Tips for Better Tool Usage ⚙️
To get the most out of TradingView:
Activate several indicators simultaneously and compare price movements with volume.
Draw Fibonacci retracements on previous trends to find key support and resistance levels.
Check RSI to see if Bitcoin is overbought or oversold.
Monitor trading volume to confirm momentum shifts.
This approach turns your analysis from guesswork into a logical, actionable strategy.
How Middle East War Drives Bitcoin Growth: Final Analysis 🚀
As tensions escalate, investors seek safe-haven assets, and Bitcoin, known as digital gold, attracts massive attention. Also, banking restrictions and sanctions push liquidity toward cryptocurrencies.
These condition s, combined with market psychology and the analytical tools we covered, make Bitcoin behave like a compressed spring that suddenly leaps upward, driving significant growth. Traders aware of these trends and skilled in using indicators and sentiment can find better profit opportunities.
Recommendations 📌
Geopolitical tensions in the Middle East act as a powerful trigger for Bitcoin volatility. Understanding market psychology, smart use of TradingView tools, and having a solid risk management strategy are key to success in such times. I recommend keeping an eye not just on technical analysis but also on market sentiment and political news to make the best timely decisions.
✨ Need a little love!
We put so much love and time into bringing you useful content & your support truly keeps us going. don’t be shy—drop a comment below. We’d love to hear from you! 💛
Big thanks,
Mad Whale 🐋
📜 Please remember to do your own research before making any investment decisions. Also, don’t forget to check the disclaimer at the bottom of each post for more details.

Bitcoin New ATH Targeting $115K–$120KAfter topping out at the previous ATH, Bitcoin formed a classic diamond top pattern which triggered a drop to the $98,115 level. Now, Bitcoin appears to be forming a second diamond — but this time, the breakout structure suggests a bullish reversal rather than a top.
This second diamond formation indicates consolidation before a strong upward move, potentially driving BTC toward a new all-time high between $115K and $120K.
Watch for confirmation of the breakout. If price holds above key resistance levels post-pattern, the bullish scenario gains strength.

BTCUSDT – Accumulation Confirmed? Wyckoff Blueprint Playing Out Bitcoin continues to compress inside a defined range, resting above both a rising trendline and a former resistance turned support zone. This structure fits cleanly within a Wyckoff-style Accumulation Phase (B-C).
We’re now at a critical moment where smart money may be absorbing supply, preparing for the next phase.
🔍 Key Observations:
Range-bound price action with higher lows and muted volume
Spring-like wick and recovery from the bottom of the range
Support holding at prior breakout zone and ascending trendline
Structure shows signs of stealth accumulation with a possible breakout ahead
Sideways movement with fading volatility
Gradual compression within the range
Strong support defended multiple times (might make the support weaker as well !)
A potential spring/retest event may already be in play
You’ll see fakeouts, wicks, and hesitation in this phase — designed to trap weak hands. But the underlying behavior points to preparation, not distribution.
The quiet before the markup. Let the market reveal its hand. 📈

BTC/USDT 4H – High-Probability Decision Point Ahead Bitcoin is currently retesting a confluence-rich zone — a textbook decision area where structure meets sentiment.
🔻 What’s in play?
🟥 Demand Zone / Bullish Order Block / Breaker Block (visible on 1H)
📈 Third-touch test of the ascending trendline – statistically known to trigger strong moves
⚪ Price sitting just above the 200 EMA acting as dynamic support
🧱 Prior resistance flipped to support — now being validated again
Despite the correction, structure remains intact. This is a healthy retracement unless price starts closing below trendline + zone with volume.
🔀 Possible Outcomes:
Bounce: If buyers step in here, this could mark the next leg in the uptrend.
Breakdown: A strong close below the zone/trendline could shift structure and sentiment bearish.
⚠️ No trade bias here — let price show its hand.
💬 What’s your view — bounce or break? Comment below!
✍️ Chart marked with structure logic only — not financial advice.

BTCUSDT Daily – Bullish Engulfing = Big Move?Whenever we've seen a bullish engulfing candle on the daily timeframe, it’s often followed by a strong upward move. This pattern has repeated consistently throughout the current cycle.
🔹 The recent daily close shows a clean bullish engulfing right off the 50 EMA support.
🔹 Previous purple zones also highlight areas where similar engulfing candles led to sharp rallies.
🔹 Price is once again reclaiming momentum after a liquidity sweep — a classic accumulation signal.
📈 If history repeats, we could be eyeing another leg higher toward the $112K–$115K zone.
Pattern Psychology:
"This bullish engulfing isn’t just a candle — it's a sentiment shift, where buyers overpower sellers completely in one session."
🔹EMA Bounce Strategy:
"Price is using the 50 EMA as a trampoline — a typical smart money support zone."
🔹 Rejection of Breakdown Narrative:
"The fakeout below 100,582 support could be a classic bear trap, setting up for a liquidity-driven rally."
🔹 Pivot Zone Reaction:
"Immediate pivot zone (102,292) reclaimed — price now in a favorable position to target next R1 around 110,000."
🔹 Historical Context:
"This setup mirrors the March bounce, where similar structure and RSI/MACD confluence led to a 12% surge."
⚠️ Disclaimer:
This is not financial advice or a buy/sell recommendation. Analysis is for educational purposes only.
All chart markings and interpretations are original.

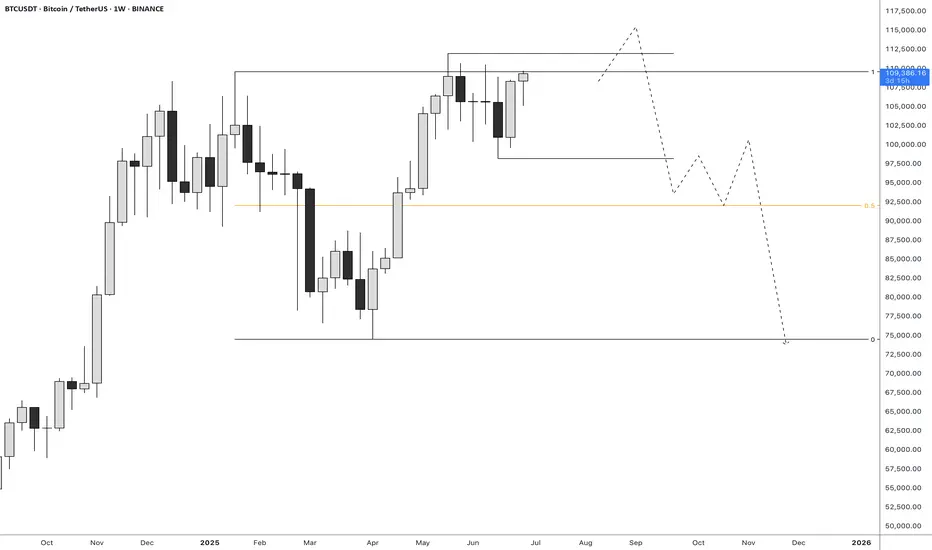
BTC Breakdown Escalates Bearish MomentumBitcoin has officially broken below the critical 104K support level, invalidating the recent short-term bullish structure. The price action reflects a clear shift in market sentiment, confirmed by the bearish EMA/SMA crossover and a firm rejection from the strong supply zone between 110K–111.8K.
This rejection formed a clean lower high around 110K, followed by a decisive drop below the weak supply area and failure to hold 104K a key level previously acting as a demand floor. The current structure now favors downside continuation, with the 98K zone as immediate focus.
If bearish momentum persists, attention will shift toward the Weak Potential Reversal Zone and eventually the Recommended Buy Back Zone around the 84K–86K area. This zone aligns with a historical support range and may offer high-probability entries for medium-term accumulation.
Until price reclaims the 104K–105.5K region, rallies are likely to be sold off within the supply zones. Short-term traders may look to trade the breakdown toward the highlighted support levels, while long-term investors should monitor price reaction within the buyback region.

How to Trade Smart Money Concepts (SMC)\ How to Trade Smart Money Concepts (SMC)\
\ This article explores the foundation, key tools, and practical insights of Smart Money Concepts — and why it’s worth your attention.\
In today's fast-changing financial landscape, Smart Money Concepts (SMC) has become a popular strategy among modern traders. But what is SMC exactly, and how can it improve your trading decisions? This article breaks it down in a simple, professional way for traders at all levels.
---
\ What Are Smart Money Concepts?\
SMC is a trading approach based on the belief that large institutions ("smart money") like banks and hedge funds control most of the market's movements. These institutions often move the market in ways that confuse or trap retail traders. The goal of SMC is to understand and follow the footsteps of these big players.
Instead of relying on simple patterns or indicators, SMC focuses on:
\ - Market structure\
\ - Supply and demand zones\
\ - Liquidity pools\
By aligning your trades with the behavior of smart money, you can position yourself more strategically in the market.
---
\ Key SMC Concepts Explained\
\ Order Blocks\
Order blocks are zones on the chart where large institutions have placed significant buy or sell orders. These zones often lead to strong price reactions and act as hidden support or resistance levels. Order blocks are considered more precise than traditional supply and demand areas.
Example: ()
\ Fair Value Gap (FVG)\
A Fair Value Gap occurs when price moves sharply in one direction, leaving a gap or imbalance in the price action. These areas often get filled later and can act as magnets for price.
In a bearish move, the FVG is the gap between the low of the previous candle and the high of the next one. In a bullish move, it's the reverse.
Example: ()
\ Timeframe Consideration\
If you can’t monitor charts during the day, avoid relying on 5–30 minute setups. Consider 4H or daily timeframes for clearer signals and more manageable trading decisions.
\ Liquidity\
Liquidity refers to price zones where lots of pending orders exist. These are usually at obvious highs, lows, or trendlines. Smart money often targets these areas to trigger stop-losses and generate movement.
One common tool to identify liquidity is a "pivot point," which is a candle with a lower low or higher high than its neighbors.
Example: ()
\ Break of Structure (BOS)\
BOS occurs when price breaks above or below a previous high or low, signaling a possible trend continuation.
Example: ()
\ Change of Character (ChoCH)\
ChoCH happens when the market changes direction. For example, if price breaks a higher low in an uptrend, it may signal a reversal.
Example: ()
Combined with BOS: ()
---
\ How SMC Compares to Wyckoff\
The idea of "smart money" isn't new. Richard D. Wyckoff, a pioneer in technical analysis, laid the foundation for understanding market cycles driven by institutions. His price cycle theory includes four phases:
\ 1. Accumulation\
Smart money buys while the public is unaware.
\ 2. Markup\
Price rises as smart money pushes the market.
\ 3. Distribution\
Smart money sells into public buying.
\ 4. Markdown\
Price falls as the cycle completes.
SMC borrows from this logic but focuses more on structure and liquidity zones. Still, the core idea is the same: understand what big players are doing, and follow them.
\ For deeper insights into Wyckoff, explore additional resources focused on accumulation/distribution cycles.\
---
\ Summary\
Smart Money Concepts give traders a deeper look into market mechanics. By focusing on order blocks, fair value gaps, liquidity, and structure breaks, SMC helps identify high-probability trade setups based on institutional behavior.
It may seem complex at first, but once you understand the basics, SMC can become a powerful tool in your trading strategy. Whether you’re new or experienced, aligning with smart money can improve your edge in the market.

Bitcoin breakout is very closeBitcoin looks like it wants to break above its resistance and push upwards. My prediction still stands of 150-165k as cycle top.
Resistance levels (based on fib extension)
121.5k (0.618)
136k (1.00)

BTC — Major Resistance & Long TP Zone1. TP longs in red resistance zone (110k–111k)
2. Watch for rejection: possible short setup on bearish reaction
3. Key support at 105k — monitor for bounce
4. If price holds above red zone, scenario invalid — look for breakout

BTC - Falling Correction = Continuation?BTC has been playing by the rules lately!
Every time Bitcoin forms a falling correction, it turns out to be a bullish continuation pattern — and history might be repeating itself 👀
As shown on the chart:
Previous falling channels (flag/wedge structures) have consistently led to strong bullish impulses.
The current correction also appears to be a falling channel, hinting at another potential bullish leg soon.
As long as the structure holds and no major support is broken, the next target could be a new all-time high.
Let’s see if BTC continues to respect this textbook behavior.
📌 Remember: Falling corrections in an uptrend = healthy continuation!
📚 Always follow your trading plan regarding entry, risk management, and trade management.
Good luck!
All Strategies Are Good; If Managed Properly!
~Rich

BITCOIN BITCOIN ,instead of forecasting the price movement, i will follow its price action,
break of the current supply roof on 3hr is a buy confirmation and target will be 115-117k and if we retest and fail to break the descending 3hr supply roof we are selling and target will be 94k (ema+sma ) strategy 4hr demand floor and aggressive sell will be around 90k zone .
NOTE ;everybody is a good trader ,but not everyone is patient enough to wait for a free trade.
trading is 100% educated probability ,don't take it personal.
focus on learning ,rather than how rich you want to become overnight.

BTC - Probable SHORT Scenario My main trading principle is that the price always moves from swept liquidity levels to untouched liquidity levels.
In particular case we clearly can see the following context: price swept 1M key liquidity level and left untouched level lower + forming LTF range.
But to take more statistically probable trades we should wait for some type of lower timeframe confirmation, and in this case we should wait for MSB or reaching 0,5 range mean
Your success is determined solely by your ability to consistently follow the same principles.
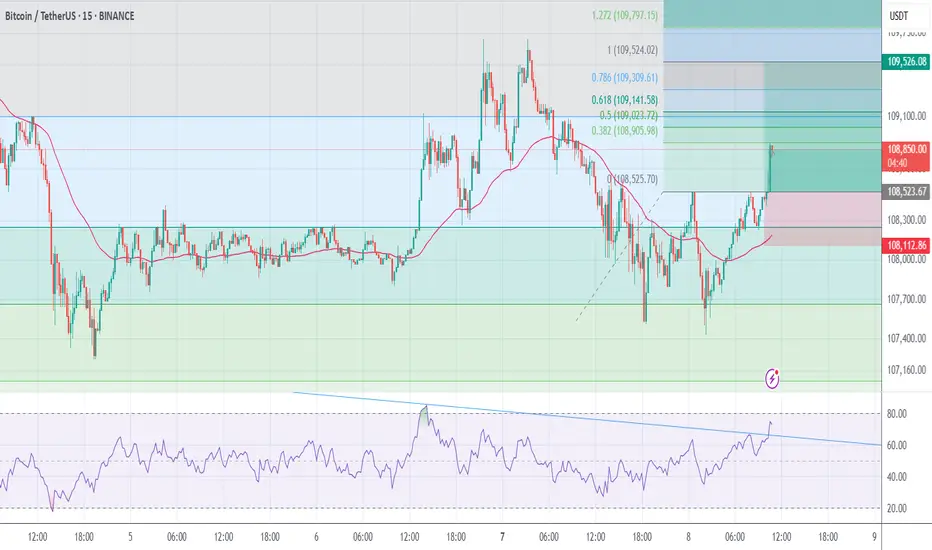
Bitcoin Approaches PRZ – Will the Falling Wedge Break ?Bitcoin ( BINANCE:BTCUSDT ) failed to break through the Support zone($106,800-$105,820) after attacking it five times , and started to rise again.
Bitcoin is currently moving near the Resistance zone($109,220-$108,280) , Cumulative Short Liquidation Leverage($108,800-$108,085) , Potential Reversal Zone(PRZ) , and Resistance lines .
From a Classical Technical Analysis perspective , Bitcoin's movements over the past two days seem to have formed a Falling Wedge Pattern .
From an Elliott Wave theory perspective , Bitcoin appears to have completed the main wave 4 within the Falling Wedge Pattern. The structure of the main wave 4 was a Double Three Correction(WXY) .
I expect Bitcoin to attack the Resistance lines after breaking the upper line of the Falling Wedge Pattern . If Bitcoin fails to break the Resistance lines before the global markets close , we can expect Bitcoin to fall again. Because entering Saturday and Sunday , the trading volume is generally low , and I think Bitcoin needs a lot of volume to break the resistances .
Do you agree with me?
CME Gap: $106,645-$106,295
Cumulative Long Liquidation Leverage: $106,055-$105,430
Note: If Bitcoin manages to break the Support zone($106,800-$105,820), we should expect further declines.
Please respect each other's ideas and express them politely if you agree or disagree.
Bitcoin Analyze (BTCUSDT), 1-hour time frame.
Be sure to follow the updated ideas.
Do not forget to put a Stop loss for your positions (For every position you want to open).
Please follow your strategy and updates; this is just my Idea, and I will gladly see your ideas in this post.
Please do not forget the ✅' like '✅ button 🙏😊 & Share it with your friends; thanks, and Trade safe.

BTC-USDT Market Analysis for the Last 24 Hours
Hello, crypto enthusiast! 👋 Let’s see what has been happening with Bitcoin over the past 24 hours!
🔍 Price Action
Bitcoin dipped slightly during the day, sliding from ~108,970 USDT to a current price of about 108,166 USDT. That’s a decline of roughly 0.7 %—nothing too dramatic for the crypto market! 😉
📰 Hot News
• John Bollinger (renowned technical analyst) said that “Bitcoin is close to a breakout”; many analysts remain upbeat despite the small pullback.
• South Korea is seeing explosive crypto-market growth: total capitalization has topped $74.8 billion, and daily trading volume has reached $10.7 billion—higher than on the country’s two main stock exchanges!
• Fun fact: Korea’s well-known “kimchi premium” means crypto prices there can run about 10 % above global levels due to strong local demand. 🌶️
📊 Technical View
During the last 24 hours BTC traded between $107,393 and $109,048. Volumes were especially heavy from 21:00 to 22:00 on 7 July, when more than 100 million USDT changed hands.

BTC Price Prediction Price breaks down from inside the channel and turns bullish from a point between 106500 (very high probability) and 102500 (low probability).
Volume Weighted Average Price
Classical Technical Analysis
Rising Wedge Formation
Elliot Wave - Correction Wave
Pitchfan
Harmonic - Potential Bullish Gartley
Smart Money Concept
ICT

Bitcoin Prepares for Upward MoveBitcoin has formed a flag pattern, indicating consolidation at a structural base. A confirmed breakout on the daily chart would strengthen the case for a continued upward trend.

BTCUSDT | 30-min & 4H Outlook🔍 Structure & Price Action
BTC is trading within a rising wedge (blue lines) nearing apex — typical bearish setup.
Price is repeatedly getting rejected near macro trendline (~108.8K–109K).
30-min shows clean breakdown from lower wedge support, retesting the zone now.
On 4H, BTC is still under key resistance zone between 109.6K–110.4K, previously rejected twice.
🔻 Bearish Signals
Multiple Sell signals on both timeframes.
Bearish divergence visible in RSI and MACD on 4H.
Volume spike on the breakdown → confirming sellers in control.
🔑 Key Levels
Support: 107.7K (current zone) → loss opens path to 106.6K, then 104.4K.
Resistance: 108.9K–109.4K = confluence of EMA cluster + macro TL + Fib zone.
📊 Indicators (4H)
RSI dropping from mid-zone (~48), no bullish momentum
DMI shows increasing ADX with -DI over +DI → trend strengthening bearish
TSI & Wave Trend both curling down
Stochastic in overbought, starting to reverse
🎯 Summary
Bias: Bearish below 108.6K
Invalidation: Bullish breakout above 109.6K + volume close
Setup: Watch for retest and rejection at ~108.4K–108.6K = clean short trigger
Next Targets: 107.2K → 106.6K → 104.5K

BTC BIG SHORT!We did a mirror retest, and many other signals also point to a sharp decline, indicating numerological codes 69/96.

Bitcoin Just Broke Out! Is $117K Next? (MA50 + Fibo 161% Confirm🚨 MAJOR BTC MOVE!
After weeks of consolidation, Bitcoin has officially broken the downtrend and showed a strong bounce from the MA50, turning previous resistance into support.
📈 Setup Breakdown:
✅ Downtrend breakout confirmed
✅ Clean reaction from MA50
✅ Long entry triggered with upside targets
🎯 Target 1: $112,644 (161% Fibo)
🎯 Target 2: $117,351
📊 This could be the beginning of a new leg up. Watch price behavior at key levels and manage risk accordingly.
💬 What’s your take? Are we heading to $120K or is this a bull trap? Drop your thoughts below 👇
🔁 Like & Share if you caught this move!
📺 Follow for more real-time setups @ TradeWithMky 🧠📉
—
“TradeWithMky – where altcoins speak louder than Bitcoin!”

#Buy BitCoin#Buy BTCUSD
this trading system based on Divergency ans fibo
EntryPrice =108500
T.P= 109500
S.l=108100