USUSAL/USDTLong
Trading Plan USUAL/USDT (4H):
1. Support & Entry:
Support: 0.139–0.14.
2. Target Profit:
TP1: 0.16–0.17.
TP2: 0.20–0.2053.
3. Stop Loss:
0.1289
USUALUSDT trade ideas

USUAL ANALYSIS (8H)After wave A was completed, from the point where we placed the red arrow on the chart, it seems the price has entered wave B.
Wave B is a bearish symmetrical wave, and it currently appears that we are in the early stages of wave I, which is a bearish wave.
From the supply zone, we expect a rejection towards the Fibonacci levels of wave a to i, which corresponds to the green zone.
A daily candle closing above the invalidation level will invalidate this analysis.
For risk management, please don't forget stop loss and capital management
Comment if you have any questions
Thank You

USUual short to new lows $0.1787Am anticipating that Usual usd might start to dump back down from here all the way back down to $0.1882 area where I'll be looking to exit. I have my target lower at $0.1787 area as its day time now in New york session time.
So could get more volume than usual to dump down faster...hopefully for the sake of my short.
Only thing that concerns me a bit is that recently looking at the price action i can see that it likes to wick aggressively at certain areas...maybe limit orders or just manipulation. Will be monitoring or what I might do is move stop to BE once it reaches those areas incase it gets another flash wick up, that I might not be able to react to

USUAL/USDT Rising Wedge – Bulls in Control, But Can It Hold?🚀 Rising Wedge – Bulls in Control, But Can It Hold?
I'm currently long on USUAL/USDT as price moves within this rising wedge on the 1H chart. While this pattern often signals a potential breakdown, momentum is still strong for now.
📊 Key Observations:
🔹 Rising wedge pattern forming – typically bearish, but breakouts can happen.
🔹 MACD is bullish, showing momentum still favors the upside.
🔹 RSI is climbing, approaching overbought territory – watching for signs of weakness.
🔹 Volume increasing, signaling strong participation from buyers.
🎯 Trade Plan:
✅ Current long position targeting $0.2497 (potential breakout zone).
✅ If price breaks above resistance, we could see further upside towards $0.27+.
⚠️ However, if the wedge breaks down, key support sits at $0.22, with the measured move potentially dropping to $0.20 or lower.
🔥 Watching closely – will bulls hold, or is a reversal coming? Stop-loss in place to manage risk. Let’s see how this plays out!
Drop your thoughts below! 👇 Are you long or short on this move?
#Crypto #USUAL #Trading #PriceAction #TechnicalAnalysis #CryptoTrading #LongPosition

USUAL is bullish (2H)Given the formed trigger line and the fact that the price is making higher Lows below this trigger line, we can look for buy/long positions on the order blocks formed below the price.
The targets are marked on the chart.
A 4-hour candle closing below the invalidation level will invalidate this analysis.
Do not enter the position without capital management and stop setting
Comment if you have any questions
thank you

USUAL analysis (4H)It seems that the correction for this asset has started from the point where we placed the red arrow on the chart.
This correction appears to be a diamond-shaped diametric.
Currently, we seem to be in wave F of this diametric. The price may reject downward from the red zone.
A daily candle closing above the invalidation level will invalidate this analysis
For risk management, please don't forget stop loss and capital management
Comment if you have any questions
Thank You


SUSUAL - Long Trade IdeaUSUAL price is currently holding its key support, a bounce is due at this level, and could potentially retest the supply above
Buying zone: 0.34 to 0.32
Local resistance is around 0.50 (bearish orderblock + hvn)
Stop below .295
Potential targets:
0.50
0.67
0.86

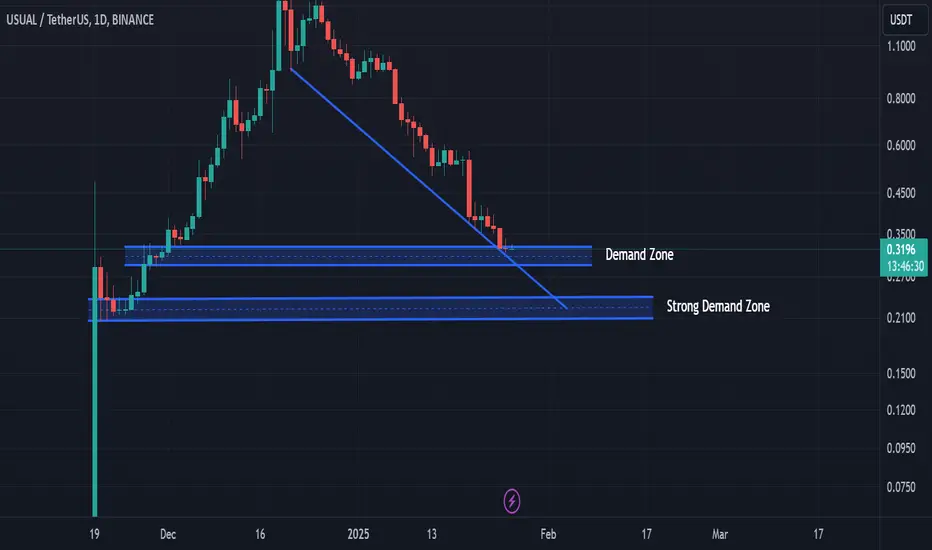
$USUALUSDT, USUAL, $USUAL(USD0++ coin)Possible two scenario
1- Demand Zone
demand zone depends upon the team of USUAL Lab. If usual lab redemption ratio continue with burning process then price is more down. otherwise buy order ($0.28 to 0$0.30)
2- Strong Demand Zone
Strong demand zone not follow the team announcement. its must be buy range (0.20 to 0.22).
otherwise project dead like VIE:LUNA
Usualusdt short to $0.3050Entered #usualusdt usdt here with wide stop at $0.35
Will scale in a bit later on with more confirmation.
Its been selling off quite a bit but based on my analysis it hasn't bottom out yet and this is just another bounce to continue down.

USUALUSDTFalling wedge, 2 hammer at the 0,786 Fibs, just a matter of hours, regarding the breakout.
SL close below the hammer wigs, target for me personally on the chart

USUAL/USDT technical analysis by using MedianMedian shows that the double bottoms at the level of 0.44$.
Double bottoms means strong bullish.
1-long position target is 0.85$ to 0.89$.
2-0.89$ must be retrace then touch 2.2$.
Note: DYOR

USUALUSDT: What Price Action Is Telling Us Today - Usual◳◱ With Super Trend in play and the price at 0.5389, the market whispers opportunity. Breaking past 0.8931 | 1.196 | 1.6671 could spark a rally, while 0.422 | 0.2538 anchors bullish sentiment.
◰◲ General Information :
▣ Name: Usual
▣ Rank: 288
▣ Exchanges: Binance, Kucoin, Gateio, Mexc
▣ Category / Sector: N/A
▣ Overview: Usual project overview is currently unavailable. I'll try to update this in the upcoming analysis.
◰◲ Technical Metrics :
▣ Current Price: 0.5389 ₮
▣ 24H Volume: 92,622,307.521 ₮
▣ 24H Change: -3.145%
▣ Weekly Change: -13.97%%
▣ Monthly Change: -41.17%%
▣ Quarterly Change: N/A%
◲◰ Pivot Points :
▣ Resistance Level: 0.8931 | 1.196 | 1.6671
▣ Support Level: 0.422 | 0.2538
◱◳ Indicator Recommendations :
▣ Oscillators: BUY
▣ Moving Averages: STRONG_SELL
◰◲ Summary of Technical Indicators : SELL
◲◰ Sharpe Ratios :
▣ Last 30 Days: 1.10
▣ Last 90 Days: 3.20
▣ Last Year: 3.20
▣ Last 3 Years: 3.20
◲◰ Volatility Analysis :
▣ Last 30 Days: 3.18
▣ Last 90 Days: 2.94
▣ Last Year: 2.94
▣ Last 3 Years: 2.94
◳◰ Market Sentiment :
▣ News Sentiment: N/A
▣ Twitter Sentiment: N/A
▣ Reddit Sentiment: N/A
▣ In-depth BINANCE:USUALUSDT analysis available at TradingView TA Page
▣ Your thoughts matter! What do you think of this analysis? Share your insights in the comments below. Your like, follow, and support are greatly valued and help sustain high-quality content.
◲ Disclaimer : Disclaimer
The content provided is for informational purposes only and does not constitute financial, investment, or trading advice. Always conduct your own research and consult a qualified professional before making any financial decisions. Use of the information is solely at your own risk.
▣ Explore the Power of Charting with TradingView
Unlock a wide range of financial analysis tools, data, and features to elevate your trading experience. Take a tour and see the possibilities. If you decide to upgrade your plan, you can receive up to $30 back. Discover more here - affiliate link -

USUAL as i see usual has 2 options, the first one this weekend to break the downtrend from the big rejection, the second option is by Monday to start the accumulation and break the downtrend, so in the first 2-3 days of the next week technically should be 20-35% +
hope to work as i see it
nfa
dyor

USUAL Update 0.48$ is The key , "Be sure to evaluate for a potential buy if the price reaches this zone."
good luck guys 🤍🫡

USUAL has pulled back to my buy zone$USUAL has pulled back to my buy zone on the weekly chart. I will be accumulating and opening up leveraged trades at 0.59 and below.
I'm showing here near term targets on the 4 hourly chart for scalp trades but I will be monitoring this for holding this as a position trade for the long term.
My near term target is at 0.98 level if we break above 0.68 with volume support. My longer term targets are at 1.90 and above level.
On the macro level #UsualProtocol $USUAL has introduced a revenue-sharing model to stabilize its ecosystem after its staked #stablecoin , USD0++, depegged from its $1 value.
The protocol announced the activation of a "revenue switch" starting January 13, which will distribute earnings from real-world assets and protocol operations to users. The protocol estimates $5 million in monthly revenues, yielding an annual return of over 50%. I think in the near term they have some kinks to work out but longer term this is a very bullish news and we will benefit from this as the users start seeing the actual revenue start coming in.
This is not a financial advise. Please DYOR.


get ready to jump inbuy after the red line 28%
in the daily its going up
T1 1.4095
T2 1.6250
T3 i don't think it well be reach because the BT

USUALwaiting for market to get more quite and also i will wait to ape in usual, i think this project has good potential for this bull market that it is coming.
lest see
USUALUSDT breakouts the parallel channel USUAL breakouts the parallel channel and my target is 20% in upside.
DYOR before you take trade!

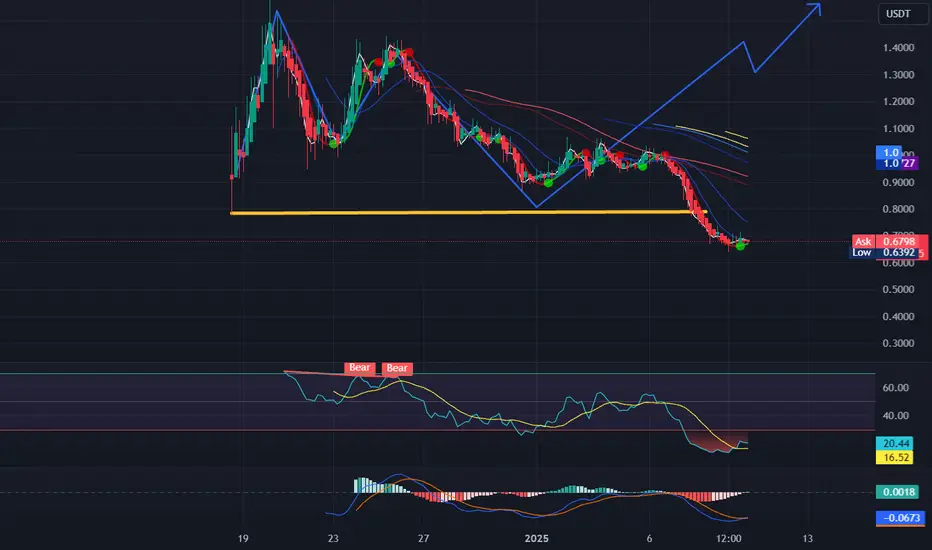
Usualusdt Trade opportunityUSUAL/USDT has broken down from a rising wedge, signaling the completion of wave 3 at $1.6468.
This breakdown has set the stage for wave 4, with a retracement targeting the $0.60–$0.75 buy-back zone. These levels align with a strong demand area, offering a favorable opportunity for re-accumulation. Should the price dip further, we aim to expand accumulation within the broader demand zone.
The ultimate goal is to ride wave 5 towards $3.7228, capturing the final leg of this bullish structure. Given that USUAL is a newly introduced asset, disciplined risk management is essential.
Share your insights on this setup, do you agree with the wave projection?

Usual/UsdtBINANCE:USUALUSDT
Right now, the price of the asset is at **0.9789** 📊. This is a crucial level because if the price starts to fall and can’t maintain its position above **0.900** 🚨, this would signal a potential downturn. **0.900** is considered the "last hope" support level for this price action—if the price drops below that, things could get tricky.
If the price falls below **0.900**, the next level of support to watch for is **0.8308** 📉. Support is where the price tends to find buying interest, so if it reaches this point, there might be a chance for it to bounce back up. However, if it breaks through this, further downward movement could be expected.
On the flip side, if the price holds and continues to rise, it will face resistance levels that could prevent it from moving higher. These resistance levels are key price points where sellers might step in to take profits, or where the price could struggle to break through. In this case, the resistance levels are:
- **1.00** 🔴: This is a round number, which tends to be a psychological resistance point.
- **1.1544** 🔴: A higher level, possibly linked to previous market highs.
- **1.253** 🔴: Another key resistance, which could be a tough barrier for the price to pass.
- **1.432** 🔴: The highest resistance level to watch; if it breaks through here, it could signal a strong bullish movement.
To recap, **0.900** is your “last hope” support, and **0.8308** is your next major support level if the price falls. On the upside, watch the resistance levels at **1.00**, **1.1544**, **1.253**, and **1.432**.
And remember, all of this is purely based on technical analysis, and **this is not financial advice** ⚠️💸. Always make sure to do your own research before making any financial decisions! 🧠💡

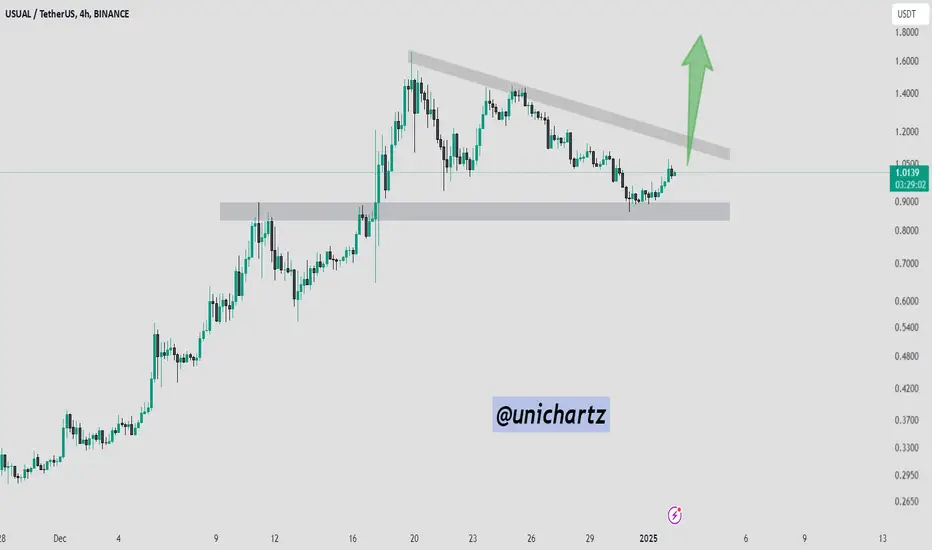
Key Support Holds: USUAL/USDT Eyes a Bullish Breakout USUAL/USDT pair is showing a strong rebound from the key support zone, suggesting a successful retest of the breakout levels. However, the price is currently facing rejection from the descending, narrow resistance zone.
Based on the current setup, we predict a breakout from this zone, potentially leading to further bullish momentum in the coming sessions.