$UNLINK SPOT It's actually quite risky to take $UNLIK at this point, but the structure has confirmed a Change of Character, indicating a potential trend reversal.
For those considering a spot entry, you can watch the 0.3278 zone.
It presents a good opportunity for those looking to take a position in that area.
UXLINKUSDT trade ideas

UXLINK price powerfully pumping😱 Totally manipulative asset - $UXlink
When all the altos are growing, OKX:UXLINKUSDT price is in a falling consolidation, when most altos start to “feel bad”, then #UXLINK is pummped.
Now, the MM's goal is obvious - to break the feet of shorts and organize a “short squeeze” and sell a large portion of the asset at high volumes.
Therefore:
1️⃣ Don't shorts - it's too early.
2️⃣ Move your stops at a long position or use a trigger stop.
3️⃣ Short squeeze - are close, above $1.20, it will be sharp... to $1.30 or even to $1.50, or even to $2.15... it is unknown, time will tell)
The only thing that is known is that those who like to trade such manipulative assets will get an unforgettable adrenaline rush, but afterwards the taste will be twofold...
Better watch without participating!)
P.S:
we would buy, not earlier than at $0.26-0.32
_____________________
Did you like our analysis? Leave a comment, like, and follow to get more

UXLINK ANALYSIS (8H)From the point where we placed the green arrow on the chart, an expanding triangle began, and the pattern completed at the point where we placed the red arrow.
Now, the price seems to be in a correction, which appears to be either a Diametric or Symmetric pattern. Currently, it looks like we are in wave D of this structure.
We expect a drop from the red box. Demand 1 is a temporary rebuy zone, while Demand 2 is a suitable area for a set-and-forget approach with good gains.
Let's see what happens!
For risk management, please don't forget stop loss and capital management
When we reach the first target, save some profit and then change the stop to entry
Comment if you have any questions
Thank You

UXLINK/USDT- The Cup That's About to Runneth Over! 🔄🚀 for more details FOLLOW ME AND READ BELOW 🚀
📈 The Perfect Storm Brewing for UXLINK
Looking at this 4-hour chart of UXLINK/Tether, we're witnessing poetry in price action! That gorgeous cup and handle pattern isn't just technical analysis—it's telling us a story of accumulation, patience, and imminent reward.
🎯 What The Chart Is Screaming:
👑 Royal Cup Formation
* A majestic cup from March 19-April 3 with perfect rounded bottom at 0.3976
* Cup depth of nearly 33% shows healthy correction before continuation
* Volume profile confirms smart money accumulating at bottom
🔄 Handle Consolidation Phase
* We're currently in the crucial handle formation (Apr 3-5)
* Price coiling tightly between 0.44-0.50
* Lower volatility = spring getting compressed
💥 Breakout Signals Flashing
* Blue descending trendline BROKEN
* Price holding comfortably above the 0.44 support zone
* Double bottom at 0.42 created solid foundation
💎 The UXLINK Game Plan
Target Zones:
- First Target : 0.48 (yellow resistance line) - Immediate breakout goal
- Conservative Target : 0.50 - 0.52 range - Measured move projection
- Moon Shot : 0.60+ revisiting previous highs with momentum
⚡Potential Timeline
The pattern suggests completion within the next 5-7 days based on current consolidation rhythm
Warning Signs :
* If price closes daily below 0.44 pink support, pattern invalidated
* Volume must increase on breakout or suspect false move
🧠 Why This Matters Now
With the current market volatility, UXLINK is showing remarkable structural integrity. The purple forecast line suggests a classic "shake out before breakout" scenario—exactly what smart money wants before moving prices higher.
🔥 Position sizing is key here! This setup offers exceptional risk/reward with clear invalidation points.

$UXLINK | scalp long$UXLINK | scalp long
entry: cmp to .45
stoploss : just below .418
TPs:
.508
.542
.603

UXLINKrn as we can see it is on the bottom position and it is trying to do a breakout.
lets see if could achieve to step up.
nfa dyor

UXLINKUSDTBy returning to the specified area and checking yourself, you can enter and buy in spot mode

UXLINKduring my observation of UXLINK i could say that during the period of 4 days there is a price stability as it shown marked on the chart.
this means that probably the downtrend is ended and this is accumulation for the next rally up.
i am thinking that personally i would open a long position maybe lev x5 on cross with a small bag
please when trade on futures never use high leverages and use only small bags of your budget on cross....
nfa
dyor
as i always repeat, i am not a pro trader, i am a patinated trader and during my 2 weeks i have zero loss only thanks to my strategy.

UXLINKhello friends
very very interesting chart on UXLINK, what a correction, huge and scary one for those who maybe forgot to set SL.
what will no happen with this kind of chart, i am thinking to wait few more hours, maybe i can open a long position during this night, or maybe tomorrow morning..
whatever you decide to do, never use more than 1/4 of your budget, low lev max x10 and always cross.
dyor
nfa

UXLINKafter this huge correction uxlink on 1D tf it is showing good sign of consolidation and also all the indicators are positive and preparing for long position, macd, stochastic rsi and also volume.
depending on the market conditions, i could day that uxlink will start the price increase by late tonight, lets see if it will
good luck
nfa + dyor


UXLINKUSDT: High Timeframe Entry—Stay Focused UXLINKUSDT: High Timeframe Entry—Stay Focused 💡
Ladies and gentlemen, UXLINKUSDT is at a key high timeframe entry zone . Don’t get lost chasing noise in the lower timeframes—this is where the real action is for those with patience and a plan.
Why This Zone Is Important:
High Timeframe Strength: These levels matter, and they hold the power to deliver big reactions.
Strategic Precision: Blue box carefully selected using advanced tools like CDV, liquidity heatmaps, volume profiles, and volume footprints.
Risk vs Reward: A well-timed entry here could lead to significant upside.
Remember: When trading the blue box, look for upward market structure breaks in low timeframes as confirmation before taking action.
Want to know how to find these critical zones yourself? DM me, and I’ll teach you my methods using CDV, heatmaps, and more.
If this helps, boost, comment, and follow . Together, we can make trading a winning game. Stay disciplined, stay sharp!
Let me tell you, folks, this is amazing. Nobody does analysis like I do. Believe me. If this helps you, don't forget to boost and comment! It’s a big deal, motivates me to share even more winning insights with you. Tremendous insights.
I keep my charts the best, clean, simple, and clear. You know it, I know it, clarity leads to better decisions. No question about it. My approach? Built on years of tremendous experience. Incredible track record. I don’t claim to know it all, but I spot high-probability setups like nobody else. Trust me.
Want to learn how to use the heatmap, cumulative volume delta, and volume footprint techniques I use to determine demand regions with stunning accuracy? Send me a private message—totally free, folks. That’s right. I help anyone who wants it, absolutely no charge. Unbelievable value.
Here’s the list, long list, great list, of some of my previous incredible analyses. Each one, a winner:
🎯 ZENUSDT.P: Patience & Profitability | %230 Reaction from the Sniper Entry
🐶 DOGEUSDT.P: Next Move
🎨 RENDERUSDT.P: Opportunity of the Month
💎 ETHUSDT.P: Where to Retrace
🟢 BNBUSDT.P: Potential Surge
📊 BTC Dominance: Reaction Zone
🌊 WAVESUSDT.P: Demand Zone Potential
🟣 UNIUSDT.P: Long-Term Trade
🔵 XRPUSDT.P: Entry Zones
🔗 LINKUSDT.P: Follow The River
📈 BTCUSDT.P: Two Key Demand Zones
🟩 POLUSDT: Bullish Momentum
🌟 PENDLEUSDT.P: Where Opportunity Meets Precision
🔥 BTCUSDT.P: Liquidation of Highly Leveraged Longs
🌊 SOLUSDT.P: SOL's Dip - Your Opportunity
🐸 1000PEPEUSDT.P: Prime Bounce Zone Unlocked
🚀 ETHUSDT.P: Set to Explode - Don't Miss This Game Changer
🤖 IQUSDT: Smart Plan
⚡️ PONDUSDT: A Trade Not Taken Is Better Than a Losing One
💼 STMXUSDT: 2 Buying Areas
🐢 TURBOUSDT: Buy Zones and Buyer Presence
🌍 ICPUSDT.P: Massive Upside Potential | Check the Trade Update For Seeing Results
🟠 IDEXUSDT: Spot Buy Area | %26 Profit if You Trade with MSB
📌 USUALUSDT: Buyers Are Active + %70 Profit in Total
🌟 FORTHUSDT: Sniper Entry +%26 Reaction
🐳 QKCUSDT: Sniper Entry +%57 Reaction
📊 BTC.D: Retest of Key Area Highly Likely
And that’s just the start. The list goes on and on, folks. It’s a tremendous list, the best. I stopped adding because, frankly, it’s tiring. So many wins. People are amazed. You can check my profile and see for yourself, winning moves, all the time. Believe me, nobody does it better.

UXLINKbased on the chart, on the collabs they are having with other projects, the volume that it has all the time, i think it will follow the chart.
NFA-DYOR

UXLINKsince day 3 i am following this project and watching how it works, i think that regarding the oversold conditions in 4h tf, i am waiting to see correction in the next 2-3 days and head toward 1.7-2.2-2.7$ during one week.
Please, this is not financial advice, i just post what i think... DYOR

$UXLINK - Classic Pump and DumpUXLINK is a leading user-driven web3 social platform aimed at mass adoption, functioning as both a social DEX (Decentralized Exchange) and social infrastructure. It focuses on creating two-way, friend-type social relationships and enabling real-time interactions through various features and applications.
The UXLINK token serves multiple purposes within the UXLINK ecosystem, including paying for on-chain gas fees, staking for rewards, and governance. The platform implements a token burn mechanism, where a percentage of fees will be burned, potentially increasing the token's value over time due to reduced supply.
UXLINK has reached its all-time high of $3.78 on December 25, 2024, showing strong market interest and sentiment. With a current price around $1.835 and a 24-hour trading volume of $4.14 billion.
TECHNICAL OUTLOOK:
A significant volatility on December 25, 2024, with a notable decrease in price, dropping by 60%
$2 to $2.20 is now acting as the local resistance. If it doesn't break through, we might see it drop back to $1 or even down to .80 (breakout area)

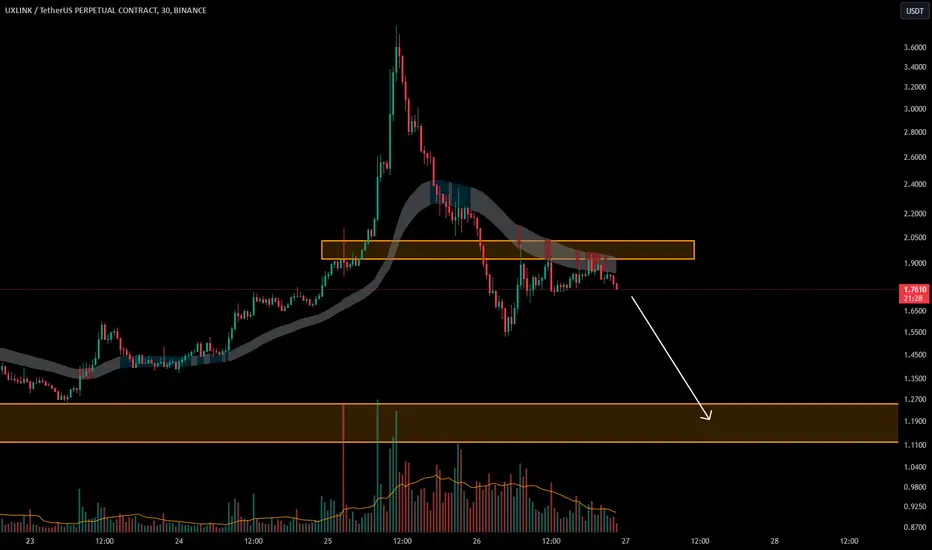
UXLINK/USDTKey Level Zone : 1.930-2.020
HMT v3.0 detected. The setup looks promising, supported by a previous upward/downward trend with increasing volume and momentum, presenting an excellent reward-to-risk opportunity.
HMT (High Momentum Trending):
HMT is based on trend, momentum, volume, and market structure across multiple timeframes. It highlights setups with strong potential for upward movement and higher rewards.
Whenever I spot a signal for my own trading, I’ll share it. Please note that conducting a comprehensive analysis on a single timeframe chart can be quite challenging and sometimes confusing. I appreciate your understanding of the effort involved.
If you find this signal/analysis meaningful, kindly like and share it.
Thank you for your support~
Sharing this with love!
HMT v2.0:
- Major update to the Momentum indicator
- Reduced false signals from inaccurate momentum detection
- New screener with improved accuracy and fewer signals
HMT v3.0:
- Added liquidity factor to enhance trend continuation
- Improved potential for momentum-based plays
- Increased winning probability by reducing entries during peaks

UXLINK still have JUICE! Aiming for $4As mentioned on the lines drawn. 2.64 is initial buys. If it gives a small pullback till the purple line, Put cost to SL. Yelllow box is a median box as well. Stops wil be 2.40 from the green box.
Probable scneario - Three White Soldiers to cover as a inside candles!

UXLINK/USDTKey Level Zone : 1.321-1.3743
HMT v3.0 detected. The setup looks promising, supported by a previous upward/downward trend with increasing volume and momentum, presenting an excellent reward-to-risk opportunity.
HMT (High Momentum Trending):
HMT is based on trend, momentum, volume, and market structure across multiple timeframes. It highlights setups with strong potential for upward movement and higher rewards.
Whenever I spot a signal for my own trading, I’ll share it. Please note that conducting a comprehensive analysis on a single timeframe chart can be quite challenging and sometimes confusing. I appreciate your understanding of the effort involved.
If you find this signal/analysis meaningful, kindly like and share it.
Thank you for your support~
Sharing this with love!
HMT v2.0:
- Major update to the Momentum indicator
- Reduced false signals from inaccurate momentum detection
- New screener with improved accuracy and fewer signals
HMT v3.0:
- Added liquidity factor to enhance trend continuation
- Improved potential for momentum-based plays
- Increased winning probability by reducing entries during peaks

These are my Support and Resistance drawings for UXLINKUSDTThese are my Support and Resistance drawings for UXLINKUSDT

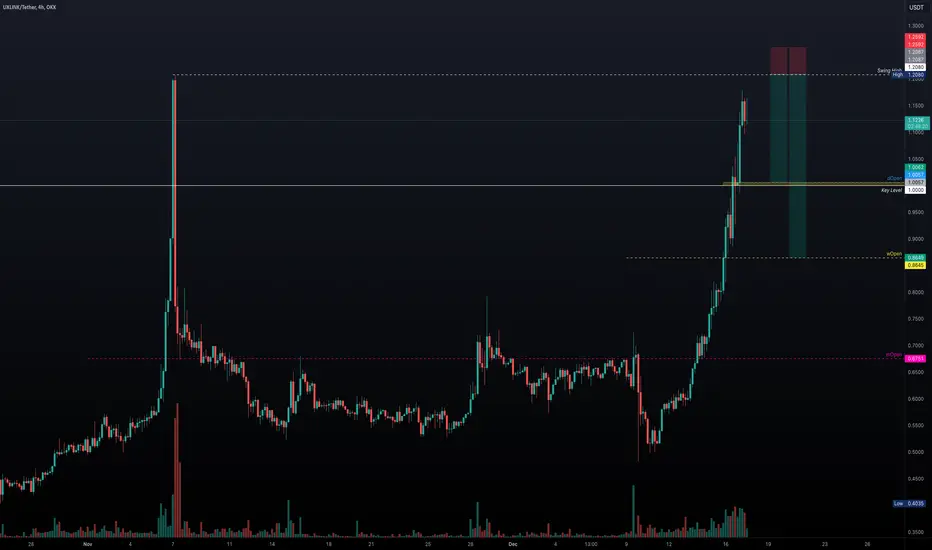
UXLINK - Is a Reversal Imminent? SHORT SETUPUXLINK has seen impressive gains over the past 7 days, rising +140% and approaching the swing high at $1.208. This price action suggests the possibility of a correction, providing an attractive short opportunity if it faces rejection at these levels.
Key Observations:
Recent Bullish Momentum: UXLINK has been on a 7-day bullish run, rising significantly, which increases the likelihood of a short-term pullback or correction.
Swing High at $1.208: As UXLINK nears the swing high at $1.208, this could act as a potential rejection point. A rejection here could provide an excellent shorting opportunity.
Riskier Trade: If you prefer a more aggressive position, a short could be taken now, targeting the swing high with a laddered approach towards that level.
Possible Correction Ahead: With 7 consecutive bullish days, a correction is likely in the near future. The dOpen at $1 serves as a strong support level to target for a short.
Break Below $1: If UXLINK breaks below the $1 level, the next target becomes the wOpen at $0.8645.
Reward-to-Risk Potential:
Target 1: $1 (dOpen) offers a 4:1 risk-to-reward, with a potential 16.45% gain.
Target 2: $0.8645 (wOpen) offers a 7:1 risk-to-reward, with a possible +28.5% gain.
Elliot Wave Count: According to Elliot wave theory, UXLINK is approaching the completion of its 5-wave structure, which may further indicate that the upward trend is nearing exhaustion.
Summary:
Bullish run over the past 7 days makes UXLINK susceptible to a correction.
Swing high at $1.208 could provide an ideal short opportunity, with strong targets at $1 and $0.8645.
Reward-to-risk ratios are favorable, offering 4:1 or even 7:1 if the trade is executed properly.
Elliot Wave suggests the end of the current upward movement, further supporting the case for a potential short.
UXLINK - ITS NOT OVER!WHO SAID Its over? But it needs rest so red line is to be seen, CMP buys initiated till yellow box initated!

uxlink - boxLocated at the lower edge of the ascending channel, having formed a box, there is potential for growth to $1.5-2
