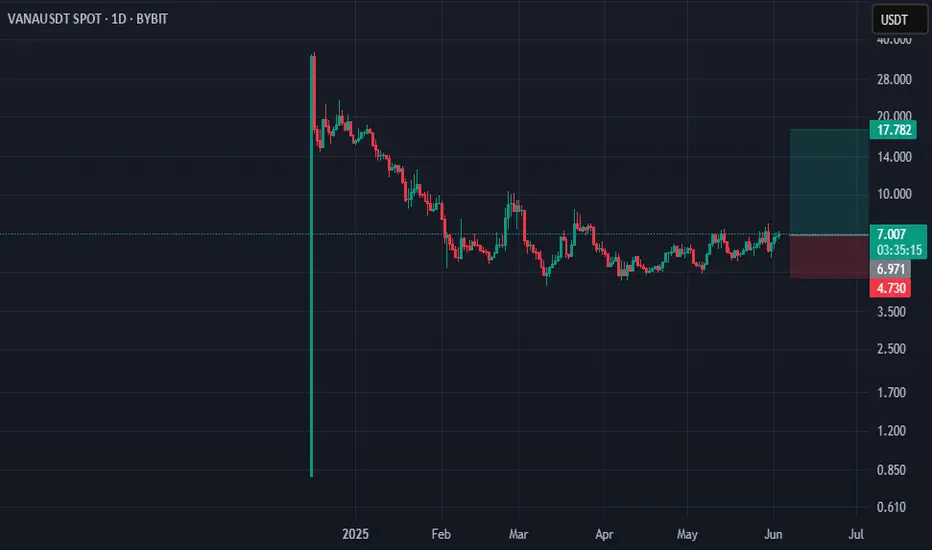
VANAUSDT Forming Falling WedgeVANAUSDT is currently trading within a classic falling wedge pattern, a bullish structure known for its potential to produce explosive upside breakouts. This pattern indicates that bearish momentum is losing steam while buyers are gradually stepping in. The narrowing of the price range combined with good volume suggests a breakout could be on the horizon. The falling wedge has historically marked the bottoming phases of many altcoins before massive surges, and VANAUSDT appears poised for a similar scenario.
With an expected gain of 140% to 150%+, VANAUSDT presents an attractive setup for swing traders and mid-term investors. The chart structure implies that once the resistance of the wedge is broken, the move could be rapid and substantial. Many traders are watching this zone closely, waiting for confirmation of breakout volume and bullish candle formations to signal entry. As momentum builds across the altcoin space, lower-cap tokens like VANA can experience sharp rallies once technical barriers are cleared.
There is growing interest from investors in this project due to its unique fundamentals and technical outlook. With broader market sentiment shifting back to bullish and many tokens breaking out from similar setups, VANA could ride this wave to significant new highs. Furthermore, social media buzz and community engagement around this token are steadily increasing, which could further fuel the upside.
✅ Show your support by hitting the like button and
✅ Leaving a comment below! (What is You opinion about this Coin)
Your feedback and engagement keep me inspired to share more insightful market analysis with you!
VANAUSDT trade ideas

VANAUSDT 1D#VANA is moving inside a falling wedge pattern on the daily timeframe. It was recently rejected from the wedge resistance, partly due to BTC’s drop and the fact that VANA was in the overbought RSI zone. Consider buying VANA within the support zone ($5.327–$5.172) and near the $4.818 support level in case of a deeper dip. In case of a breakout above the wedge resistance, the targets are:
🎯 $6.287
🎯 $6.774
🎯 $7.803
🎯 $9.028
🎯 $10.253
🎯 $11.998
⚠️ Use a tight stop-loss and manage your risk wisely — the breakout could be explosive.

vanausdtthis altcoin is very strong in fall down btc
its in accumulation phase
buy and hold
when it want go to the moon?! when you sell it :D
#VANA/USDT#VANA
The price is moving within a descending channel on the 1-hour frame, adhering well to it, and is heading for a strong breakout and retest.
We are seeing a bounce from the lower boundary of the descending channel, which is support at 6.52.
We are seeing a downtrend on the RSI indicator that is about to break and retest, supporting the upward trend.
We are looking for stability above the 100 Moving Average.
Entry price: 6.75
First target: 6.98
Second target: 7.24
Third target: 7.52

VANAUSDT 1D AnalysisVANA ~ 1D Analysis
#VANA Looks familiar, like an accumulation area where whales are doing it. Buy gradually with a short term target of at least 15%+ from here.

Vana, Easy Short-Term 180% Target—Profits vs Greed—350% NextI am giving you this one as a short-term chart setup. Vana has been rising since mid-March and I sense this chart becoming stronger by the day. The fact that the action is still happening at bottom prices after months of sideways is also good. This means that the breakout will be a surprise and super strong. Our target can hit within days once resistance break.
Something like more slowly rising challenging upper resistance. Once this break, a huge big candle with 50-60% green. Then another one and another one until the market settles within the bullish zone. After the initial burst, a small retrace followed by long-term growth.
This trading is so easy it should be illegal. All that is needed is to buy and hold. The market takes care of the rest.
Profits can come in a week's time, just as it can come within several months; it doesn't matter, we wait. Better to have sure certain profits playing wisely the market, than losing everything out of greed and with high lev.
A win is always more profitable than a loss, no matter what our ego says. Our ego will say, "If it is going up anyways, why not go all-in with 10X?" When this reasoning takes over, the market is about to turn.
The truth is that nothing is certain and since the bots can adapt live, when too many people go into the same reasoning, then no more growth, the market needs to remove all this greed before moving ahead.
For us, the thinking goes something like this, "If I can make money easy with 100% certainty, why take such a huge risk?" "I can simply hold and wait. I rather make $10,000 safe and secure, than lose $2,000 thinking of earning the same day."
The thinking goes like this, "The truth is that I've been tempted before, my ego tends to lie and instead of a win, I end up with a major loss. I will be patient, I trust Master Ananda and his winning strategy through buy and hold."
The market can end up moving faster than before.
We are in June 2025. There isn't much time left. We are going to be bullish for months and months and months. The retraces, the corrections, the consolidation... It is all over, we are going up.
Namaste.

Vana 1111% Potential? Consolidation Continues (Trading Strategy)Consolidation as in bullish consolidation because prices have been moving up for months, the bottom was hit mid-March.
Good evening my fellow Cryptocurrency trader, I hope you are having everything that you wish to have in this moment in this time in this life.
I hope you are having a beautiful week and a wonderful day.
How are you feeling?
Good, let's just focus on the chart, ok?
The best time is now to trade.
To trade or not to trade. What does it mean to trade?
What is trading all about?
Trading is a money making job but not everybody who is trading is working. Sometimes we are drawn to the market as if by a magnet and we end up playing, or should I say "trading" but there is actual no trading involved.
Trading is an exchange, we are not exchanging anything other than clicks and numbers on a screen. Does it count as trading? Well, clicks and numbers, if these are being exchanged then it is still trading.
We are exchanging virtual currencies so yes, we are trading and we can win.
VANAUSDT. We've been on a mix between investing and trading; get your mind right!
Are you in it long-term or short-term?
It can make all the difference knowing where you stand.
If you say you will decide on the go, here is what always happens: When the time to tell is right, you say "I am holding/trading long-term." If the time to sell is wrong, prices will continue going up you say, "I am securing profits, this is a short-term trade."
For this reason, it is better to plan ahead.
Just plan ahead and, when you secure profits and prices keep on growing, it doesn't matter, you secured a winning trade.
When you secure profits and prices drop, it doesn't matter either, you just did what you said you were going to do before you bought.
Plan before buying.
Thanks a lot for your continued support.
Namaste.

VANA superbThe news of tokenisation has hit the Fbuy print on vana and from there you can see how the price spiked. The next uptrend levels are in the range of 9, 11 and so on
for indicator access, you can contact me
DYOr
goodluck

$VANA/USDT BREAKOUT ALERT🚨 BREAKOUT ALERT $VANA/USDT 🚨
After months of grinding in a sideways market, BME:VANA has finally broken out with strong momentum! 270% upside potential from the breakout zone is now on the table!
📈 Accumulation done. Expansion phase activated.
Are you riding this wave?
DYRO, NFA

Vana long to $7.23Just now opened a long position on #vana
Target: $7.23
Stop: $6.5 or lower
Roughly 2.8RR
Betting on trend momentum with this one as i didn't wait for confirmation just because I think perhaps by the time I do the RR would be less than I would like and market might push strongly so made an exception for this trade.

Vana scalp long to $5.740Just now opened a long position on vana. Expecting a continuation breakout to the upside towards $5.740
Stop: $5.5 Stop or lower
Roughly 2RR
Market already pumped quite a bit so ideally don't want to be holding this for long

Vanausdt long to $5.563Just now opened a long position on vana. targetting $5.563 area
Got in a bit late. Roughly 2 RR.
Stop: $5.295 area


Vana Will Grow Because I Say So... (Vana Or Banana?)It is a young chart, but the chart is so simple and easy that it cannot be ignored.
When we a look at a chart what are we looking for? Mainly bullish potential. A chart that looks ready to grow. A chart that says the bearish wave is over and a new bullish wave will start.
For this reason, VANAUSDT is easy.
There are no strong bullish signals. Basically there are no signals at all, but, we have price action.
VANAUSDT was in a descending trend and then goes sideways. So now we have information. We know the bearish action is over because we no longer have lower lows and lower highs. We know consolidation is happening because prices are sideways. We know soon there will be change because volume continues to drop. So, if the downtrend is over and the market enters a sideways range, we can assume that a bullish trend/wave/phase will develop next.
We can only make this assumption because we have an understanding of market cycles and keep an eye on the rest of the market. If we were unfamiliar with Cryptocurrencies are were looking at this chart in isolation we would not be able to make this assumption in a valid way. We would be able to make it but it would be a wild guess rather than an educated guess.
We know the market will grow.
We know Bitcoin is growing and we know some Altcoins are growing even three digits green in a single day. This never happens in a bear market and this happens only at the start of a new bullish phase.
We also know that the Altcoins that are breaking bullish and moving up strongly went through exactly the same pattern as VANAUSDT. They were going down and stopped going down and went sideways, from sideways turned green.
That's how I know that VANA will grow.
Thanks a lot for your continued support.
Namaste.

VANAUSDT Prepares for Bullish MoveVANUSDT Technical analsysis update
VANA has been forming a symmetrical triangle pattern over the past 90 days on the daily chart. A bullish move is expected once a breakout occurs. Additionally, a bullish MACD crossover happened a few days ago. Let's wait for a breakout above the triangle resistance for bullish confirmation.

$VANA/USDT Ready for a reversal?BME:VANA / USDT – Adam & Eve Double Bottom Breakout
VANA has completed an Adam & Eve double bottom pattern on the 4H timeframe, which is a strong bullish pattern, now trying to break above the resistance zone.
A successful breakout suggests momentum shift in favor of bulls and potentially continue upward moment, following a successful retest may be an additional confirmation.
It is advised to wait for a retest (green arrow) for confirmation before entry.
Invalid setup if price breaks and 4H CC below $5.631.
TP: Blue Lines
SL: 4H CC $5.744 below (white line)
Patience is key — wait for clean price action before reacting. No FOMO.
Margin 1–2% of your portfolio.
#NFA, DYOR.

$VANA Breakout Loading — Bulls Warming Up?BME:VANA breakout loading?
VANA is showing strong signs of accumulation near its key support. Price is pushing toward the trendline resistance with rising momentum and a reclaim of the 50EMA.
If we see a clean breakout, bulls could drive this much higher.
Key upside target:
• $10.79 (+78.51%)
This might be the spark for VANA’s next bullish leg.
Are you watching this move closely?
#VANA #Altseason2025

VANAAfter a big price rejection Vana is accumulating more than one month, price it is turning bullish and chart is showing an uptrend, if market will be positive i think that VANA will hit 1st target of 7.5-8$
NFA
DYOR

VANAUSDT – Breakout Alert!Join our community and start your crypto journey today for:
In-depth market analysis
Accurate trade setups
Early access to trending altcoins
Life-changing profit potential
Let' analyse VANAUSDT:
VANA is breaking out of a multi-month falling wedge pattern on the 12H chart
Price has held the support trendline well and is now showing strength at the apex of the wedge.
Targets:
• TP1: $6.92
• TP2: $9.15
• TP3: $9.19+
Stop-loss: $4.75 (below structure)
If momentum picks up, this could run hard
If you find this analysis helpful, please hit the like button to support my content! Share your thoughts in the comments, and feel free to request any specific chart analysis you’d like to see.
Happy Trading!!

vana long to $5.715 area now !Just opened a long position on BME:VANA
Load up the pump 🚀
This quite an optimistic play but confident that we'll probably at least hit $5.207 area

vana long to $5.225 tonightJust opened a new long position on BME:VANA
$5.225 target 🎯
I anticipate pump will start soon- Maybe next 4 minutes leading into daily close
Entry is a bit aggressive. Not necessarily according to my DTT rules but I think price is low enough and stop provides good invalidation.
Only risking a small size on this. $0.25% on 100k funded.

VANA Breakout in Sight as Accumulation Nears CompletionVANA appears to be finalizing a descending wedge structure with a potential 5-wave completion into the immediate demand zone. A final dip toward the $4.20–$3.20 accumulation range could offer an ideal entry before a bullish reversal targets $7.26, $9.76, and potentially $17.71. Strong reaction expected once this accumulation phase concludes.

Vana short to $4.844Just now opened a short position on vana. I expect some more downside before continuation up.
Target $4.844 area
