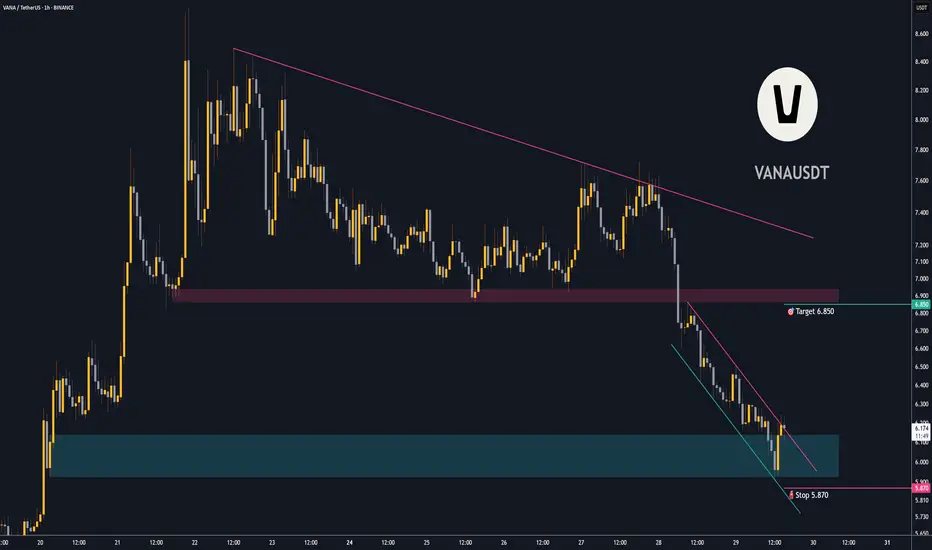
Trading opportunity for VANAUSDTBased on technical factors there is a Buy position in :
📊 VANAUSDT
🔵 Buy Now
🪫Stop loss 5.870
🔋Target 6.850
📏 R/R 2
💸RISK : 1%
We hope it is profitable for you ❤️
Please support our activity with your likes👍 and comments📝
VANAUSDT trade ideas
VANAUSDT – Smart Money Knows Where to BuyThe blue boxes are not just random levels; they are where the market has shown significant interest before. Smart traders don’t chase, they wait. If price holds and we see confirmation—CDV support, volume buildup, and a proper low-timeframe breakout—this could be a prime opportunity.
📌 What’s the Plan?
✅ Patience is key – No need to jump in blindly. We react, not predict.
✅ Confirmation is everything – If price respects the support and builds strength, that’s where we take action.
✅ If it breaks, we adjust – No emotional attachment, just clean execution.
This is where the difference between winning traders and the crowd is made. You either wait for the right conditions or you become exit liquidity. Choose wisely.
📌I keep my charts clean and simple because I believe clarity leads to better decisions.
📌My approach is built on years of experience and a solid track record. I don’t claim to know it all but I’m confident in my ability to spot high-probability setups.
📌If you would like to learn how to use the heatmap, cumulative volume delta and volume footprint techniques that I use below to determine very accurate demand regions, you can send me a private message. I help anyone who wants it completely free of charge.
🔑I have a long list of my proven technique below:
🎯 ZENUSDT.P: Patience & Profitability | %230 Reaction from the Sniper Entry
🐶 DOGEUSDT.P: Next Move
🎨 RENDERUSDT.P: Opportunity of the Month
💎 ETHUSDT.P: Where to Retrace
🟢 BNBUSDT.P: Potential Surge
📊 BTC Dominance: Reaction Zone
🌊 WAVESUSDT.P: Demand Zone Potential
🟣 UNIUSDT.P: Long-Term Trade
🔵 XRPUSDT.P: Entry Zones
🔗 LINKUSDT.P: Follow The River
📈 BTCUSDT.P: Two Key Demand Zones
🟩 POLUSDT: Bullish Momentum
🌟 PENDLEUSDT.P: Where Opportunity Meets Precision
🔥 BTCUSDT.P: Liquidation of Highly Leveraged Longs
🌊 SOLUSDT.P: SOL's Dip - Your Opportunity
🐸 1000PEPEUSDT.P: Prime Bounce Zone Unlocked
🚀 ETHUSDT.P: Set to Explode - Don't Miss This Game Changer
🤖 IQUSDT: Smart Plan
⚡️ PONDUSDT: A Trade Not Taken Is Better Than a Losing One
💼 STMXUSDT: 2 Buying Areas
🐢 TURBOUSDT: Buy Zones and Buyer Presence
🌍 ICPUSDT.P: Massive Upside Potential | Check the Trade Update For Seeing Results
🟠 IDEXUSDT: Spot Buy Area | %26 Profit if You Trade with MSB
📌 USUALUSDT: Buyers Are Active + %70 Profit in Total
🌟 FORTHUSDT: Sniper Entry +%26 Reaction
🐳 QKCUSDT: Sniper Entry +%57 Reaction
📊 BTC.D: Retest of Key Area Highly Likely
📊 XNOUSDT %80 Reaction with a Simple Blue Box!
📊 BELUSDT Amazing %120 Reaction!
I stopped adding to the list because it's kinda tiring to add 5-10 charts in every move but you can check my profile and see that it goes on..
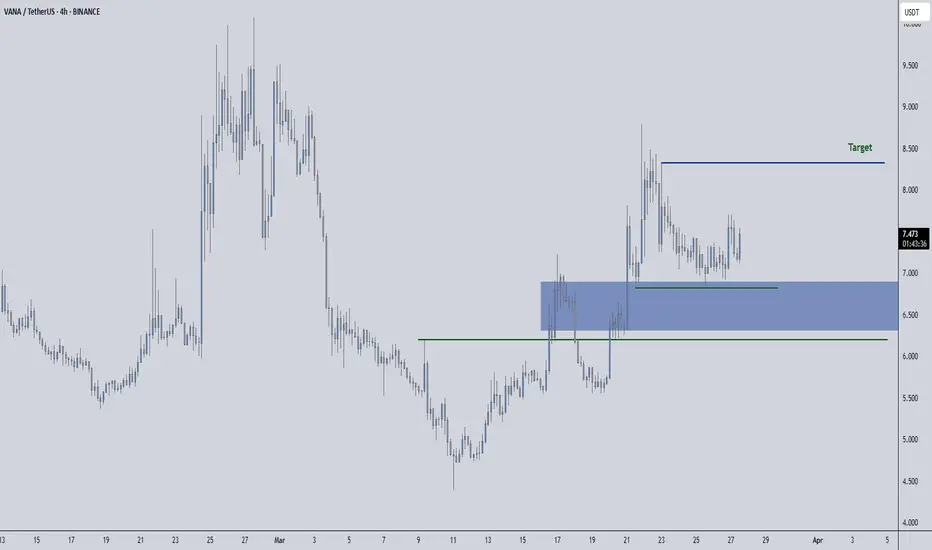
Vanausdt longWent long on Vana a while ago
Anticipating a continuation push back up to $8.64 area
Roughly 3RR setup.
If trade goes as anticipated it'll probably playout relatively quickly.
Market overall have slowed down a bit so going forward will be focusing on opportunities that are likely to playout same day, hopefully within a few hours. So instead of holding out on a big trade...just get a 2RR+ here and there.

#VANAUSDT is forming a confident bounce from key levels📉 LONG BYBIT:VANAUSDT.P from $8.180
🛡 Stop loss $8.000
1H timeframe
❗️Before entering the trade, closely monitor the levels. If the price consolidates above $8.180 with volume, this confirms the entry signal.
✅ Overview BYBIT:VANAUSDT.P :
➡️ On the chart, we can see that after a downward movement, the price formed a local bottom around $8.000, followed by an upward impulse.
➡️ A structure resembling a reversal pattern has appeared: the price broke through a slanted resistance (blue line) and consolidated above $8.180, indicating weakening sellers.
➡️ The price is now moving toward a resistance zone marked as POC (Point of Control) at $8.353, which could be the first target.
➡️ The entry is set at $8.180, aligning with the breakout level, supported by increasing volume and a short-term uptrend.
The volume profile on the left shows a low-liquidity zone above the current price (between $8.345 and $8.590), which may allow the price to quickly reach the TP levels.
🎯 TP Targets:
💎 TP 1: $8.345
💎 TP 2: $8.590
💎 TP 3: $8.775
⚡️ Plan:
➡️ Monitor the price reaction at TP1 ($8.345) — a pullback is possible. It’s recommended to close part of the position.
➡️ Wait for confirmation of the breakout above $8.180 (already happened, price is above).
➡️ Enter LONG after a retest (with volume) — in this case, the retest has already occurred, and the price is moving up.
➡️ Place the stop below the last low — at $8.000.
BYBIT:VANAUSDT.P is forming a confident bounce from key levels, and if it holds above the entry zone, we expect an upward movement!

VANA shortEarlier i opened a short position on this token called vanausdt
I did some research on it just now. It seems to be an AI token focus on decentralized data ownership.
Decent utility I guess...not sure if theres strong demand for it overall.
The current chart doesn't show that right now though hence why am shorting.
Its rejecting $5.6 4hr HL area but keeps pushing down back into it making lower highs and volume increasing on the sells which to me is a bearish indication that it will break down soon. Once I see a close below $5.6 area I'll be looking to scale in and tighten stop to improve RR a bit.
Currently is roughly 3RR from my entry to $5.17 target. I think I can get that up to 5RR

VANA VANABME:VANA surged by over 40% last week!
What's next?
Break above the $7 resistance level for an extended impulse towards the $10 round number.

VANAVANA broke the downtrend and it is gaining traction and volume, if market conditions will be good, by middle of the next week we could have the target market in long position.
this is spot trade.
nfa
dyor

$VANA ANALYSIS! VANA is testing the black resistance line ⚫.
✅ If breakout is successful, the first target is the green line level 🟩.

VANAUSDT(VANA) Updated till 24-02-25VANAUSDT(VANA) Daily timeframe range. PA found its local low at 5.377, below that is trouble zone. now its trying to break above 8.542 which is more optimal here. we can only see relief rally if it stays above 8.542. alltho it got long way to go.


VANA/USDTKey Level Zone : 14.250 - 14.350
HMT v4.1 detected. The setup looks promising, supported by a previous upward/downward trend with increasing volume and momentum, presenting an excellent reward-to-risk opportunity.
HMT (High Momentum Trending):
HMT is based on trend, momentum, volume, and market structure across multiple timeframes. It highlights setups with strong potential for upward movement and higher rewards.
Whenever I spot a signal for my own trading, I’ll share it. Please note that conducting a comprehensive analysis on a single timeframe chart can be quite challenging and sometimes confusing. I appreciate your understanding of the effort involved.
Important Note :
Role of Key Levels:
- These zones are critical for analyzing price trends. If the key level zone holds, the price may continue trending in the expected direction. However, momentum may increase or decrease based on subsequent patterns.
- Breakouts: If the key level zone breaks, it signals a stop-out. For reversal traders, this presents an opportunity to consider switching direction, as the price often retests these zones, which may act as strong support-turned-resistance (or vice versa).
My Trading Rules
Risk Management
- Maximum risk per trade: 2.5%.
- Leverage: 5x.
Exit Strategy
Profit-Taking:
- Sell at least 70% on the 3rd wave up (LTF Wave 5).
- Typically, sell 50% during a high-volume spike.
- Adjust stop-loss to breakeven once the trade achieves a 1.5:1 reward-to-risk ratio.
- If the market shows signs of losing momentum or divergence, ill will exit at breakeven.
The market is highly dynamic and constantly changing. HMT signals and target profit (TP) levels are based on the current price and movement, but market conditions can shift instantly, so it is crucial to remain adaptable and follow the market's movement.
If you find this signal/analysis meaningful, kindly like and share it.
Thank you for your support~
Sharing this with love!
HMT v2.0:
- Major update to the Momentum indicator
- Reduced false signals from inaccurate momentum detection
- New screener with improved accuracy and fewer signals
HMT v3.0:
- Added liquidity factor to enhance trend continuation
- Improved potential for momentum-based plays
- Increased winning probability by reducing entries during peaks
HMT v3.1:
- Enhanced entry confirmation for improved reward-to-risk ratios
HMT v4.0:
- Incorporated buying and selling pressure in lower timeframes to enhance the probability of trending moves while optimizing entry timing and scaling
HMT v4.1:
- Enhanced take-profit (TP) target by incorporating market structure analysis

VANAUSDT.P LONG POSITION The reason for taking the trade is that; i look at the following confluences 1) Its well priced 2) The demand zone leads to a break of structure 3) the liquidity has been taken for both retail traders and Smc that long the market from the Decisional Demand that end up failing 4) The price has now mitigated the last m15 Demand zone and have a Choch in 1m time frame. Nevertheless this is just my idea, not a Financial advice.

VANAUSDT 4HVANA ~ 4H
#VANA If you have Conviction on the coin,. Buy at this support block, or buy after breaking this resistance line,. Minimum target 15%++

VANA/USDTKey Level Zone : 17.50 - 17.70
HMT v4.1 detected. The setup looks promising, supported by a previous upward/downward trend with increasing volume and momentum, presenting an excellent reward-to-risk opportunity.
HMT (High Momentum Trending):
HMT is based on trend, momentum, volume, and market structure across multiple timeframes. It highlights setups with strong potential for upward movement and higher rewards.
Whenever I spot a signal for my own trading, I’ll share it. Please note that conducting a comprehensive analysis on a single timeframe chart can be quite challenging and sometimes confusing. I appreciate your understanding of the effort involved.
Important Note :
Role of Key Levels:
- These zones are critical for analyzing price trends. If the key level zone holds, the price may continue trending in the expected direction. However, momentum may increase or decrease based on subsequent patterns.
- Breakouts: If the key level zone breaks, it signals a stop-out. For reversal traders, this presents an opportunity to consider switching direction, as the price often retests these zones, which may act as strong support-turned-resistance (or vice versa).
My Trading Rules
Risk Management
- Maximum risk per trade: 2.5%.
- Leverage: 5x.
Exit Strategy
Profit-Taking:
- Sell at least 70% on the 3rd wave up (LTF Wave 5).
- Typically, sell 50% during a high-volume spike.
- Adjust stop-loss to breakeven once the trade achieves a 1.5:1 reward-to-risk ratio.
- If the market shows signs of losing momentum or divergence, ill will exit at breakeven.
The market is highly dynamic and constantly changing. HMT signals and target profit (TP) levels are based on the current price and movement, but market conditions can shift instantly, so it is crucial to remain adaptable and follow the market's movement.
If you find this signal/analysis meaningful, kindly like and share it.
Thank you for your support~
Sharing this with love!
HMT v2.0:
- Major update to the Momentum indicator
- Reduced false signals from inaccurate momentum detection
- New screener with improved accuracy and fewer signals
HMT v3.0:
- Added liquidity factor to enhance trend continuation
- Improved potential for momentum-based plays
- Increased winning probability by reducing entries during peaks
HMT v3.1:
- Enhanced entry confirmation for improved reward-to-risk ratios
HMT v4.0:
- Incorporated buying and selling pressure in lower timeframes to enhance the probability of trending moves while optimizing entry timing and scaling
HMT v4.1:
- Enhanced take-profit (TP) target by incorporating market structure analysis
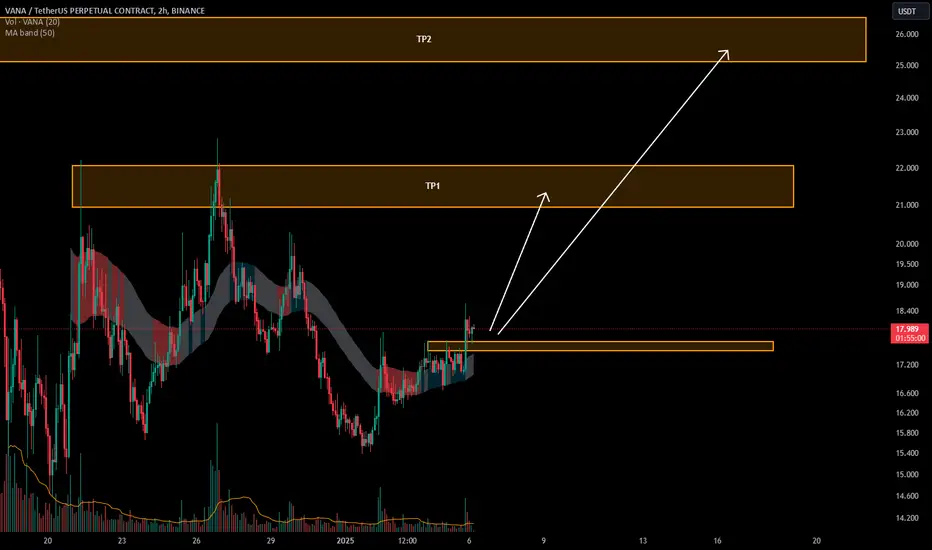
vanaI always wait for these kinds of currencies in the lower areas. Sometimes they arrive, sometimes they don't. For now, keeping the green box, maybe he'll touch the red numbers above in the first step.


$VANA prediction! %40+Hello Traders,
Right now market is in red and panic setting in! Funny part is BTC is still above 100k. Remember we always dreamed of BTC reaching 100k for the past 10 years or more? Now the dreams come true and the altcoin market is still weak!? Something must be wrong or some entities trying to force us panic sell?! Anyhow after this wave of panic settles , we should see major move overall.
This coin is just out couple days ago and I did extensive research on it. Beyond and above! Do some research on X and find out about the founder. The more I research the more I like about this coin! Years of hard work put into this coin literally!!! That is why I don't care about yesterday's flash crash. Most of the time this sort of move is done by big whales so they can double their holdings. For traders this is very scary situation and most inexperienced traders sell. Human nature we sell when we panic. However most people didn't do their due diligence and skip the research part.( Remember you are investing your money into something.) That is why they panicked. Purely lack of research. If this coin was something random Binance wouldn't invest into 4.8million coin supply. Sort term we may go up or down rapidly but in the near future I believe this coin will reach beyond 10B+ market cap. Timelines on the chart is arbitrary but targets are expected to reach at some point! First target is at %40 gains. I will update this chart regularly!

VANA - Strong Breakout#VANA/USDT #Analysis
Description
---------------------------------------------------------------
+ VANA has successfully broken out from the resistance zone
+ We see strong bullish candles with decent volumes. I'm expecting this bullish momentum to hold.
+ I see a good trade opportunity here, i'm entering a small position here.
Entry: 22.2
SL: 18.2
TPs: 24, 26, 30, 33
---------------------------------------------------------------
Enhance, Trade, Grow
---------------------------------------------------------------
Feel free to share your thoughts and insights. Don't forget to like and follow us for more trading ideas and discussions.
Best Regards,
VectorAlgo

vana - double bottomFormed a "double bottom" pattern, is being pushed towards the resistance breakout, after fixing above the resistance you can go long. Targets are marked on the chart

VANA/USDT Analysis
#VANA/USDT is retracing within a corrective downtrend, approaching critical support zones at $14.291 and $12.261, aligning with the 0.618 Fibonacci level. These levels present potential rebound zones, where buyers may step in to reverse the trend. A confirmed bounce from support could trigger a sharp recovery toward the $22.576 resistance and higher levels, supported by the bullish momentum indicated on the chart. A stop-loss below $12.261 minimizes risk

But A.I. Is The Future!? "But A.I. Is The Future!?" He said while I ignored the excitement happily setting up my short yesterday at $28... In truth I am The CoinSlayer and I haven't shorted much lately well here was one. It was really fun.
Also something cant give me money forever perhaps we climb back up call it a trews???
"One coin to rule them all until there is wait two or three... Oh wait there's another one!!!"
YOLO Moonboyz 🌛 If you feel so inclined to do so.
🚽👄Toilet Mouth: " Why do all your post say Short!?" or a bunch of "BUT, BUT, BUT"
⭐Not my job to tell you to buy or sell entries matter to most I only care about my exits.
⭐Let each person determine their cost to acquire and choice to play or not.
No Advice to give just thoughts that I can't shake after the last 8 years in the world of "CRYPTO"
Things 🤷♂️ #Fixed IDK!
🙏FOR JUST A HEALTHLY PULLBACK!
""KEEP CALM AND MANAGE THY RISK & BALANCE your Senses!""
I am The CoinSLayer 👨💻😈
You have been warned by The Coin SLayer!
P.S. Now witha bag!
P.S.S. well two or Ten

VANA/USDT Technical Analysis$VANA/USDT Technical Analysis 📈
#VANA/USDT is retracing within a corrective downtrend, approaching critical support zones at $14.291 and $12.261, aligning with the 0.618 Fibonacci level. These levels present potential rebound zones, where buyers may step in to reverse the trend. A confirmed bounce from support could trigger a sharp recovery toward the $22.576 resistance and higher levels, supported by the bullish momentum indicated on the chart. A stop-loss below $12.261 minimizes risk
@Whalescryptovip
