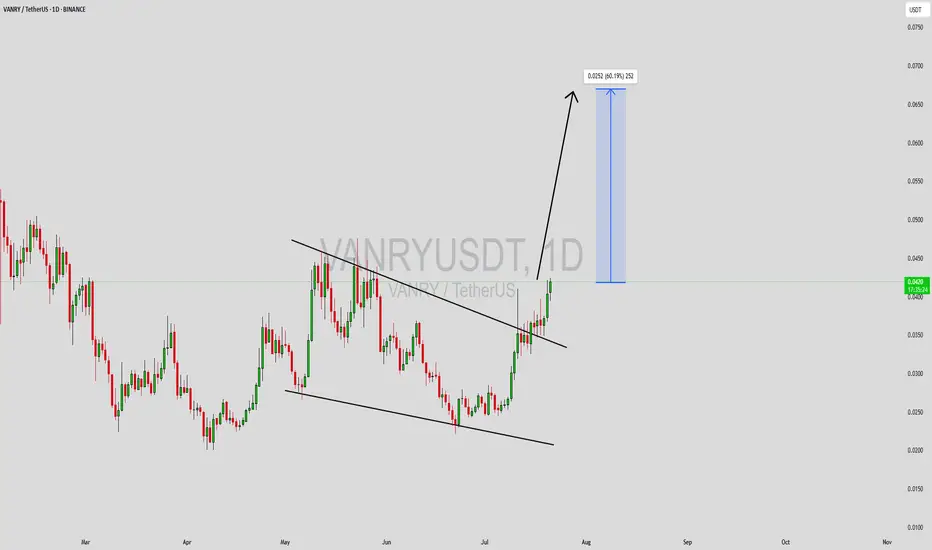
VANRYUSDT Forming Potential BreakoutVANRYUSDT is currently showing a potential breakout pattern, making it one of the more exciting altcoins to keep an eye on in the short term. The price structure has tightened in recent sessions, often a precursor to explosive movement. With strong volume backing the recent price action, the possibility of an upward breakout becomes increasingly likely. Based on the technical setup and broader sentiment, an expected gain of 50% to 60%+ could be achievable in the coming weeks if momentum sustains.
Vanar Chain (VANRY) is beginning to catch the attention of investors due to its innovative blockchain infrastructure and expanding ecosystem. As the project builds utility and demonstrates consistent development, interest from both retail and strategic backers is on the rise. This growing traction is contributing to the observed increase in trading activity, further fueling the potential breakout scenario from a technical standpoint.
The current chart suggests price consolidation near a key resistance level, which, once breached, could trigger a significant upward push. Traders watching this setup may consider entering upon confirmation of the breakout with volume, targeting higher levels based on recent price history and measured move projections. This makes VANRYUSDT an attractive play for breakout traders and momentum investors.
✅ Show your support by hitting the like button and
✅ Leaving a comment below! (What is You opinion about this Coin)
Your feedback and engagement keep me inspired to share more insightful market analysis with you!
VANRYUSDT trade ideas
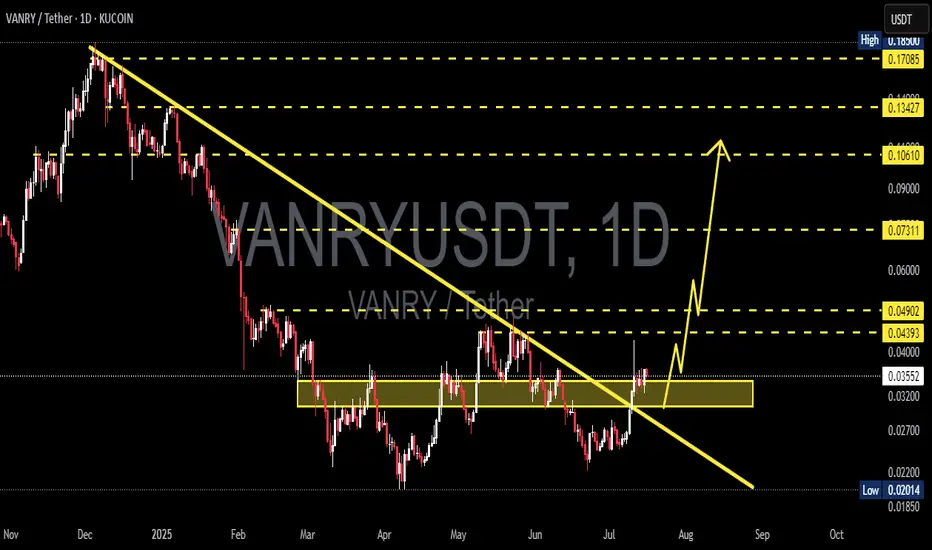
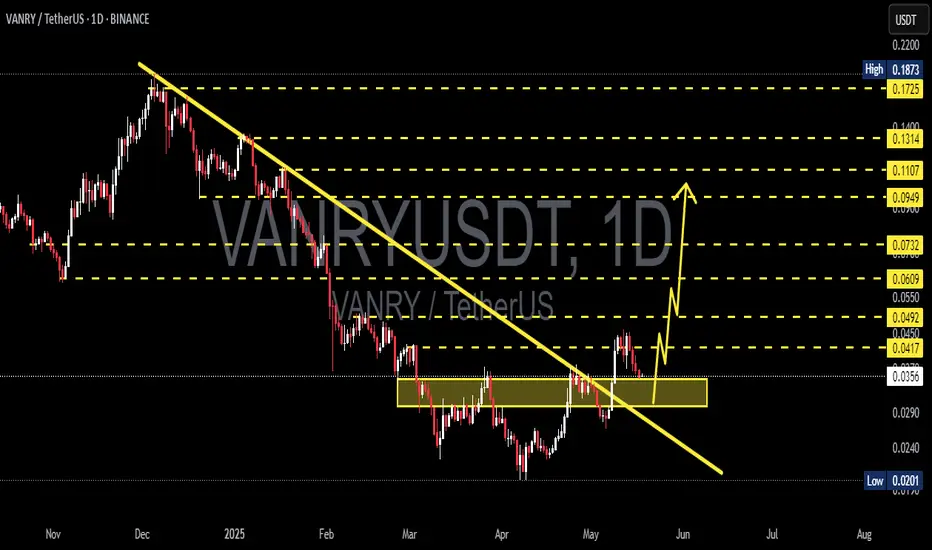
VANRY/USDT: Major Breakout from Downtrend – Is This the Start?
After months of downward pressure, VANRY/USDT has finally shown a strong technical breakout, potentially marking a shift in momentum and the beginning of a bullish phase.
📊 Technical Pattern & Market Structure
🔻 1. Descending Trendline Breakout
Price has successfully broken above a long-term descending trendline that has capped the market since November 2024. This breakout is a key signal of a potential trend reversal, suggesting the sellers are losing control.
🟨 2. Accumulation Zone Breakout
For over 3 months, the price consolidated within a clear accumulation zone between 0.02600 – 0.03300 USDT. The breakout from this zone indicates that accumulation may be complete, and price is now entering a markup phase.
🔁 3. Retest Confirmation
After the breakout, VANRY has successfully retested the previous resistance as new support (0.03300 – 0.03500), confirming the breakout as valid. This is often considered a textbook bullish setup.
✅ Bullish Scenario
As long as the price holds above the breakout zone, the bullish outlook remains intact. Key resistance levels to watch:
Target Price Level Notes
🎯 Target 1 0.04393 USDT Minor resistance
🎯 Target 2 0.04902 USDT Key psychological level
🎯 Target 3 0.07311 USDT Mid-term bullish target
🎯 Target 4 0.10610 – 0.13427 USDT Long-term rally potential
🚀 Final Target 0.17085 USDT Previous swing high
> As long as price sustains above 0.035, these targets remain highly achievable in the coming weeks.
❌ Bearish Scenario
In case of a failed breakout or rejection from key resistances, the bearish case still exists:
🔻 Drop below 0.03200 could signal a failed breakout
📉 Downside targets: 0.02700 → 0.02200 → 0.02014 (strong historical support)
⚠️ Daily close below 0.03100 confirms a potential fakeout
🎯 Trading Strategy & Risk Management
Ideal Entry Zone:
→ Retest range of 0.03300 – 0.03550
Stop Loss:
→ Below 0.03100 (invalidates bullish thesis)
Take Profit Levels:
→ Scale out profits at 0.043 / 0.049 / 0.073 / 0.106 etc.
> Using a trailing stop or scaling out strategy can maximize profits as the trend develops.
🔍 Technical Summary
This is a classic Breakout + Retest setup. The combination of trendline breakout, horizontal resistance flip, and retest creates a high-probability bullish pattern.
From a Wyckoff perspective, this could be the transition from accumulation to markup phase, especially if volume increases.
📢 DISCLAIMER:
This analysis is for educational purposes only and does not constitute financial advice. Always do your own research and manage risk accordingly.
#VANRY #VANRYUSDT #CryptoBreakout #AltcoinSetup #BullishRetest #DescendingTrendlineBreakout #CryptoTechnicalAnalysis #WyckoffAccumulation #BreakoutStrategy
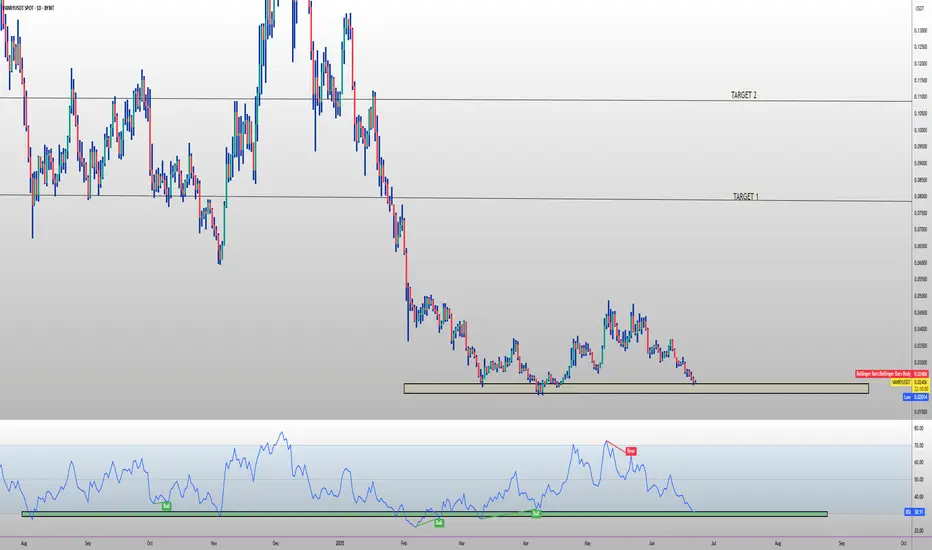
VANARY UPDATE FOR 2025 🔥 $VANRY long setup (1 D) 🚀
✅ Entry Zone: $0.020 – $0.0241 (2025 demand + wedge apex)
🎯 Targets
• TP-1: $0.08 (Q4-24 supply flip)
• TP-2: $0.125 (Mar-24 breakdown block)
⛔ Stop-Loss
Daily close < $0.016
📊 Thesis
• Vanar → first AI-native L1: built-in models & on-chain data 🤖
• Proof-of-Reputation consensus = fast, green & Sybil-resistant 🌿
• Gaming & metaverse pivot: Virtua, VGN & NVIDIA partner titles 🎮
• illumine NFT Studio & multichain minting live
• ERC-20 VANRY bridged to Ethereum & Polygon for DeFi liquidity 🌉
• Super-low fixed gas + carbon-neutral infra = retail-ready UX
• NVIDIA, Emirates Digital Wallet & Viva Studios strategic partners
VANRYUSDT 1D AnalysisVANRY ~ 1D Analysis
#VANRY Buy back gradually from here if you still have confidence in this coin with a short term target of at least 15%++
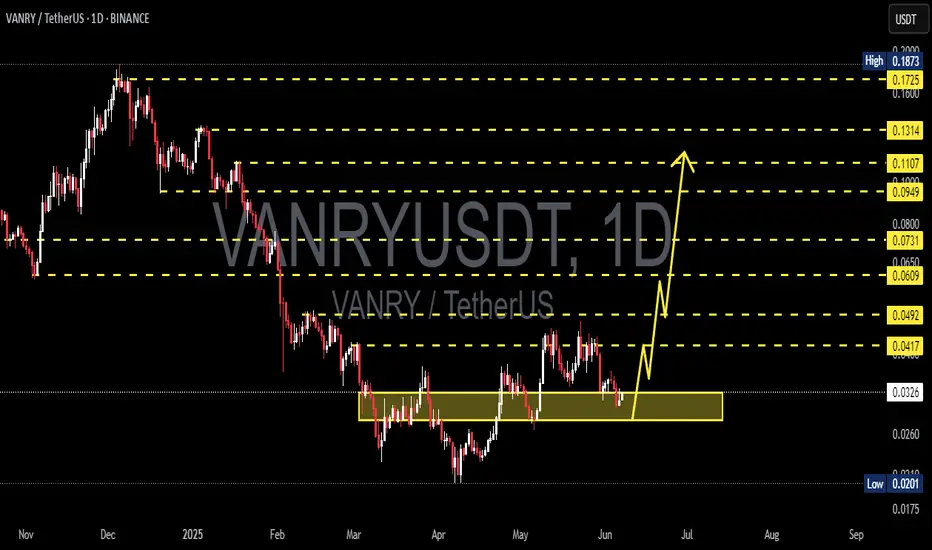
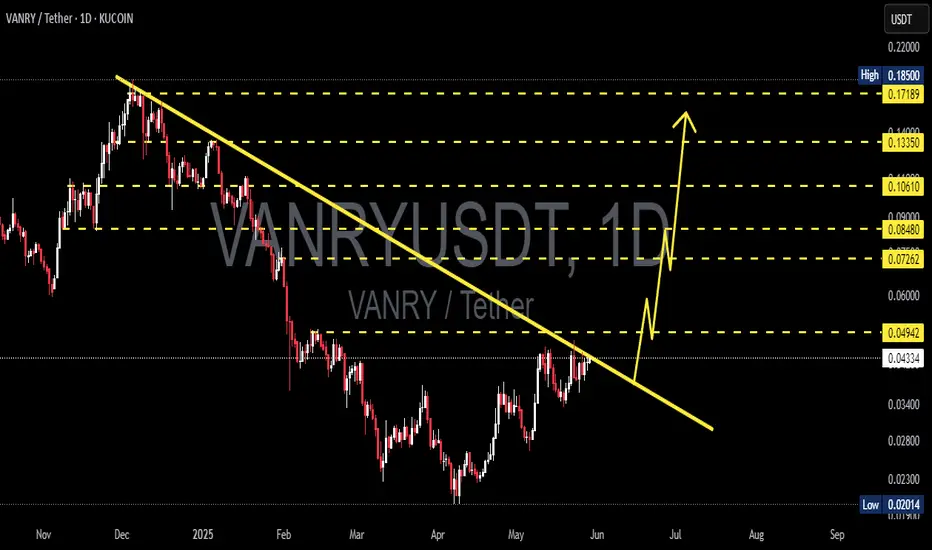
VANRYUSDT 1D Analysis VANRY ~ 1D Analysis
#VANRY Buy gradually after successfully breaking through this resistance line with a short-term target of at least 15%+ And long term target $0.185
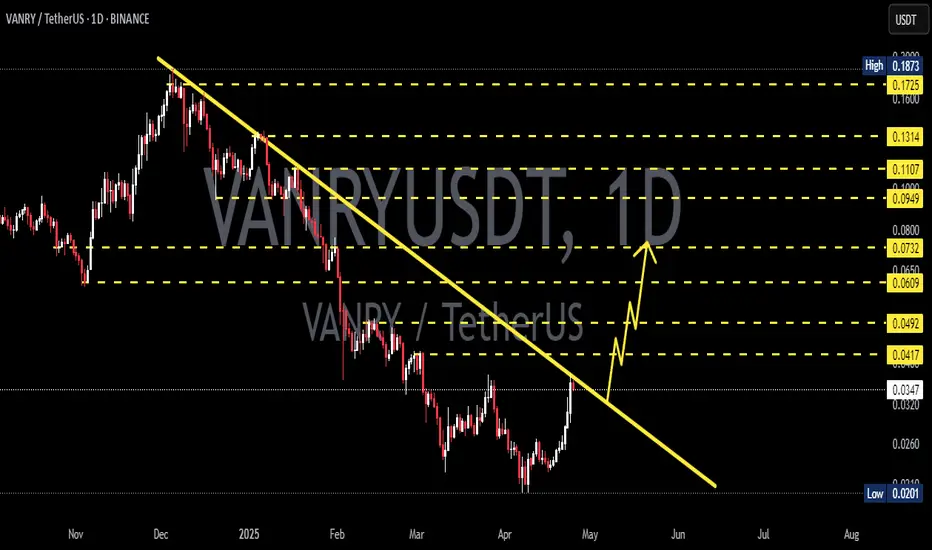
VANRYUSDT 1D VANRY Analysis VANRY ~ 1D Analysis
#VANRY Buy back gradually from here if you still have confidence in this coin with a short term target of at least 15%+ from here.
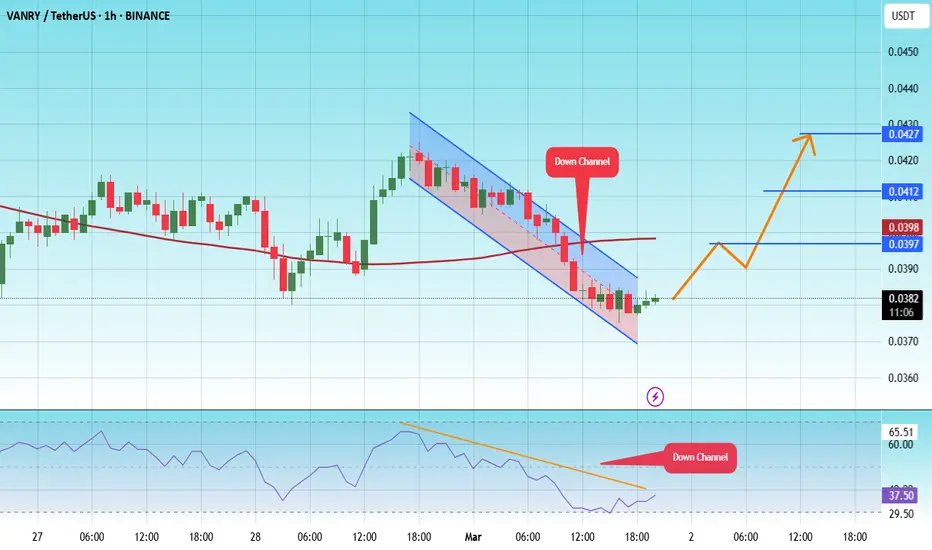
#VANRY/USDT#VANRY
The price is moving in a descending channel on the 1-hour frame and is expected to continue upwards
We have a trend to stabilize above the moving average 100 again
We have a descending trend on the RSI indicator that supports the rise by breaking it upwards
We have a support area at the lower limit of the channel at a price of 0.0374
Entry price 0.0381
First target 0.0397
Second target 0.0412
Third target 0.0427
5-wave Elliot structure! After a perfect bounce, VANARY is struggling with 3 major resistance now. first the ~$0.03665 level; second, the trend line which is suppressing the bullish momentum for about 3 months; third, a bearish RSI divergence almost in all time frames. here's a trade setup:
Long it if it breaks ~$0.03665:
TP1: $0.042.
TP2: $0.05.
Short it if it beaks $0.033:
TP1: $0.03.
TP2:$0.027.

VANRYUSDT 1D AnalysisVANRY ~ 1D Analysis
#VANRY Buy after successfully penetrating this resistant line with a short -term target of at least 10%+ from here.
VANRY BREAKOUT>>> 100% pump incoming....As we see the trend, the Vanry made the bottom now is reclaimin the price slowvly but goind up. Very soon to breakout and move on for other resistances, so this is a good buy here..
Not financial adice .)

Vanar Morgulis, boizSoo, Do u think Im done?
Nooope :) Patience and cold calculation are what is needed in trading high-risk assets.
AND THIS EXPERIENCE COST ME A LOT!! I share it with you.
Anyway. I have been studying trading platforms for a long time and I am returning to the game, faster, smarter, stronger.. as it was with Daft Punk
If Im genious enough (yas IT IZ), then we have two options:
LOOK closer, folkz and don't be fooled - wave 5 of C is yet to be set , if it is ED (option 2)
Othawise, if the correction is really over, then it was ZZ and we can take Longz (option 1)
zoom out my chart and look at the Fibonacci levels - if there is a correction, it will be very little. And this is the case with almost all altcoins.
I was very surprised by the amount of sleepy memes that Binance listed through, it's real madness. But, money doesn't smell, you can trade both lead and cheese

Vanar Chain VANRY on the wayWhat is Vanar Chain (VANRY)?
Vanar Chain represents a multifaceted blockchain ecosystem, engineered to cater to a diverse range of applications, from entertainment to mainstream utility. Central to its architecture is the native gas token, VANRY, which plays a crucial role in facilitating transactions and smart contract executions across the network. This innovative platform is not just about cryptocurrency transactions; it extends its utility to a broader spectrum of functionalities aimed at enhancing user engagement and developer participation.
One of the standout features of Vanar Chain is its social wallets, which are designed to integrate seamlessly into users' social lives, enabling easier and more intuitive interactions with blockchain technology. This approach not only demystifies blockchain for the average user but also encourages wider adoption by making transactions more relatable and accessible.Welcome to the world of VANAR Chain, a cutting-edge blockchain ecosystem where efficiency, speed, and security converge. At the heart of this revolutionary platform is VANRY, our native gas token, designed to fuel transactions and smart contract operations within the VANAR Chain.
Total supply: 1.99B VANRY
Max. supply: 2.4B VANRY
Circulating supply: 1.94B VANRY
Idea?
Tp1 9 usdt
Tp2 20 usdt
Tp3 45 usdt
All-time high?
Mar 15, 2021 (4 years ago) near 1.10.
All-time low?
Sep 13, 2023 (1 year ago) near 0.017.
This month targeting 0.02, ATL position. Good entry zone now or ATL zone. Bullish flag on the way.
This is only my idea guys.
This is not financial advice !
Please do your analysis and consider investing !! Thanks for supp.

VANRY Long Trade SetupOn 4hr time frame, clean Change Of Character (ChoCh) has been observed indicating sign of strength. Price is at demand , Stoploss: 0.022, Targets: 0.0423 & 0.05

Vanry Limit order long to $0.042 Today!I have a limit order setup to long vanry whatever that is, cool name.
Entry: $0.03443
Stop: $0.03242
Going to bed now.
IF when I wake order is filled. I'll look to scale into the position if ideal.

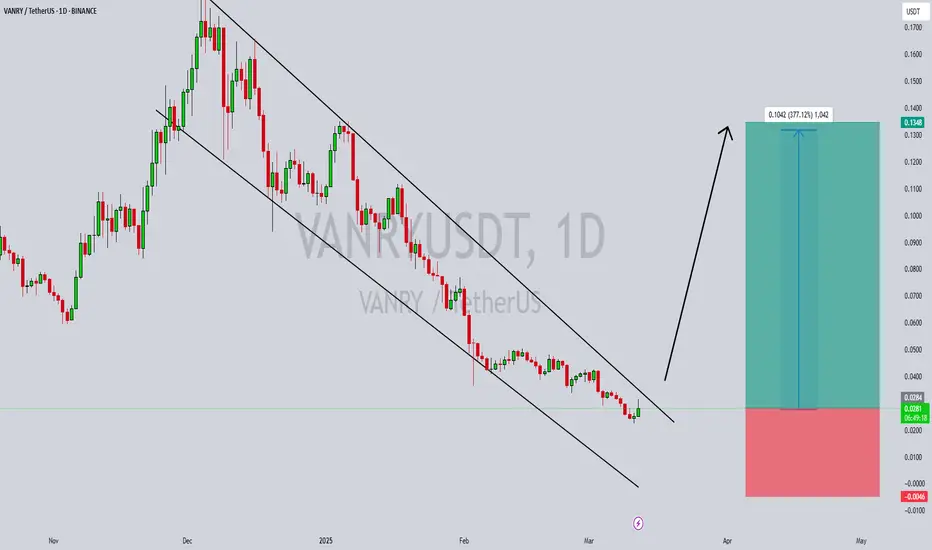
VANRYUSDT Approaching a Breakout from Falling Wedge VANRYUSDT is currently forming a falling wedge pattern, a bullish technical setup that traders are closely watching. This pattern often signals a potential breakout, and with strong volume backing the movement, the chances of a significant price surge are increasing. As the price consolidates within the wedge, buyers are gradually stepping in, indicating growing investor confidence in this project.
The market sentiment around VANRYUSDT remains positive, with investors showing increased interest in its potential. A breakout from this pattern could trigger an explosive rally, with expected gains ranging between 250% to 300%. If the price successfully breaches the resistance, it could initiate a strong uptrend, attracting even more market participants and pushing VANRYUSDT toward higher levels.
With strong volume supporting the price action, traders should keep a close watch on the key resistance level. A confirmed breakout with sustained buying pressure could validate the bullish outlook. As the crypto market remains volatile, proper risk management and technical confirmation are essential before entering a position in this promising setup.
✅ Show your support by hitting the like button and
✅ Leaving a comment below! (What is your opinion about this Coin?)
Your feedback and engagement keep me inspired to share more insightful market analysis with you!
VANRYUSDTWe can attempt to buy VANRYUSDT from specified level as it make HL , also 0.618 FIB level intact indicate that it moves upward.
SL , TP mention in chart.

Vanar Chain VANRYWhat is Vanar Chain (VANRY)?
Vanar Chain represents a multifaceted blockchain ecosystem, engineered to cater to a diverse range of applications, from entertainment to mainstream utility. Central to its architecture is the native gas token, VANRY, which plays a crucial role in facilitating transactions and smart contract executions across the network. This innovative platform is not just about cryptocurrency transactions; it extends its utility to a broader spectrum of functionalities aimed at enhancing user engagement and developer participation.
One of the standout features of Vanar Chain is its social wallets, which are designed to integrate seamlessly into users' social lives, enabling easier and more intuitive interactions with blockchain technology. This approach not only demystifies blockchain for the average user but also encourages wider adoption by making transactions more relatable and accessible.Welcome to the world of VANAR Chain, a cutting-edge blockchain ecosystem where efficiency, speed, and security converge. At the heart of this revolutionary platform is VANRY, our native gas token, designed to fuel transactions and smart contract operations within the VANAR Chain.
Total supply: 1.99B VANRY
Max. supply: 2.4B VANRY
Circulating supply: 1.94B VANRY
Idea?
Tp1 9 usdt
Tp2 20 usdt
Tp3 45 usdt
All-time high?
Mar 15, 2021 (4 years ago) near 1.10
All-time low?
Sep 13, 2023 (1 year ago) near 0.017
Possible drop here. Good entry zone now or ATL zone.
This is only my idea guys.
This is not financial advice !
Please do your analysis and consider investing !! Thanks for supp.

VanryAnother porject which is gearing up for a major reversal. All technical aspect of a reversal has been completed, which includes taking both side of the liquidity and now trend is testing the previous low.
All price has to do is make a monthly close above 0.700 and you can see a major reversal in coming weeks

VANRYUSDThi friends
VANRY is showing some strength to grow...
we are here in lowest position of Bolinger band, the price got the liquidity, and we must start growing soon...
in order to ICHIMUKO ecosystem & order blocks in uppers zones, we can see 0.21$ soon...
be carefull these days the market got very volatile so please use proper fund & leverage. and if possible try in Spot position these days
best regards

VANRYUSDT 2DVANRY ~ 2D Analysis
#VANRY on Time Frame 2D retesting this support,. buy from here if you still have Conviction on this coin. with a minimum target of 20%++

$vanryabout to reclaim previous range low
IF so should move quick to range high and deviate there or continue

VANRY: RE-BUY ZONE AT CHANNEL SUPPORT AND TP$VANRY/USDT 1D Analysis
🎯 DESCENDING CHANNEL SETUP
Current Status:
• Price: $0.0883 (-1.12%)
• Volume: 11.81M
• Inside descending channel (yellow lines)
• Gray trendlines showing potential reversal zones
KEY LEVELS:
• Major Resistance: $0.23-0.25 (upper box)
• Support: $0.065 (channel bottom)
FORECAST:
- Accumulation at re-buy zone
- Potential breakout targeting $0.25
- Channel bottom must hold for bullish scenario
Risk Management:
• Entry: $0.08-0.085
• Stop Loss: < $0.065
• Target: $0.20-0.25
• R:R = 1:3
RE-buy Zone: $0.05-0.06(IF BREAKOUT SUPPORT TRENDLINE )
#Crypto #TechnicalAnalysis #Trading

VanryTechnical Analysis for VANRY/USDT
The chart depicts a 3-day timeframe, highlighting a Descending Channel that has guided the price movement consistently lower. Within this channel, a more compact pattern, known as a Falling Wedge, has emerged, which is often considered a bullish formation with the potential for an upward breakout.
Key Highlights of the Analysis:
Descending Channel: This channel is defined by parallel descending trendlines of resistance and support. The price has been moving within these boundaries consistently.
Falling Wedge: Inside the channel, the price forms a converging structure, signaling a slowdown in selling pressure and a potential increase in buying interest near support levels.
Strong Support: A significant support zone is identified around $0.0609 - $0.0887, where the price has shown resilience previously. This area could act as a critical level for a potential reversal.
Potential Breakout: If the price successfully breaks above the Falling Wedge's upper trendline, a strong upward move is possible, targeting the previous resistance levels at $0.1177 and possibly beyond $0.1500.
RSI Indicator: Currently near 42, the RSI suggests the price remains in a neutral zone, leaving room for an upward movement, especially following a breakout.
