DJ30 trade ideas
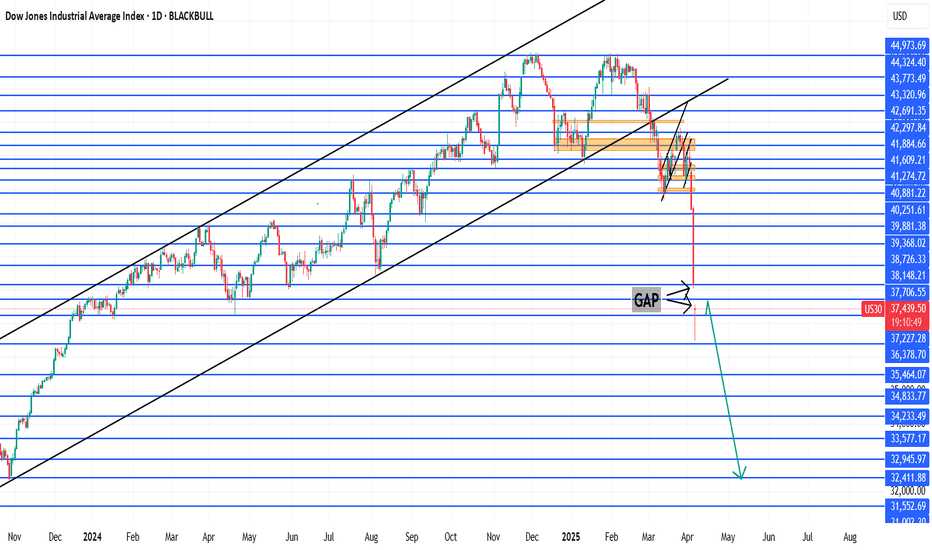
Intraday entry 1Everything is pretty much explained in the picture itself.
I am Abhishek Srivastava | SEBI-Certified Research and Equity Derivative Analyst from Delhi with 4+ years of experience.
I focus on simplifying equity markets through technical analysis. On Trading View, I share easy-to-understand insights to help traders and investors make better decisions.
Kindly check my older shared stock results on my profile to make a firm decision to invest in this.
Kindly dm for further assistance it is for free just for this stock.
Thank you and invest wisely.
US30: Absolute Price Collapse Ahead! Short!
My dear friends,
Today we will analyse US30 together☺️
The in-trend continuation seems likely as the current long-term trend appears to be strong, and price is holding below a key level of 37,395.0 So a bearish continuation seems plausible, targeting the next low. We should enter on confirmation, and place a stop-loss beyond the recent swing level.
❤️Sending you lots of Love and Hugs❤️
US30 MELTDOWN! – 07/04/25🔥 US30 MELTDOWN! – April 7, 2025 🔥
📉 Historic Drop: Dow Jones tanks nearly 3,000 points in just days, crashing through all major support levels!
📉 Low Tagged: Price wicked into the 36,743 support zone before catching a small bounce.
🧠 What’s Happening?
This looks like panic selling—likely triggered by macroeconomic data or unexpected news. Volume is up, and structure is clearly broken.
Just In: The Dow Jones Industrial Average (DJI) Dip 1,300 PointsOverview
The Dow Jones Industrial Average, also known as the DJIA or simply the Dow, is a market index frequently used to gauge the overall performance of the U.S. stock market. Indexes like the DJIA track the prices of a group of securities.
The Consumer index saw a downtick of 1300 points representing a 5.5% dip. This was days after Donald Trump declared a new set of tariffs targeting 185 countries, including major U.S. trading allies.
Tariffs Concern
The US stocks are poised to continue their bloodbath as futures signaled more fear over President Donald Trump's tariffs. Administration officials and Trump himself signaled on Sunday that they won't back down from their aggressive decisions. Meanwhile, an inflation report is due later this week as well as bank earnings.
Wall Street remained in fear mode over President Donald Trump's tariffs on Sunday evening as futures pointed to more steep losses.
The S&P 500 futures also sank 3.9% and Nasdaq futures dived 4.9%. That follows a devastating week that saw the worst selloff since the early days of the COVID-19 pandemic.
Similarly, the 10-year Treasury yield dropped 8.5 basis points to 3.906%, and US crude oil prices fell 3.7% to $59.72 a barrel.
Countries affected by the tariff rates are:
China (34%), the European Union (20%), and Japan (24%). Fitch Ratings estimated that the effective tariff rate could hit 25% on average — the highest in more than 115 years.
In an X post on Sunday, Former Treasury Secretary Larry Summers cautioned, saying there's a very good chance of more market turbulence similar to what was seen on Thursday and Friday.
Those sessions represented the fourth largest two-day drop in the last 85 years, Summer said. The selloff wiped out about $6 trillion in market cap.
“A drop of this magnitude signals that there’s likely to be trouble ahead, and people ought to be very cautious,” Summers wrote.
Meanwhile, Trump administration and the president himself defended the tariffs.
Technical Outlook
as of the time of writing, the The Dow Jones Industrial Average (DJI) Dip index point is down 5.5% trading in tandem with the support point that aligns with the 38,000 points. On a bearish case scenario, a break below this axis could be canning for the stock market as it will lead to panic selling in the industries concerned.
Similarly, should the bulls manage to thrust the DJI points up to the 42,000 points, we should experience a respite from the bears and possibly increased momentum might sent the stocks soaring higher. With the RSI at 23, this is hinting to a weak momentum with more downside ahead.
Dow Jones - Pivotal moment for the bulls and bears!The Dow Jones Industrial Average is currently approaching a critical juncture, as it risks breaking below and staying under the neckline of a potential double top pattern. A double top formation is typically a bearish signal, indicating a potential trend reversal after the price tests a key resistance level twice, failing to break higher. The neckline, which forms the base of this pattern, is the level that traders will be watching closely to determine the strength of this bearish signal.
If the Dow breaks below and stays under the neckline, it could trigger further downside momentum as liquidity is swept from the market. However, it's essential to note that this initial breakdown could just be a "liquidity sweep," a move designed to trigger stop-loss orders and shake out weaker hands. For the Dow to maintain its bullish potential, it must quickly recover and hold above the neckline after this sweep. If it can do so, the market may find stability and begin to look for higher prices again, as the double top formation would then be invalidated, and a more bullish outlook could emerge.
In summary, while the Dow Jones is at a pivotal moment, the key to higher prices will be whether it can hold above the neckline after sweeping liquidity. A failure to do so could signal further downside, but a strong recovery above the neckline would leave the door open for a potential rally.
For now the Dow jones swept the liquidity under the neckline. However, it needs a quick recovery to maintain and find support on the neckline again. The risk that it now faces is the resistance of the 50, 100 and 200-day MA. Staying above the neckline and reclaiming these MA could be a massive bullish signal on the Dow Jones.
Thanks for your support.
- Make sure to follow me so you don't miss out on the next analysis!
- Drop a like and leave a comment!
Lets chat in the comment section. See you there :)
Easy tricks to master you mind during correctionsHello,
The markets have been correcting, and fear seems to be creeping in. What most investors fail to understand is that big corrections such as this are the best opportunities handed to them. This is the best time to buy since markets are trading at the bottom. Additionally, for this time earnings season is about to kick in while this time the market is trading at the bottom. We compiled a few things that can help you remain composed in the current market environment.
A transformative book I would recommend is Trading in the Zone by Mark Douglas. Douglas brilliantly compares elite traders to world-class athletes, revealing that both achieve greatness not through luck, but through rigorous mental discipline and robust, repeatable systems. To guide you toward this coveted "zone" of peak performance, here are four indispensable strategies:
Craft a Rock-Solid Trading Plan
A well-defined trading plan is your compass in the chaotic wilderness of the markets. It spells out precise conditions for entering trades, selecting opportunities, and exiting positions. By faithfully following this blueprint, you anchor yourself in accountability, sidestepping the pitfalls of reckless, emotion-driven moves.
Maintain a Detailed Trading Journal
Think of your trading journal as a mirror reflecting your journey. Record every trade, emotion, and market insight. This disciplined habit empowers you to evaluate your performance, pinpoint weaknesses, and sharpen your approach—unlocking a deeper understanding of your own psychological triggers.
Cultivate Confidence Through Realistic Goals
Confidence isn’t bravado—it’s the quiet strength to take calculated risks and embrace the results. Build it by practicing on a demo account with the seriousness of real stakes, setting attainable targets, and celebrating small wins. This foundation turns uncertainty into opportunity.
Master the Art of Risk Management
In trading, protecting your capital is paramount. Embrace proven techniques like setting risk/reward ratios, deploying stop losses, and sizing positions sensibly. These habits don’t just shield you from ruin—they pave the way for consistent, long-term gains.
With the above rules we believe you should be able to invest or remain invested during these volatile moments. Again, remember the tariffs that have been set are the ceiling and we expect concessions to come once negotiations between countries begin.
Good luck and stay invested. As shown in the chart, this is not the first time the market is undergoing a significant correction. What's clear is that markets always recover from corrections and continue pushing higher. This further reinforces our conviction that this are the best times to begin buying.
Disclosure: I am part of Trade Nation's Influencer program and receive a monthly fee for using their TradingView charts in my analysis.
Double-Top Pattern for the Dow Jones Industrial AverageA long-term, double-top formation has emerged from the all-time highs of 45,073 on the weekly chart of the Dow Jones Industrial Average. With the pattern’s neckline breached (derived from the low of 41,844), chartists will likely target the structure’s profit objective, which stands at 38,613.
Reversal or Continuation? US30 Tests Major SupportThe US30 is testing a pivotal multi-year trendline following an aggressive breakdown from its early 2025 highs. After months of consistent distribution near the 42,000–44,000 range, price capitulated with a steep selloff, driving the index down toward the 37,000 level. This area aligns closely with the long-term trendline dating back to late 2023 and marks the lower boundary of the broader structural expansion.
The current reaction appears to be forming at a potential inflection point, as price hovers around the lower bounds of its macro range. The steep angle of descent suggests overextension, with momentum temporarily outpacing rational valuation zones. Meanwhile, a notable high-volume cluster from prior activity remains situated between 41,500 and 42,000 — an area likely to attract price in the event of a technical retracement.
If buyers begin stepping in at this historically respected trendline, the market could stage a multi-week recovery, targeting this upper resistance zone. However, failure to stabilize here risks further downside, potentially exposing the market to deeper corrections toward 35,000 or lower. All eyes now turn to this structural juncture as price teeters between oversold conditions and critical support.
Bullish rebound?Dow Jones (US30) is falling towards the pivot which is a pullback support and could bounce to the 1st resistance which has been identified as a pullback resistance.
Pivot: 35,690.04
1st Support: 34,009.92
1st Resistance: 38,066.19
Risk Warning:
Trading Forex and CFDs carries a high level of risk to your capital and you should only trade with money you can afford to lose. Trading Forex and CFDs may not be suitable for all investors, so please ensure that you fully understand the risks involved and seek independent advice if necessary.
Disclaimer:
The above opinions given constitute general market commentary, and do not constitute the opinion or advice of IC Markets or any form of personal or investment advice.
Any opinions, news, research, analyses, prices, other information, or links to third-party sites contained on this website are provided on an "as-is" basis, are intended only to be informative, is not an advice nor a recommendation, nor research, or a record of our trading prices, or an offer of, or solicitation for a transaction in any financial instrument and thus should not be treated as such. The information provided does not involve any specific investment objectives, financial situation and needs of any specific person who may receive it. Please be aware, that past performance is not a reliable indicator of future performance and/or results. Past Performance or Forward-looking scenarios based upon the reasonable beliefs of the third-party provider are not a guarantee of future performance. Actual results may differ materially from those anticipated in forward-looking or past performance statements. IC Markets makes no representation or warranty and assumes no liability as to the accuracy or completeness of the information provided, nor any loss arising from any investment based on a recommendation, forecast or any information supplied by any third-party.
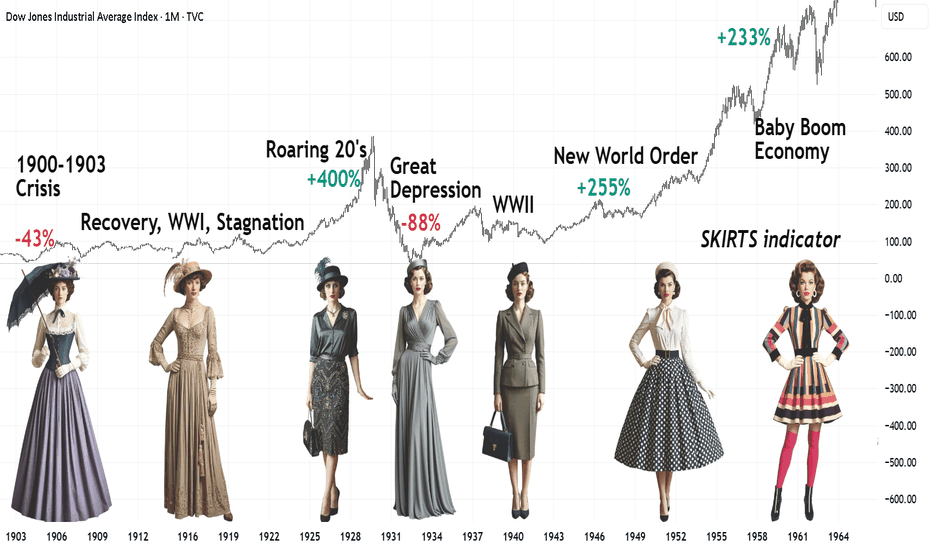
Skirt Lengths as Market Indicators: A Socionomics PerspectivePart of the #Socionomics series.
How fashion and societal moods shifted in the first half of the 20th century.
1900–1910
Economy: The rise of industrialization in the U.S. — Ford’s assembly line (1908), booming cities, and a growing wealth gap between the elite and the working class. In Europe, colonial powers raced for survival, fueling military spending (sound familiar?).
Mood: Faith in technological progress clashed with protests against exploitation. Suffragettes smashed London storefronts (1908), while New York’s Triangle Shirtwaist Factory fire (1911) galvanized labor rights movements.
Fashion: Rigid corsets and floor-length skirts symbolized Victorian morality. Yet rebels like designer Paul Poiret introduced hobble skirts — a tentative step toward freedom of movement.
1910–1920
Economy: World War I (1914–1918) reshaped the globe: Europe lay in ruins, while the U.S. profited from arms sales. Postwar hyperinflation crippled Germany, and the Spanish Flu (1918–1920) claimed millions.
Mood: Women replaced men in factories, only to be pushed back into domestic roles after the war. A feminist explosion: American women won voting rights in 1920.
Fashion: Skirts rose to ankle-length for practicality. By the decade’s end, the flapper emerged — straight-cut dresses, beaded necklaces, and cigarettes in hand, defying tradition. A sign of the stock market’s brewing boom.
1920–1929
Economy: The "Roaring Twenties" — jazz, speculation, and Prohibition. The stock market quadrupled; ordinary Americans borrowed heavily to invest, then borrowed again against rising shares.
Mood: Hedonism reigned. Speakeasies and Gatsby-esque parties masked pre-crash euphoria.
Fashion: Knees on display! Fringed dresses, bobbed haircuts, and gartered stockings. By 1929, subdued silhouettes crept in — an omen of crisis.
1930–1940
Economy: The 1929 bubble burst: Wall Street crashed, triggering the Great Depression (1929–1939). U.S. unemployment hit 25%. Europe veered toward fascism and war.
Mood: Despair from Dust Bowl migrations and hunger marches. Yet Hollywood’s Golden Age offered escapism.
Fashion: Skirts lengthened — modesty returned. Long dresses dominated, while cheap fabrics and turbans (to hide unwashed hair) became staples.
1940–1950
Economy: World War II (1939–1945). Postwar Europe rebuilt via the Marshall Plan; the U.S. embraced consumerism.
Mood: Patriotism ("Rosie the Riveter") and postwar hope. The baby boom idealized domesticity.
Fashion: War mandated minimalism: knee-length skirts and padded shoulders. In 1947, Christian Dior’s New Look rebelled — voluminous ankle-length skirts symbolized postwar opulence.
1950–1960
Economy: America’s "Golden Fifties" — middle-class expansion, cars, and TV. Europe recovered, but colonial wars (Algeria, Vietnam) exposed crises.
Mood: Conformity (suburban perfection) vs. teenage rebellion (James Dean, Elvis’s rock ‘n’ roll).
Fashion: Sheath dresses and midi skirts emphasized femininity. By the late 1950s, Mary Quant experimented with mini-skirts — a harbinger of the sexual revolution.
1960s: Peak of Postwar Prosperity
Economy: U.S. GDP grew 4-5% annually; unemployment dipped below 4%. Baby boomers (1946–1964) fueled suburban housing and education demand.
Fashion: The mini-skirt became an era-defining manifesto of freedom, paired with bold go-go boots. Economic optimism bred experimentation: neon synthetics (nylon, Lycra) and psychedelic hues.
Conclusion
Women’s fashion mirrors its era. Crises (1930s) hide knees; liberating times (1920s, 1960s) bare them. Even war skirts (1940s’ knee-length pragmatism) carried hope.
💡 Like and subscribe for insights your economics textbook won’t reveal!
#beginners #learning_in_pulse #interesting
#socionomics #history #fashiontrends
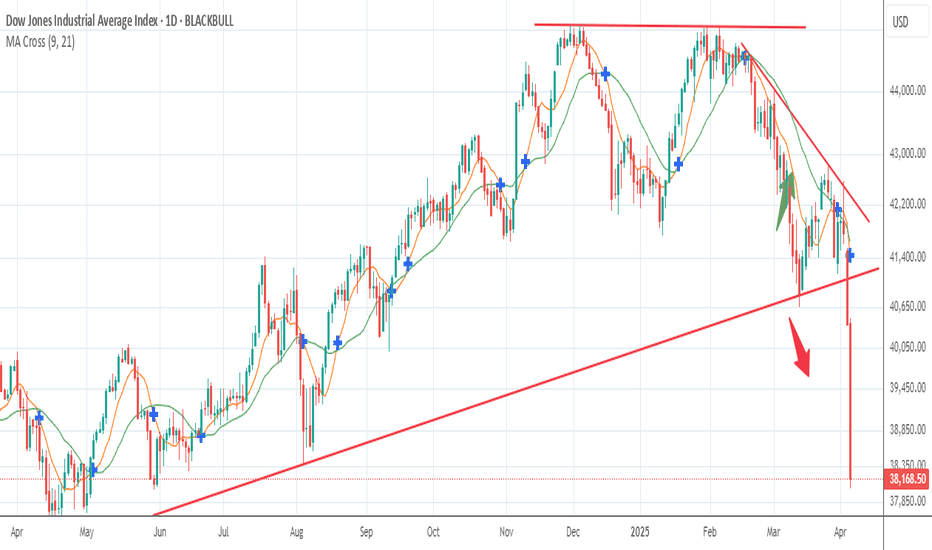
Bear Market Inbound!What a week, two days of plunge and the Dow sits below where Tariff Trump won.
World markets were ripe for this situation, waiting for the trigger... the trigger no doubt was Trump.
The charts do not lie, the news does not matter as much as price action, the question now is where we bottom for a while and bounce...any rally is to be sold.
Don't try and catch a falling knife, but be very careful shorting here at this point, expect a bottom this week.
Expect further selling Monday to a degree, but we are at a bottom fishing level.
Gold and especially silver were clobbered Thursday and Friday, we expected this earlier in the week and warned of toppy price action on our gold update. PM's are in a wave 4 down sideways move and next comes minor wave 5 up...long term holders have little to worry about...any pullback is a buying opportunity...$3000 gold is major support.
Appreciate a thumbs up...God Bless you all and good trading!


