BUYTrend Line Break
Previous Day Volume
Rejection Point
Untapped Order Point
Asian Session
High Structure Swing
DJ30 trade ideas
US30 SELLWe've seen a shift on the H4
Confirmation for a swing sell
Proper risk management is advised
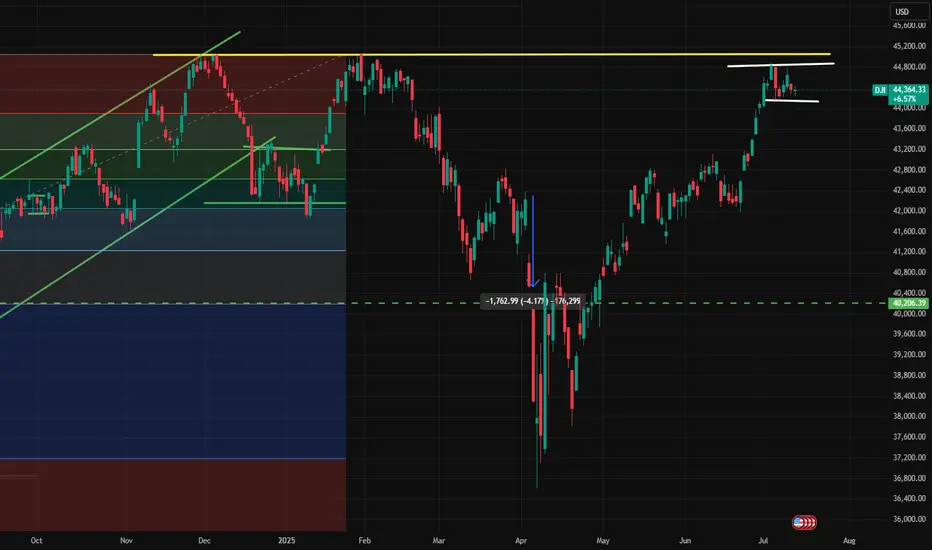
Dow Jones Technical Outlook – July 2025The Dow Jones is currently trading in a tight consolidation range just below its major resistance zone near 45,200.
After a strong bullish rally, the index is showing signs of exhaustion with lower volatility and sideways price action — forming a potential rectangle pattern. This type of structure typically signals a continuation or reversal, depending on the breakout direction.
📌 Key Levels to Watch:
Resistance: 45,200 – A breakout above this level may trigger a strong upside rally toward
Support: 44,050 – A breakdown below this can open the door for a retest of 43,200 or even 42,000.
Price is coiling — the market is waiting. The next breakout could set the tone for weeks to come.
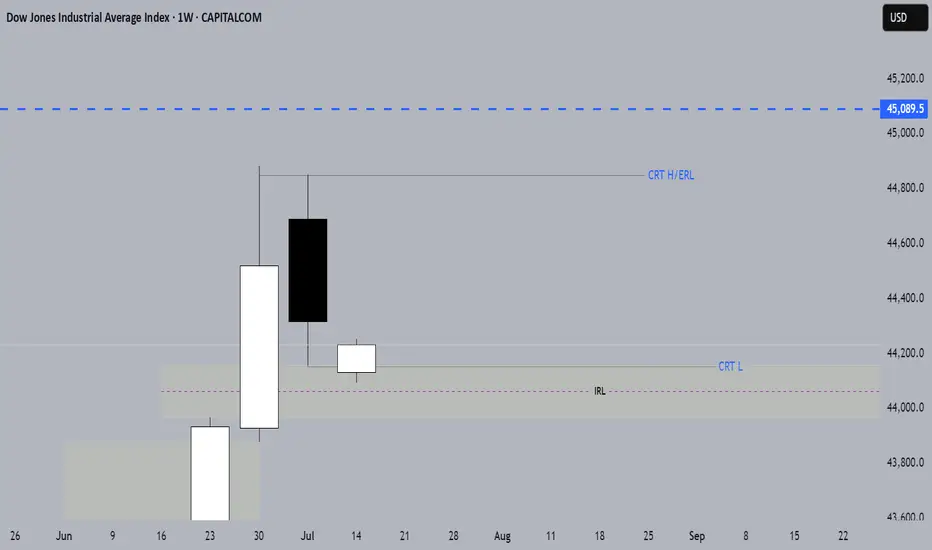
US30 BULLISH/ CRT, ERL&IRL CONFIRMATIONUS30 TO 45089.5
July is historically one of the Dow’s best-performing months.
WEEKLY CRT
IRL TO ERL
BUYTrend Line Break
Previous Day Volume
Rejection Point
Untapped Order Point
London Session
High Structure Swing

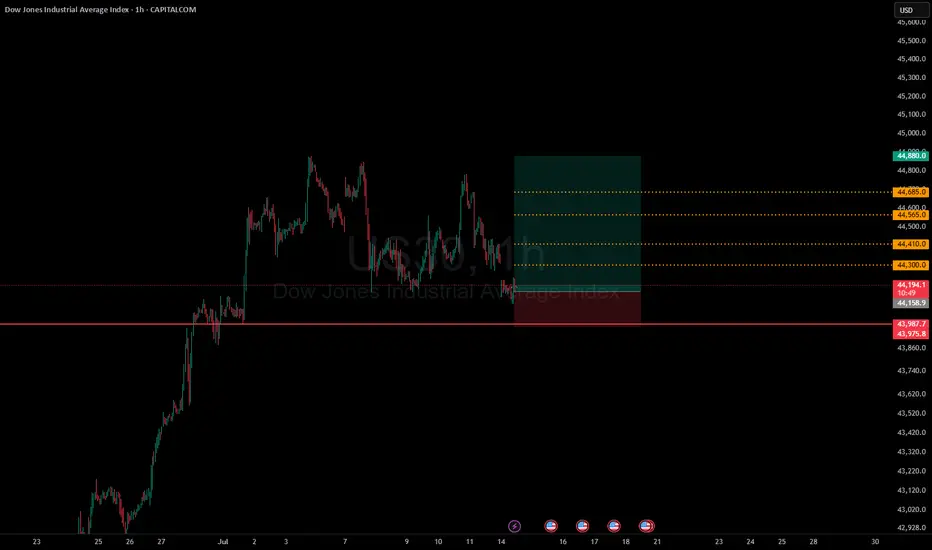
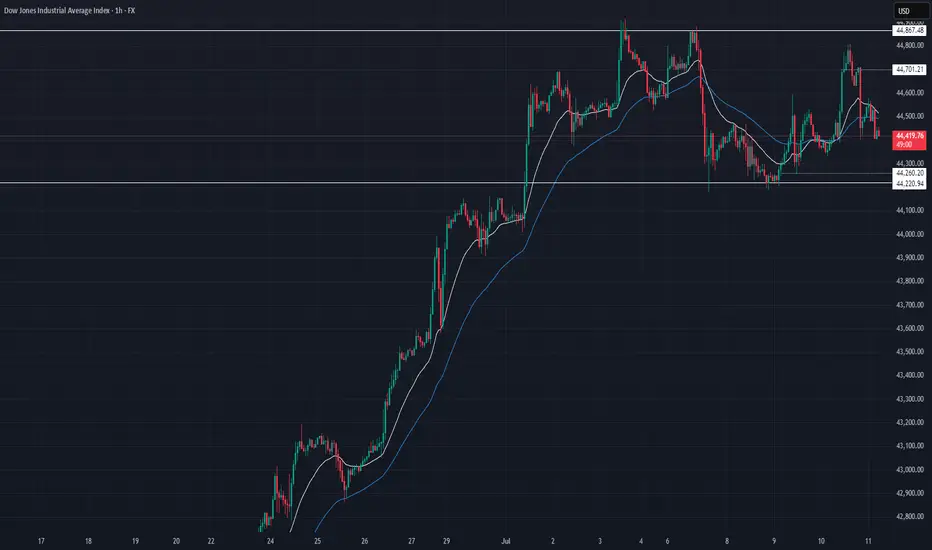
US30 Market Recap – 07/14/2025📍 US30 Market Recap – 07/14/2025
We’ve officially broken down out of the consolidation range between 44,220–44,867 📉
The structure is now shifting bearish, with price printing a series of lower highs and lower lows, and EMAs flipping to the downside. Sellers are in control heading into the week.
📊 Current Structure:
Bearish market shift confirmed below 44,220
EMAs (20 & 50) now angled downward and acting as dynamic resistance
Trendline support from June rally is broken
Last bounce attempt from 44,260 was weak and quickly faded
🔑 Key Levels:
🔽 Support: 43,800 → 43,600 → 43,300
🔼 Resistance: 44,220 → 44,400 zone
🧭 Pivot zone: Watch 44,000 psychological level for reactions
💡 Trade Setup Ideas:
🔻 Short Setup (Trend Continuation):
Entry: Retest + rejection near 44,220 or descending EMAs
TP1: 43,800
TP2: 43,600
SL: Above 44,300
⚠️ Avoid longing unless we reclaim and hold above 44,400 with strong momentum.
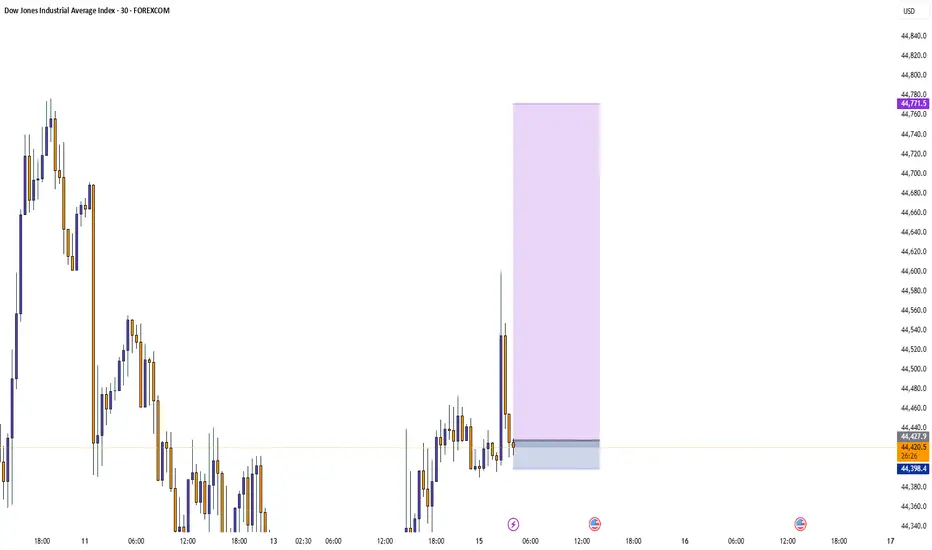
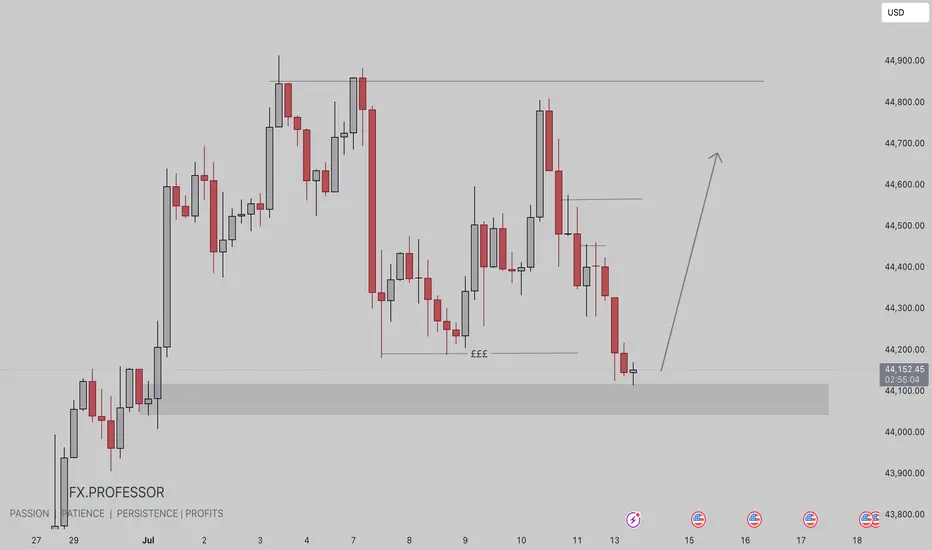
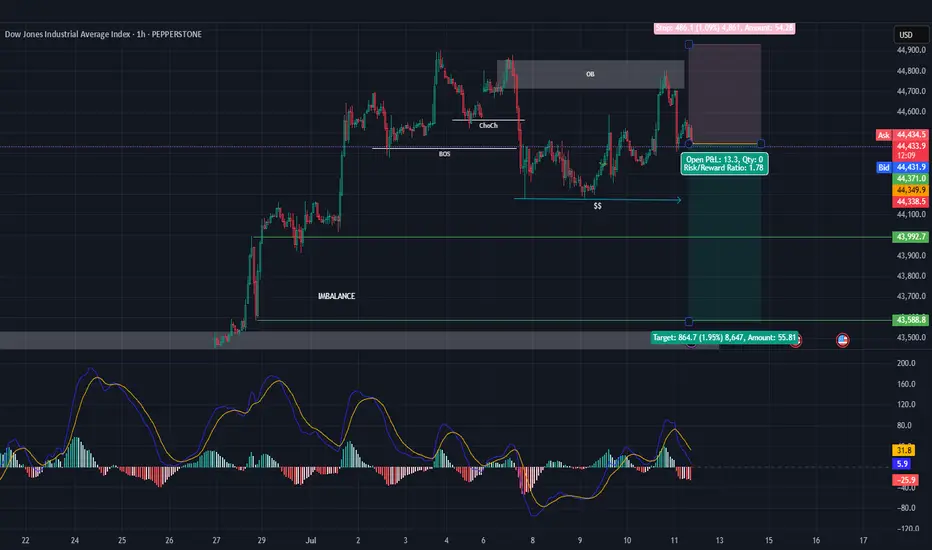
US30 BUY IDEA • Extreme Demand Zone Entry:
Price has cleanly tapped into a refined demand zone between ~44,050 to 43,994, a prime area for institutional entries. This aligns with a previous accumulation zone from late June.
• Triple Equal Lows (₤₤₤) Swept:
Clear liquidity grab beneath the equal lows, suggesting SMC-style inducement to fuel bullish orders.
• High R:R Setup in Play:
The long setup offers an expansive upside toward the 44,851 level — representing a premium retracement zone, inefficiency fill, and possible internal BOS confirmation.
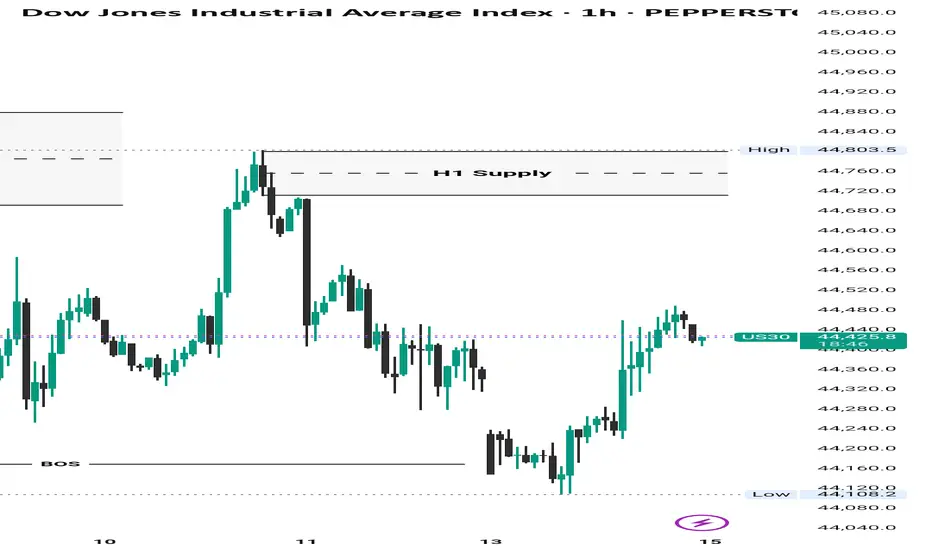
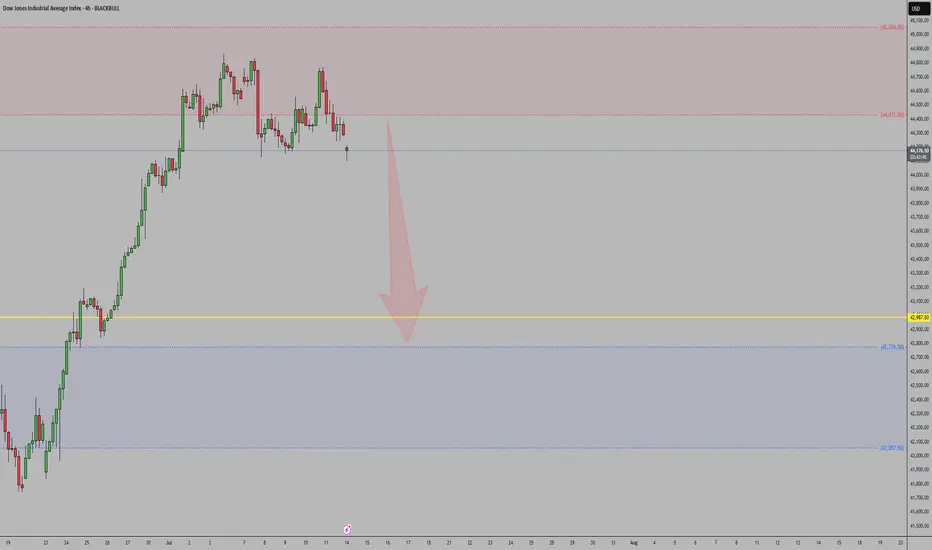
US30Net long positions are decreasing, signaling that institutional speculators are reducing exposure.
Commercials are increasing short positions, suggesting smart money expects downside in US equities.
Price rejected strongly from a weekly supply zone, failing to break previous highs.
A bearish break of structure (BOS) has occurred, with price forming a lower high and lower low pattern.
This aligns with broader macro conditions (stronger USD, rising yields).
Bias remains bearish — looking to sell pullbacks into premium zones or supply areas.
US30 prepare for the bullish 1. there is double bottom at 44152 level, i will tend to wait for the sweep meaning the price go down and hit the 4hr order block.
2. wait for 15m/ 30m TF a strong bullish momentum.
3. retest the 44152 around level or 0.618 to enter the market to long
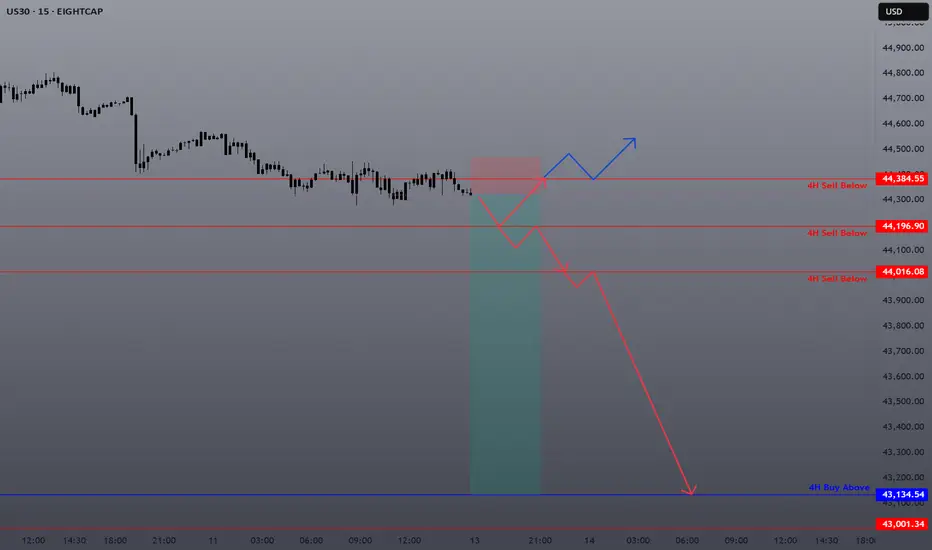
US30 Sell continuationUS 30 appears to be running SSL. 4H levels identified. Looking for Break & retest. If support does not hold on to any level, expect the bulls to return and take over.
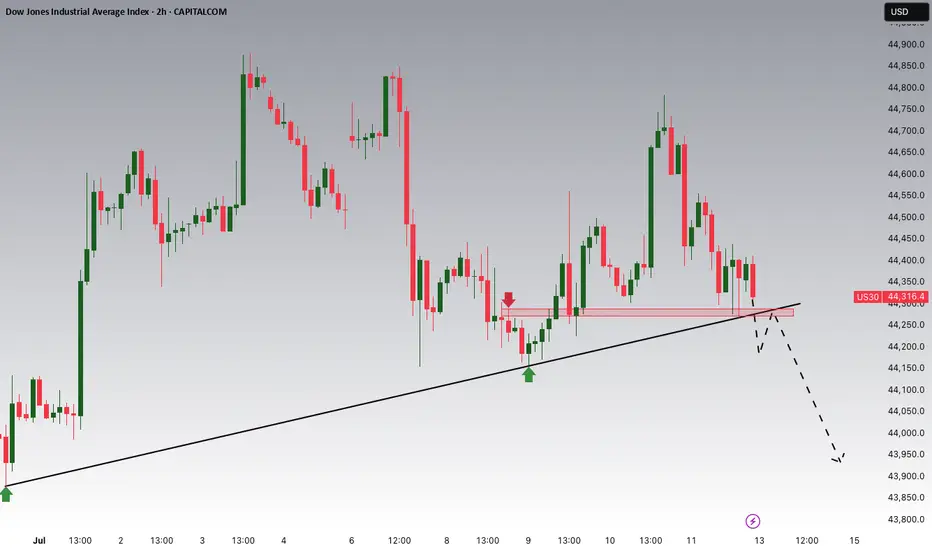
Dow Jones Potential DownsidesHey Traders, in the coming week we are monitoring US30 for a selling opportunity around 44,270 zone, US30 is trading in an uptrend and currently seems to be attempting to break it down, if we get dips below the trend we will be looking for a potential retrace towards further downsides.
Trade safe, Joe.
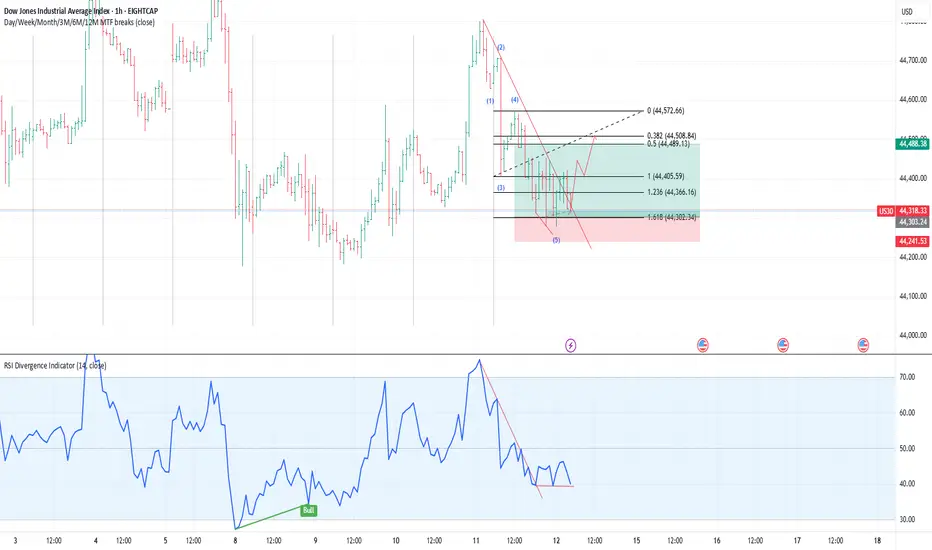
US30SIGNAL: BUY
A) SETUP: B (h1 wave5 to Correction)
B) CONFIRMATION:
1) SBT: done
2) RSI DIVERGENCE: done
3) MOMENTUM CANDLE: done
C) RR = 1:3
US30 TradeA dip into my point of interest to clear liquidity resting there will trigger our long trade scenario
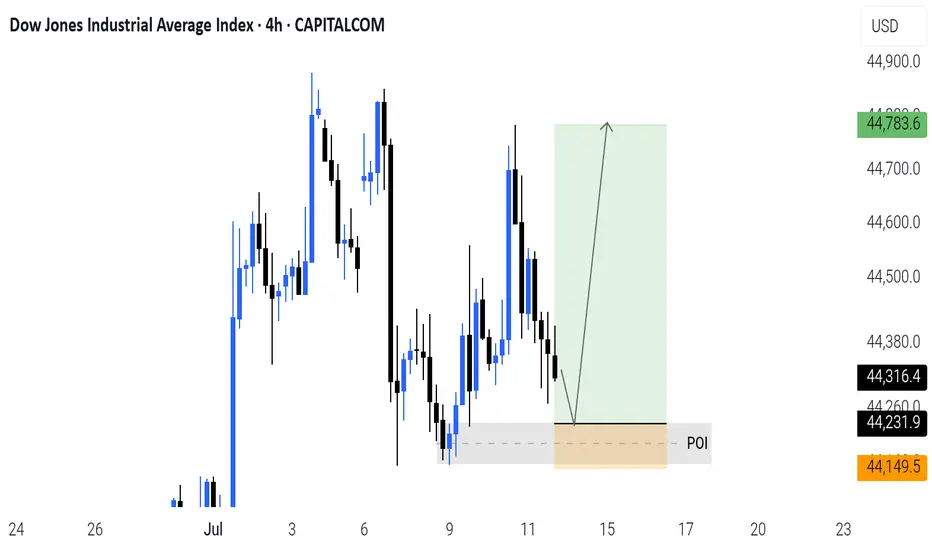
US30 BUY IDEA🔍 Key Technical Highlights:
• Demand Zone Entry:
• Price tapped into a strong demand zone (gray box) around 44,280 – 44,330, signaling potential institutional buying interest.
• Liquidity Grab:
• Sell-side liquidity has been swept just below the previous lows, which aligns with a classic SMC liquidity manipulation before a bullish move.
• Projected Market Structure Shift:
• Price is forming a higher low, hinting at a potential reversal and bullish BOS (Break of Structure).
• Expecting a multi-leg bullish move, targeting 44,812 area, filling imbalance and reaching premium zones.
• Risk-Reward Outlook:
• Stop loss placed just below the demand zone.
• Take profit aligned with previous highs and inefficiency zone — a favorable R:R ratio for swing traders.
⸻
🧠 Smart Money Narrative:
1. Sweep of liquidity below demand.
2. Institutional buy orders triggered.
3. Low-risk buy opportunity with clear internal structure shift.
4. Bullish continuation toward premium pricing and unfilled imbalances.

DowJones bullish breakout retest?Key Support and Resistance Levels
Resistance Level 1: 45000
Resistance Level 2: 45445
Resistance Level 3: 46000
Support Level 1: 44000
Support Level 2: 43700
Support Level 3: 43430
This communication is for informational purposes only and should not be viewed as any form of recommendation as to a particular course of action or as investment advice. It is not intended as an offer or solicitation for the purchase or sale of any financial instrument or as an official confirmation of any transaction. Opinions, estimates and assumptions expressed herein are made as of the date of this communication and are subject to change without notice. This communication has been prepared based upon information, including market prices, data and other information, believed to be reliable; however, Trade Nation does not warrant its completeness or accuracy. All market prices and market data contained in or attached to this communication are indicative and subject to change without notice.

Do you agree with a big profit in US30?
Hello friend
Do you think the orange line will break?
What if it breaks?
Just wait and collect the money.
If you liked my analysis, please support me by liking, commenting and subscribing. Thanks friend

US30 Market Recap – 07/11/2025📍 US30 Market Recap – 07/11/2025
Another range-bound day on US30 as price continues to chop between key zones. Bulls pushed into 44,700, but failed to hold gains. We’re now sitting near the mid-range, and market indecision is growing 🤔
📊 Current Structure:
Range: 44,220 (support) ↔️ 44,867 (resistance)
Mid-range: 44,500 zone acting as key pivot
EMA structure still mixed: 20 EMA trying to cross back above 50 EMA
Lower highs building since last test of 44,867 = signs of seller presence
🔑 Key Levels:
🔼 Resistance: 44,701 → 44,867
🔽 Support: 44,260 → 44,220
⚠️ Mid-zone chop: 44,400–44,500 (avoid fomo entries here)
💡 Trade Setup Ideas:
🔻 Short Setup (If rejection holds below 44,500):
Entry: Rejection candle or break/retest under 44,400
TP1: 44,260
TP2: 44,100
SL: Above 44,600
🔼 Long Setup (Only above 44,700 reclaim):
Entry: Strong close + retest above 44,700
TP: 44,867 highs
SL: Below 44,500
🚫 NO-TRADE ZONE: 44,350–44,500 chop range = indecision zone ⚠️
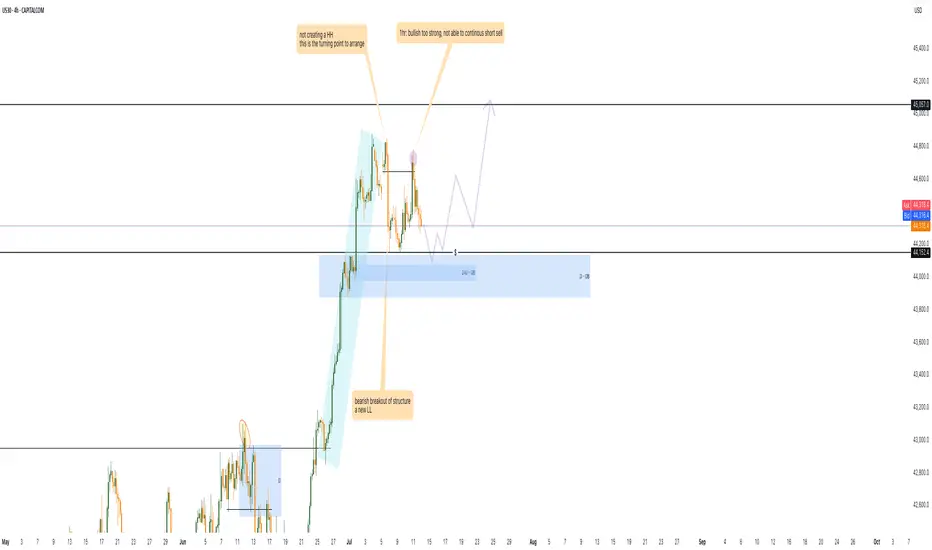
US30 - Short SellThe Dow Jones aka US30
* Overall trend is bullish
* Currently trading the retracement with the following points.
1. Valid OB
2. Liquidity to the sell side
3. Imbalance to the sell side
4. Price failed to break the previous HH activating the Bear positions, the question is How Deep The Retracement Will Be ? So we are closely monitoring the price action to adjust at any changes that the market might face.
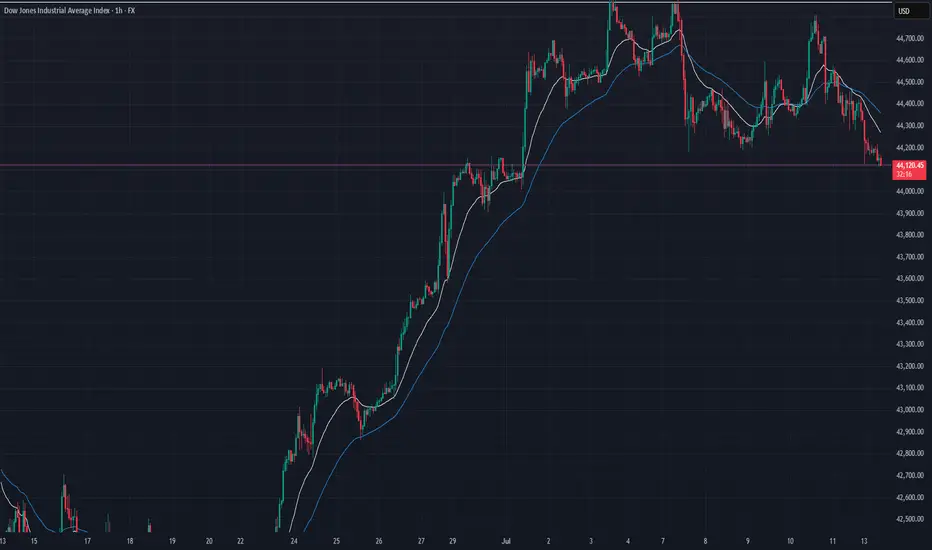
US30 - medium to long term opportunity setting upHello,
The US30 futures are forming a bullish pattern, signaling potential upside. The MACD and moving averages align, presenting a compelling opportunity for buyers.
Investors should note President Trump's aggressive push for Federal Reserve Chair Powell to cut interest rates, including threats to dismiss him if he resists. While this rhetoric could unsettle markets, we believe Trump is unlikely to follow through, as markets have likely found a bottom and he would avoid actions that could trigger a downturn.
Technical analysis supports early entry for bold investors, with a stop-loss placed below the recent low. Proceed with caution and good luck.
Disclosure: I am part of Trade Nation's Influencer program and receive a monthly fee for using their TradingView charts in my analysis.

US30 H4 I Bearish Reversal Based on the H4 chart, the price is approaching our sell entry level at 44576.41, a pullback resistance.
Our take profit is set at 44162.08, an overlap support.
The stop loss is set at 44922.32, a swing high resistance.
High Risk Investment Warning
Trading Forex/CFDs on margin carries a high level of risk and may not be suitable for all investors. Leverage can work against you.
Stratos Markets Limited (tradu.com ):
CFDs are complex instruments and come with a high risk of losing money rapidly due to leverage. 63% of retail investor accounts lose money when trading CFDs with this provider. You should consider whether you understand how CFDs work and whether you can afford to take the high risk of losing your money.
Stratos Europe Ltd (tradu.com ):
CFDs are complex instruments and come with a high risk of losing money rapidly due to leverage. 63% of retail investor accounts lose money when trading CFDs with this provider. You should consider whether you understand how CFDs work and whether you can afford to take the high risk of losing your money.
Stratos Global LLC (tradu.com ):
Losses can exceed deposits.
Please be advised that the information presented on TradingView is provided to Tradu (‘Company’, ‘we’) by a third-party provider (‘TFA Global Pte Ltd’). Please be reminded that you are solely responsible for the trading decisions on your account. There is a very high degree of risk involved in trading. Any information and/or content is intended entirely for research, educational and informational purposes only and does not constitute investment or consultation advice or investment strategy. The information is not tailored to the investment needs of any specific person and therefore does not involve a consideration of any of the investment objectives, financial situation or needs of any viewer that may receive it. Kindly also note that past performance is not a reliable indicator of future results. Actual results may differ materially from those anticipated in forward-looking or past performance statements. We assume no liability as to the accuracy or completeness of any of the information and/or content provided herein and the Company cannot be held responsible for any omission, mistake nor for any loss or damage including without limitation to any loss of profit which may arise from reliance on any information supplied by TFA Global Pte Ltd.
The speaker(s) is neither an employee, agent nor representative of Tradu and is therefore acting independently. The opinions given are their own, constitute general market commentary, and do not constitute the opinion or advice of Tradu or any form of personal or investment advice. Tradu neither endorses nor guarantees offerings of third-party speakers, nor is Tradu responsible for the content, veracity or opinions of third-party speakers, presenters or participants.

US30 Local Short!
HI,Traders !
US30 index is moving in a sideways
movement Over the medium term down
Again and will soon hit
A horizontal support
Of 44482.4 from where
We will be expecting a
Local bullish rebound !
Comment and subscribe to help us grow !

Us30 h4 next move Rejection near BoS
2. Break below support zone
3. Lower high formation
4. Bearish continuation towards 43,250
