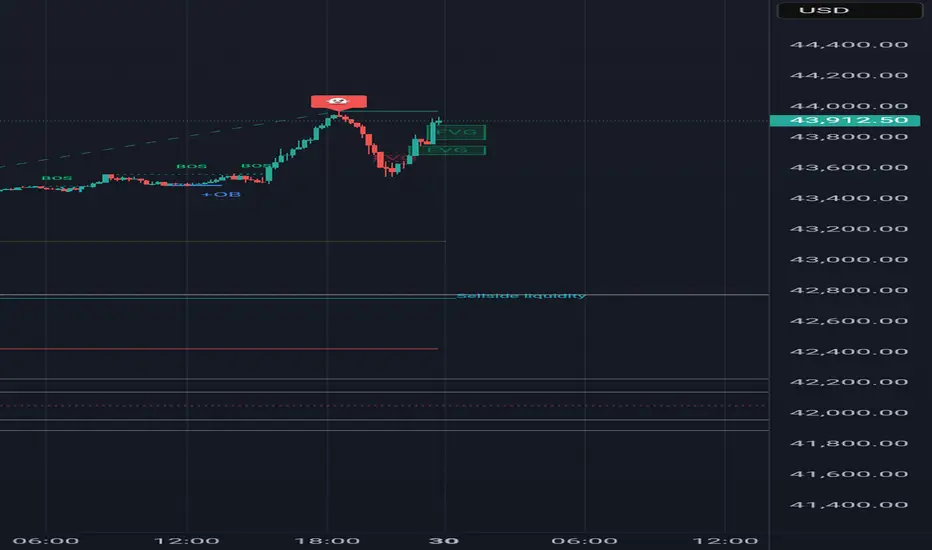
US30 Scalp Buy SetupIf upside liquidation taken first before the entry is achieved then don't take the entry, wait for the entry and set tp & relax.
DJ30FT trade ideas

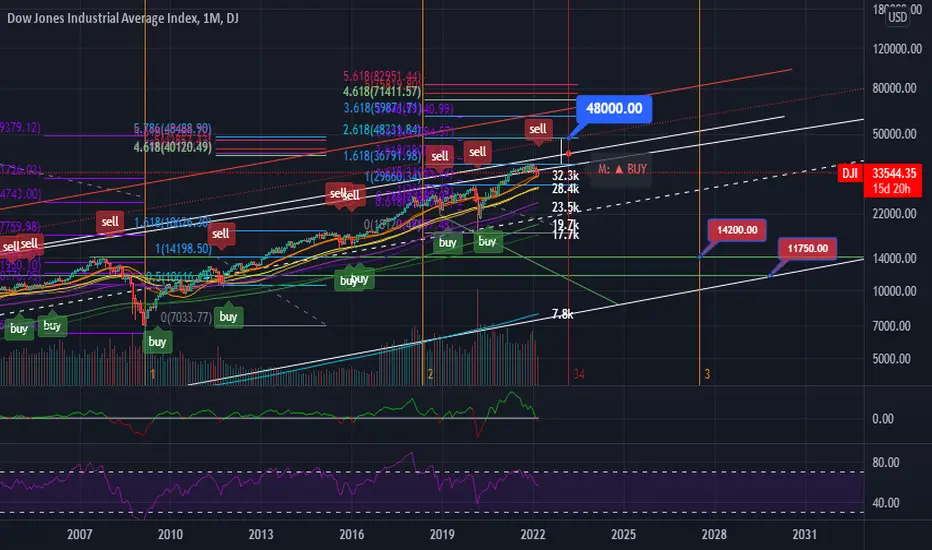
Dow Jones (DJI) Logarithmic Macro Outlook Log target: 48k
The dotted red line is adjusted for inflation. The stock market cycles are lengthening. Continued downside till EOM followed by a final melt-up rally that will bring the end of grand wave 5.
ETA: Q1 '23.
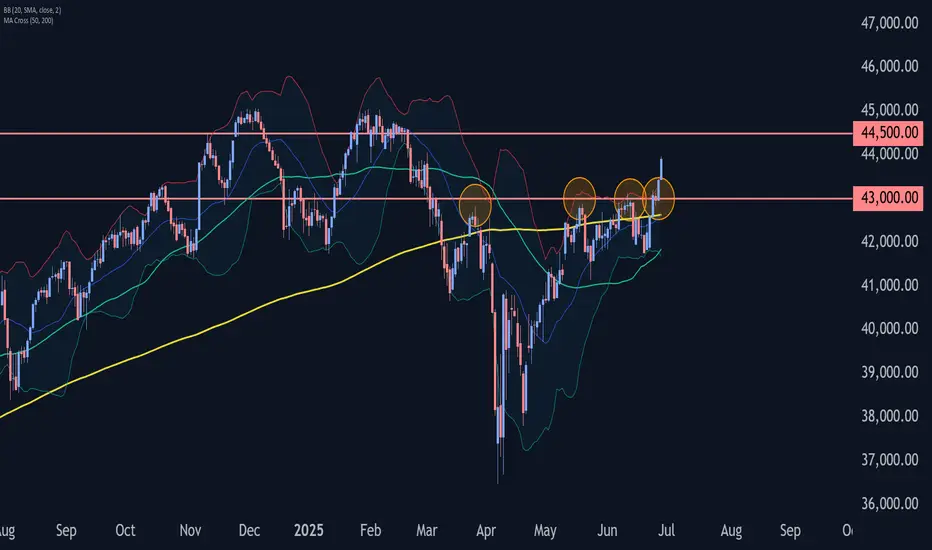
Dow Jones - Volatility is HighLevels mentioned here are based on the market volatility and it is purely for the study purpose only.
US30 (DOW JONES) 4H – Bullish Breakout BUY Setup
US30 (Dow Jones Industrial Average) is pushing higher, breaking through previous resistance levels. Price is now trading at 44,586.48, confirming strong bullish momentum after reclaiming the 44,000 psychological zone.
We remain bullish — looking for continuation of this breakout.
---
BUY Trade Setup:
🔵 Buy Limit: 44,500.00 – 44,520.00
🛑 Stop Loss: 44,400.00
🎯 Take Profit 1: 44,750.00
🎯 Take Profit 2: 45,000.00
---
Why Buy?
✅ Clear bullish market structure.
✅ Price consolidating after breakout — healthy sign for continuation.
✅ Smart Money likely accumulating for next leg up.
We ride with momentum — no reason to fight the trend.
---
Summary:
Bias: BUY ONLY 🔥
Setup: Wait for price to retest 44,500 – 44,520 zone, look for rejection, then enter.
Risk Management: Respect SL — trade with discipline.
---
💬 Are you buying US30 too? Let me know your setup below!
#US30 #DowJones #Indices #TradingView #BuySetup #SmartMoney #FrankFx14

Dow’s fighting hard for that breakoutDow Jones is moving within a bullish channel
with low selling pressure —
strong legs pushing toward the top.
I’m expecting another solid bullish leg.
BLACKBULL:US30

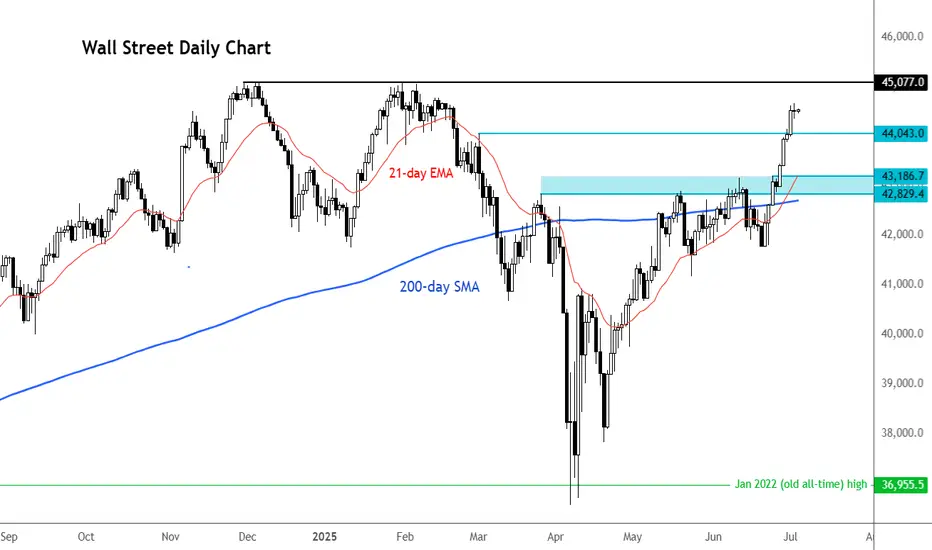
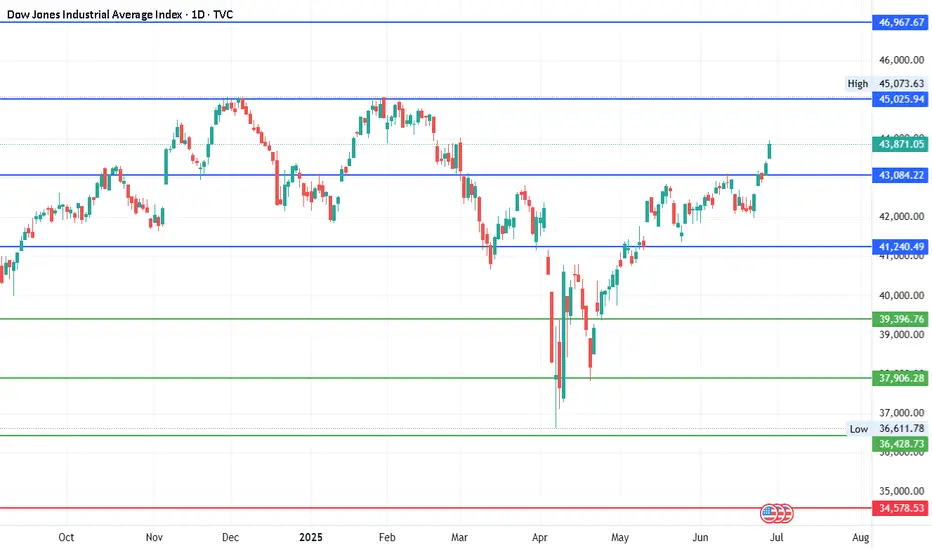
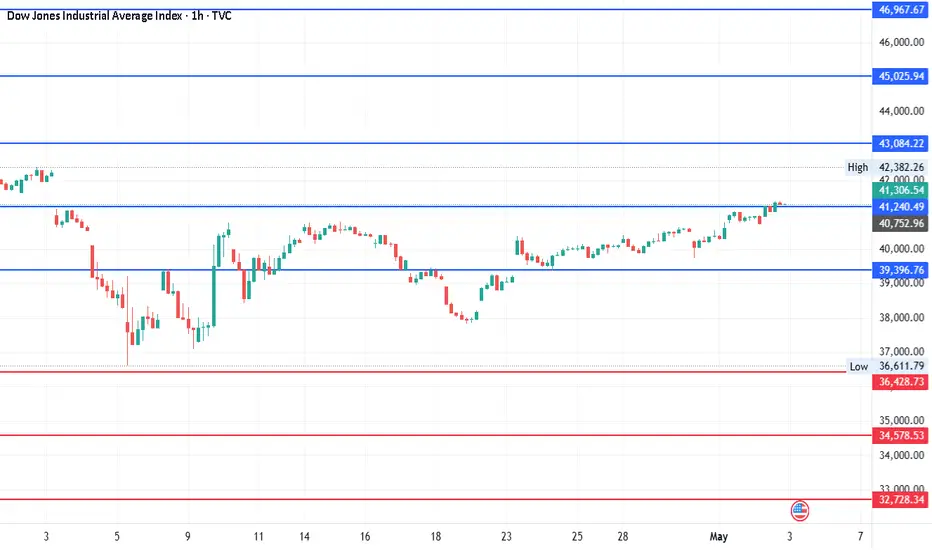
Can Dow hit new highs?While the likes of the S&P 500 and Nasdaq 100 are already record highs, the Dow has not achieved that target yet. It continues to make higher highs and higher lows, and the momentum seems to be getting stronger. Soon, it may even flirt with fresh all-time highs, as investors ride the tailwinds of a robust rally that kicked off in early April. There have been a few catalysts behind this rally. First, it was Trump hitting pause on reciprocal tariffs; then, a wave of optimism washed over markets following a sudden de-escalation in the Middle East. The bulls took charge, and markets haven’t looked back since. But with 4 July celebrations on the doorstep and Wall Street due to close at 1pm NY time, today’s shortened session has a singular focus: the all-important US non-farm payrolls report. Will we have enough time to see the Dow march to new highs? The key levels are marked on the chart.
By Fawad Razaqzada, market analyst with FOREX.com
US30 buy(low probability because of low volatility)Weekly candle formation: OHLC/OLHC
Structure>liquidity>orderblock!
Bullish structure
Internal liquidity
Orerblock pojnt of interest.

US30 Technical Outlook – 07/03/2025📍 US30 Technical Outlook – 07/03/2025
Another day of consolidation at the highs 💼⏳
Price is holding firmly above both EMAs (20 & 50), showing sustained bullish structure—but struggling to break cleanly above 44,700–44,760 🧱
🧠 Key Observations:
Tight consolidation between 44,500 → 44,700
Strong bounce off EMA zones (44,500 area acting as dynamic support)
Still no confirmed breakout of the 44,760 top range
📊 Key Price Zones:
🔼 Resistance: 44,708 → 44,762 → 45,000
🔽 Support: 44,500 → 44,250 → 44,000
📈 Trade Setup Ideas:
🔹 Long Setup (Base case):
Buy pullbacks to 44,500 or EMA zone (20 & 50 EMA support)
Look for a breakout and retest of 44,760 for confirmation
Target: 45,000 psychological zone
🔻 Short Setup (Only on breakout failure):
Look for rejection wicks or bearish engulfing at 44,760
Scalp back toward 44,500 or lower
Only valid if volume drops off or price starts forming LHs/LLs on lower TFs

US30 Scalp short Swing failure patternSwing failure pattern with bearish FVG, wait for bearish candle confirmation, liquidity below

Possibility of uptrend It is expected that after some fluctuation and correction, the resistance area will be broken and the upward trend will continue. If the index crosses the green support area, a downward trend to the specified support levels will be possible.

US30 Technical Outlook – 07/02/2025📍 US30 Technical Outlook – 07/02/2025
The bull train keeps rolling! 🚂 Price smashed through the 44,250 resistance level and is now testing the next major zone at 44,700 → 44,760 🔥
🧠 Key Observations:
Price has extended way above the EMAs ✅
EMAs (44,266 and 44,496) still pointing sharply upward ✅
Market consolidating right under 44,760 resistance 📍
📊 Key Price Zones:
🔼 Resistance: 44,700 → 44,760 → 45,000
🔽 Support: 44,500 → 44,250 → 44,000
📈 Trade Setup Ideas:
🔹 Long Bias (Still favored trend-side):
Wait for pullbacks toward 44,500 → 44,250
Buy dips with bullish confirmation patterns (engulfing, pin bars, EMA support hold) ✅
Target: 44,760 → 45,000
🔻 Short Bias (Countertrend – Only on rejection!):
Watch for rejection wicks or bearish reversal setups from 44,700–44,760
Could target quick flush down to 44,500 → 44,250 support
⚠️ Important: Price has been parabolic, so chasing here is dangerous. Wait for clear setups, either dip buys or high-timeframe rejection.

US30 Sell analysis/ideaThis analysis is based on multiple timeframes and executed using reversal trading and trend formation. complete explanation in the video!

Dow Jones Wave Analysis – 1 July 2025
- Dow Jones broke the resistance zone
- Likely to rise to resistance level 45000.00
Dow Jones index recently broke the resistance zone located at the intersection of the resistance level 44000.00 (former top of wave iv from March) and the resistance trendline of the daily up channel from May.
The breakout of this resistance zone accelerated the active impulse wave (3) – which is part of the multi-month upward ABC correction 2 from April.
Dow Jones index can be expected to rise to the next resistance level 45000.00 (target price for the completion of the active impulse wave (C)).

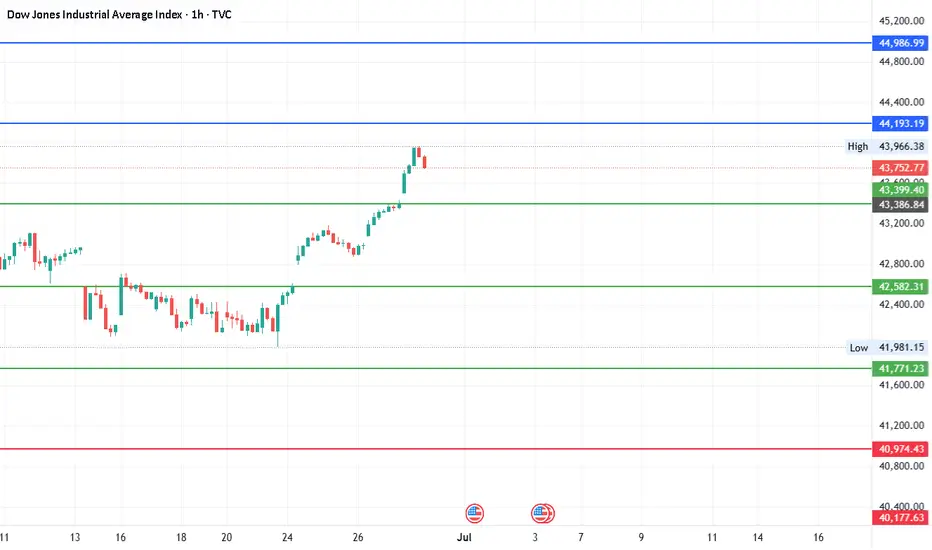
#DJI - Pivot is 42582.31 | Target 38374.12 or 46790.50?Date: 27-06-2025
This is in continuation with the previous post of 8000 points target. We have a new pivot point for the next move.
#Dow Jones Current Price: 43880.
Pivot Point: 42582.31 Support: 41771.23 Resistance: 43399.40
#Dow Jones Upside Targets:
Target 1: 44193.19
Target 2: 44986.99
Target 3: 45888.75
Target 4: 46790.50
#Dow Jones Downside Targets:
Target 1: 40974.43
Target 2: 40177.63
Target 3: 39275.875
Target 4: 38374.12
US30: Bears Are Winning! Short!
My dear friends,
Today we will analyse US30 together☺️
The market is at an inflection zone and price has now reached an area around 44,041.6 where previous reversals or breakouts have occurred.And a price reaction that we are seeing on multiple timeframes here could signal the next move down so we can enter on confirmation, and target the next key level of 44,013.0..Stop-loss is recommended beyond the inflection zone.
❤️Sending you lots of Love and Hugs❤️

US30 Technical Outlook – 07/01/2025📍 US30 Technical Outlook – 07/01/2025
Monster rally continues! 🚀 Price exploded off the 42,100–42,200 demand zone and has now pushed deep into the 44,150–44,250 major resistance area.
🧠 Key Observations:
Trend remains extremely bullish ✅
Price is consolidating just under 44,250 resistance 📍
EMAs (43,894 and 44,052) still showing strong upward momentum ✅
📊 Key Price Zones:
🔼 Major Resistance: 44,150 → 44,250 → 44,400
🔽 Key Support: 43,800 → 43,600 → 43,400
📈 Trade Setup Ideas:
🔹 Long Bias:
Pullbacks into 43,800 → 43,600 support
Look for bullish continuation setups if price stays above EMAs
Target: Breakout toward 44,250 → 44,400
🔻 Short Bias (Countertrend / Caution):
Only look for short scalps if price gives clear rejection (wicks, bearish engulfing, etc) from 44,250–44,400 zone
Possible downside target: 43,800–43,600

Look into it{
"alerts": [
{
"name": "US30 Bull Break",
"condition": {
"symbol": "US30",
"operator": "crossing",
"value": 43950
},
"message": "📈 US30 Breakout Alert: Price crossed above 43,950. Watch for BUY setup targeting 44,100.",
"actions":
},
{
"name": "US30 Bear Rejection",
"condition": {
"symbol": "US30",
"operator": "crossing_down",
"value": 43800
},
"message": "📉 US30 Bearish Rejection: Price fell below 43,800. Watch for SELL setup toward 43,400 OB.",
"actions":
}
]
}
Weekly Forex Outlook Sun.June.29.2025 - Fri.July.4.2025Like and Comments would be appreciated :D Not Financial Advice, Just my outlook/opinion

Dow Jones Wave Analysis – 27 June 2025
- Dow Jones broke pivotal resistance level 43000.00
- Likely to rise to resistance level 44500.00
Dow Jones index recently broke above the pivotal resistance level 43000.00 (which has been reversing the price from the end of March, as can be seen from the daily Dow Jones chart below).
The breakout of the resistance level 43000.00 accelerated the active impulse wave 3 of the intermediate impulse wave (C) from the end of May.
Dow Jones index can be expected to rise to the next resistance level 44500.00, which is the target price for the completion of the active impulse wave (C).
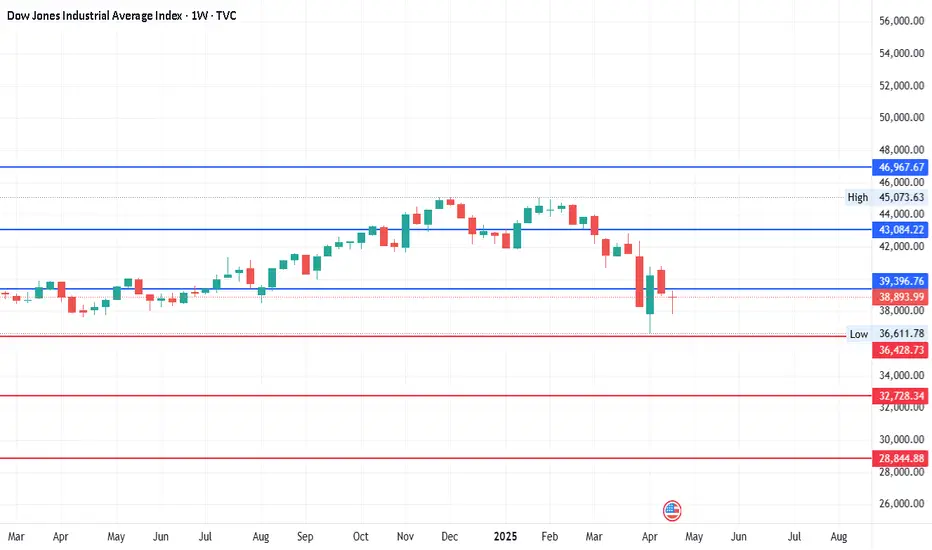
#DJI - 5000 Pts already moved out of 8000 points..Date: 27-06-2025
#DJI - 5000 Pts already moved out of 8000 points as posted on 22nd April. Another 3000 points to cover. we have different pivot for the next level up and it will be shared soon.
Old levels are as follows.
#DJI Upside Targets: 41240.49, 43084.22, 45025.94 and 46967.67
#DJI Downside Targets: 34578.53, 32728.34, 30786.61 and 28844.88
Current price is around 43,870 at the time of this post.
DJI - 2000 pts already moved out of 8000 pts since last posted?It has already moved around 2000 points since last posted on 22nd April. Expecting around 8000 points moved as per mentioned earlier and the levels are still the same. Introduced additional levels for the better understanding. So, another 6000 points move pending before any reasonable correction? let's see.
Upside: 41240.49, 43084.22, 45025.94 and 46967.67
Downside: 34578.53, 32728.34, 30786.61 and 28844.88
#US30 Buy 43575.4#US30 Buy 43575.4
SL 43515.4
TP 43595.4
TP 43675.4
TP 43815.4
Trade at your own risk
Protect your capital
The Wizard 🧙♂️ SWFX

DOW JONES Will Keep Growing! Buy!
Hello,Traders!
US30 is trading in an
Uptrend and the index broke
The key horizontal level
Around 43,200 and the
Breakout is confirmed so
We are bullish biased
And we will be expecting a
Further bullish move up
Buy!
Comment and subscribe to help us grow!
Check out other forecasts below too!
Disclosure: I am part of Trade Nation's Influencer program and receive a monthly fee for using their TradingView charts in my analysis.
