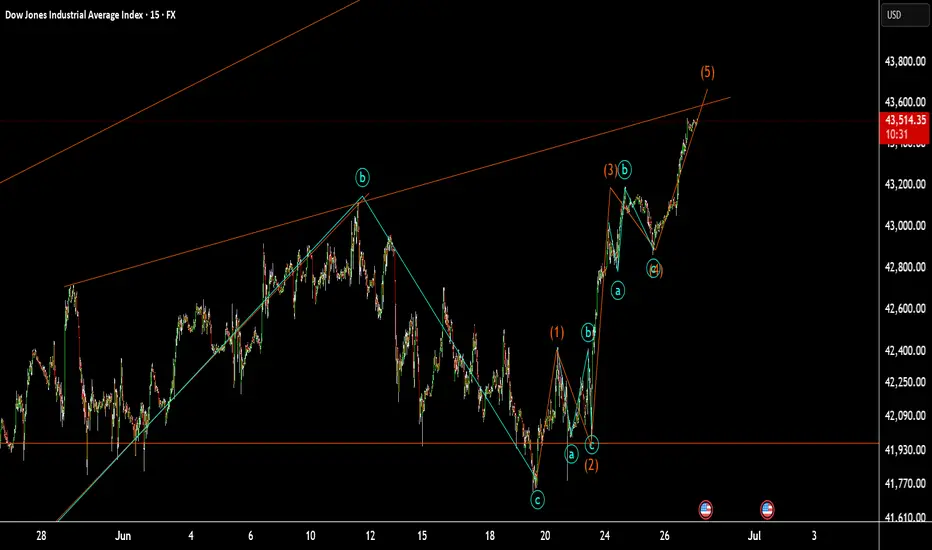
US30 at small resistanceUS30 at small resistance:
as I counter these wave we are in wave 5. it might be goes up to the maim trend Line in previous analysis.
DJ30FT trade ideas
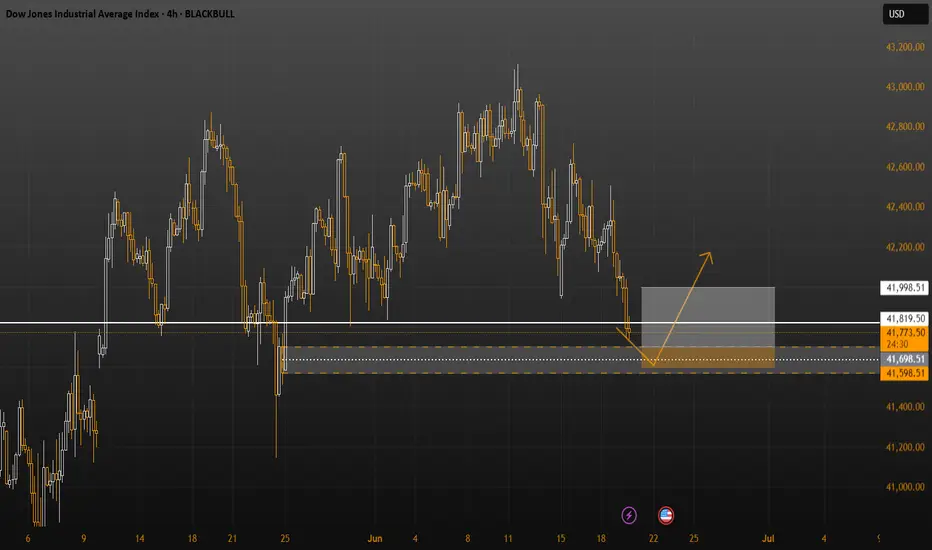
The Dow Jones index is at the channel’s ceiling.The Dow Jones index, upon reaching the channel’s ceiling, shows weakness and lacks the ability to break out from a price action and candlestick perspective. I expect the price to reach near the channel’s floor in a downward trend.
17:30
BLACKBULL:US30

Dow Jones Industrial Average Index - 4h Chart (FOREXCOM)4-hour chart of the Dow Jones Industrial Average Index (US30) shows the price movement from late June to early July 2025. The current value is 43,057.7, reflecting a slight increase of +78.0 (+0.18%). The chart highlights key price levels, including a resistance zone around 43,324.1 and a support zone near 42,875.8, with recent price action showing a breakout above the resistance level.


Dow Jones Entryprice already was reacting off of a Order Block formed on the one hour, so i got down to the m5 and started searching for an entry, unluckily i lost the good one but there is still the possibility to do something good and safe like this.

US30 Technical Outlook – 06/25/2025📍 US30 Technical Outlook – 06/25/2025
Big move! 🚀 Price broke out of the 42,054–42,100 consolidation and rallied aggressively into the key 43,100–43,150 resistance zone.
🧠 Key Observations:
Clean bullish breakout above 42,100 ✅
Price now sitting at 43,120–43,150 supply 🛑
EMAs sharply turned bullish (42,808 and 43,038 levels)
📊 Key Price Zones:
🔼 Major Resistance: 43,150 → 43,300
🔽 Support: 42,800 → 42,600 → 42,100
📈 Trade Setup Ideas:
🔹 Long Bias:
Pullback into 42,800–42,600 support
→ Look for bullish structure & continuation signals
→ Target: 43,150 → 43,300
🔻 Short Bias:
Look for strong rejection candles at 43,150–43,300
→ Intraday scalp short back toward 42,800
→ Break below 42,800 could target 42,600 or even 42,100
‼️ Momentum is clearly bullish for now, but this is a major supply zone so caution on chasing late longs.

US30: The Market Is Looking Up! Long!
My dear friends,
Today we will analyse US30 together☺️
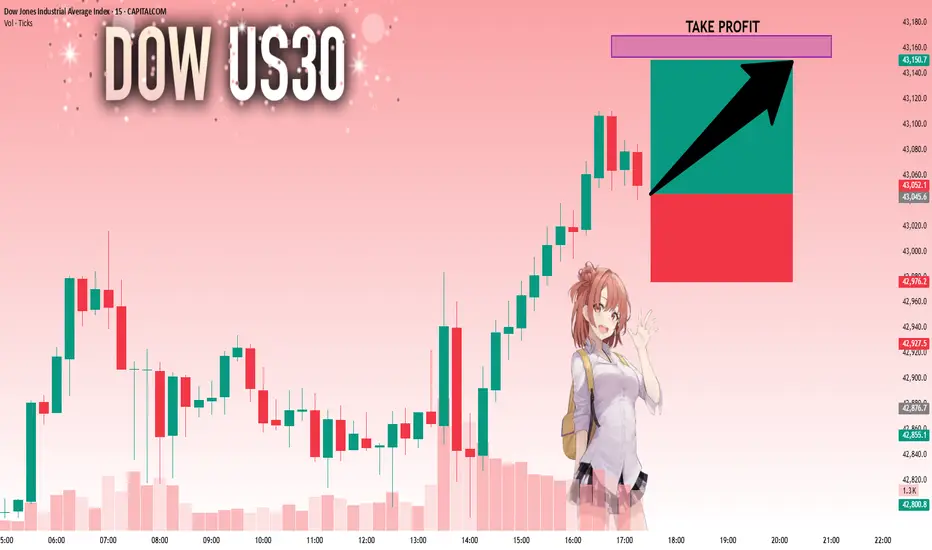
The price is near a wide key level
and the pair is approaching a significant decision level of 43,045.6 Therefore, a strong bullish reaction here could determine the next move up.We will watch for a confirmation candle, and then target the next key level of 43,152.9.Recommend Stop-loss is beyond the current level.
❤️Sending you lots of Love and Hugs❤️
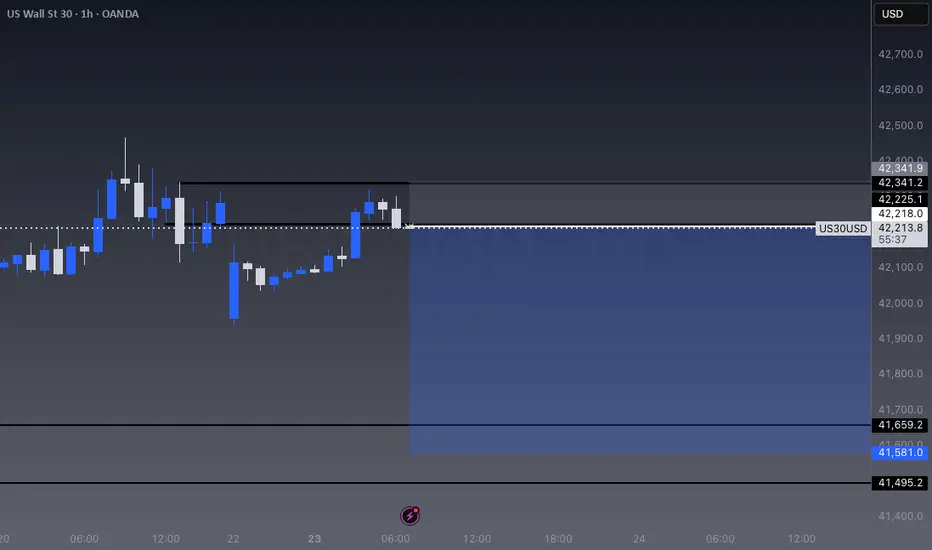
US30 H4 I Bullish Bounce Based on the H4 chart analysis, the price is falling toward our buy entry level at 42,333.01, a pullback support.
Our take profit is set at 42,981.24, a swing high resistance.
The stop loss is placed at 41,803.95, below the 38.2% Fib retracement.
High Risk Investment Warning
Trading Forex/CFDs on margin carries a high level of risk and may not be suitable for all investors. Leverage can work against you.
Stratos Markets Limited (tradu.com ):
CFDs are complex instruments and come with a high risk of losing money rapidly due to leverage. 63% of retail investor accounts lose money when trading CFDs with this provider. You should consider whether you understand how CFDs work and whether you can afford to take the high risk of losing your money.
Stratos Europe Ltd (tradu.com ):
CFDs are complex instruments and come with a high risk of losing money rapidly due to leverage. 63% of retail investor accounts lose money when trading CFDs with this provider. You should consider whether you understand how CFDs work and whether you can afford to take the high risk of losing your money.
Stratos Global LLC (tradu.com ):
Losses can exceed deposits.
Please be advised that the information presented on TradingView is provided to Tradu (‘Company’, ‘we’) by a third-party provider (‘TFA Global Pte Ltd’). Please be reminded that you are solely responsible for the trading decisions on your account. There is a very high degree of risk involved in trading. Any information and/or content is intended entirely for research, educational and informational purposes only and does not constitute investment or consultation advice or investment strategy. The information is not tailored to the investment needs of any specific person and therefore does not involve a consideration of any of the investment objectives, financial situation or needs of any viewer that may receive it. Kindly also note that past performance is not a reliable indicator of future results. Actual results may differ materially from those anticipated in forward-looking or past performance statements. We assume no liability as to the accuracy or completeness of any of the information and/or content provided herein and the Company cannot be held responsible for any omission, mistake nor for any loss or damage including without limitation to any loss of profit which may arise from reliance on any information supplied by TFA Global Pte Ltd.
The speaker(s) is neither an employee, agent nor representative of Tradu and is therefore acting independently. The opinions given are their own, constitute general market commentary, and do not constitute the opinion or advice of Tradu or any form of personal or investment advice. Tradu neither endorses nor guarantees offerings of third-party speakers, nor is Tradu responsible for the content, veracity or opinions of third-party speakers, presenters or participants.

US30 | FLUSHPOINTto keep it simple we missed our first trade on US30 due to the open gap
therefore we are attempting to re-enter trade as we a back at our POI

US30 Sell IdeaWe see price beginning to downtrend forming LL & LH. We also see price beginning to get closer to our daily low. Now we enter off of the 2nd mitigation of the bearish engulfing located at our point of interest on the 1hr. Really nice signature setup here. Overall I feel good I really took my time finding this setup!
US30 H4 AnalysisUS30 Showing a bullish Flag to 42,762. If it breaks this zone, Most probably can fly upto 44,000 and higher. Trading Analysis from 23-06-25 to 27-06-25. Take your risk under control and wait for market to break support or resistance on smaller time frame. Best of luck everyone and happy trading.🤗

Weekly Forex Outlook Sun.June.15.2025 - Fri.June.20.2025Like and Comments would be appreciated :D Not Financial Advice, Just my outlook/opinion

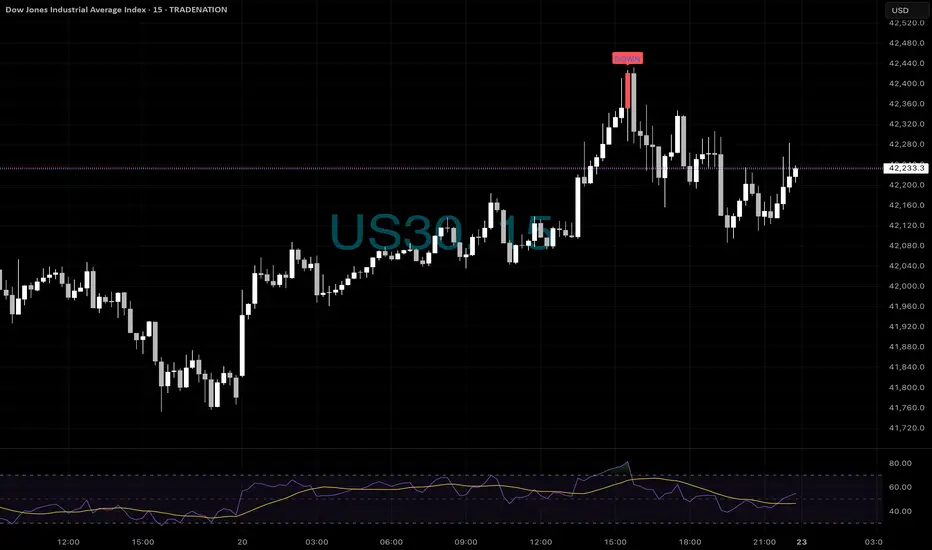
DOW - Shorts as well📉 US30 Top Called to the Point – Friday 15min Reversal
It doesn’t get much cleaner than this.
Our ELFIEDT – X-REVERSION system printed a precise “DOWN” signal right as price exhausted into its session high.
That wasn’t guesswork — it was quantified mean reversion + RSI divergence, confirming loss of momentum at a stretched level.
💡 Look below: RSI divergence already warned us…
💣 Add our signal = high-confidence short with a defined stop just above the bar.
🧠 This is what happens when price structure, statistics, and momentum all agree — you get in where it matters.
📲 Want to trade smarter and get setups like this in real time?
Message us now to start using our indicator suite — it’s already helping traders catch tops, bottoms, and reversals with confidence.
⸻
#US30 #DowJones #TopReversal #ELFIEDT #TradeSmarter #TechnicalAnalysis #PriceActionSignals #ReversionTrading #ShortSetup #MomentumTrading #RSIDivergence #TradingViewIndicators #ProfitFromPrecision #XReversionTool
DJI SELLING BIAShello guys,
this is how i gonna act. upcoming months we can see downside in dow jones.
please keep in mind that trading is a risky so act wisely!


DowJones bullish consolidation supported at 41800Key Support and Resistance Levels
Resistance Level 1: 42890
Resistance Level 2: 43540
Resistance Level 3: 43940
Support Level 1: 41800
Support Level 2: 41400
Support Level 3: 41100
This communication is for informational purposes only and should not be viewed as any form of recommendation as to a particular course of action or as investment advice. It is not intended as an offer or solicitation for the purchase or sale of any financial instrument or as an official confirmation of any transaction. Opinions, estimates and assumptions expressed herein are made as of the date of this communication and are subject to change without notice. This communication has been prepared based upon information, including market prices, data and other information, believed to be reliable; however, Trade Nation does not warrant its completeness or accuracy. All market prices and market data contained in or attached to this communication are indicative and subject to change without notice.

US30 Under Pressure as Geopolitical Risks Drive VolatilityUS30 – Technical Overview
Dow Jones (US30) futures are trading lower amid escalating tensions in the Middle East, with markets closely monitoring any potential U.S. response that could significantly sway sentiment.
⚠️ Volatility remains elevated, and traders should remain cautious ahead of potential geopolitical developments.
US30 continues to trade below the key level at 42160, maintaining a bearish bias.
As long as the price stays below this level, further downside remains likely.
However, the market is also testing the pivot zone, and a confirmed break above 42160 could trigger a bullish move toward 42410.
Key Levels:
• Pivot: 42160
• Support: 41900 / 41780 / 41310
• Resistance: 42310 / 42410 / 42580

SELL US30 - TO CLOSE GAPIn 5 min TF - retesting FVG.
There is also a H&S pattern forming - 5 min TF
Selling for the rest of the day
US30 Technical Overview – 06/20/2025📍 US30 Technical Overview – 06/20/2025
After dropping below the 42,472 support zone, US30 is attempting a minor bounce from the 42,000 region. Momentum remains weak with EMA pressure overhead.
🧠 Key Observations:
Clean breakdown below 42,472 📉
EMA resistance still intact (42,085)
Weak recovery after tapping 41,900 area
📊 Price Zones:
🔼 Resistance: 42,472 → 42,600
🔽 Support: 41,900 → 40,983
📈 Trade Setup Ideas:
🔹 Long Bias:
Only if price breaks & holds above 42,472
→ Target: 42,700+
🔻 Short Bias:
Rejection from 42,085–42,100
→ Target: 41,900 → 41,200 → 40,983
🕵️♂️ Still inside a potential distribution phase. Stay patient — let price pick direction before sizing in!

Us30 Key Levels on the Daily Timeframe – Quick Analysis:
🔴 Resistance Zones:
1. 42800 – 42950 🔺
• This area marked a strong top and rejected price multiple times
• If price returns to this zone, a strong rejection is likely
2. 42250 – 42400
• Previous correction area, may act as short-term resistance
• Useful zone to exit partial long positions if price bounces back
⸻
🟢 Support Zones:
1. 41700 – 41750 🧱
• Nearest support zone, price is currently close
• A break below this could trigger further downside
2. 41480 – 41550 🔻
• Medium support from a previous low (May)
• Breaking this opens downside toward 41000
3. 40700 – 40800
• Strong support from a major bottom
• A break here could open the way to 390 00–38000
⸻
📉 Chart Notes:
• Currently forming a potential double top near 42900
• The downtrend seems active as long as price stays below 42250–42400

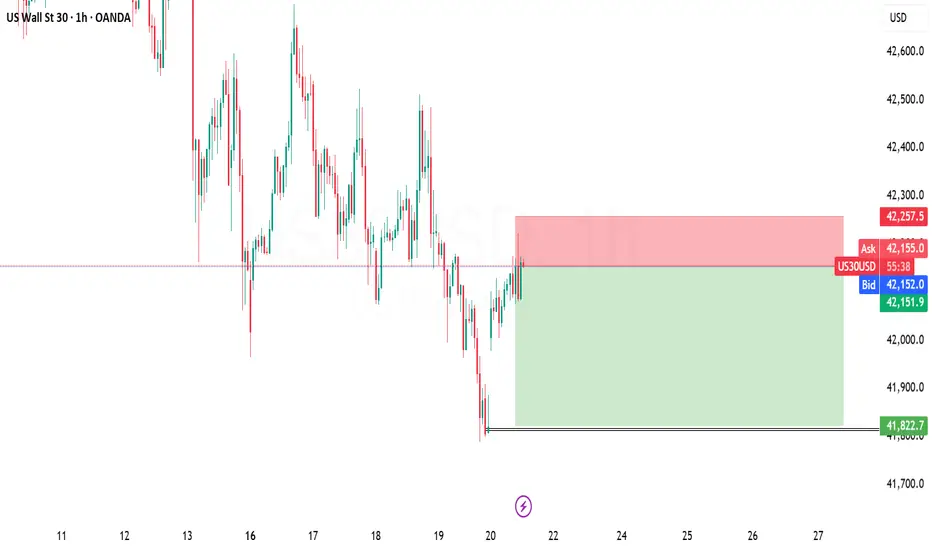
US30 LONGSAlthough the hourly may ne considered bearish, we are currently approaching a respected support zone as seen from the 4h and above.
I have highlighted a strong 4h Demand as a potential point of entry, unsure about long target and stop loss zones, so I personally will be sticking to my ratioed take profit as usual - 100:300.
I do hopefully see some strong bullish movement coming in over the next few days.
Strictly technical analysis
lankss
US30 TodayUS30 Today is still bearish
My SSM Reversal Pattern is comming.
This is just my view of course

US30: Absolute Price Collapse Ahead! Short!
My dear friends,
Today we will analyse US30 together☺️
The recent price action suggests a shift in mid-term momentum. A break below the current local range around 41,858.0 will confirm the new direction downwards with the target being the next key level of 41,737.4 .and a reconvened placement of a stop-loss beyond the range.
❤️Sending you lots of Love and Hugs❤️
