EU50 trade ideas
EU50EUR broked 5-Years High!If the price will hold above the 5-Years High I will look for the Buy entry.
But if it is only a false breakout and daily candle will close below it will be Sell.
Waiting for the confirmation.
Dear followers, the best "Thank you" will be your likes and comments!
Before to trade my ideas make your own analysis.
Thanks for your support!
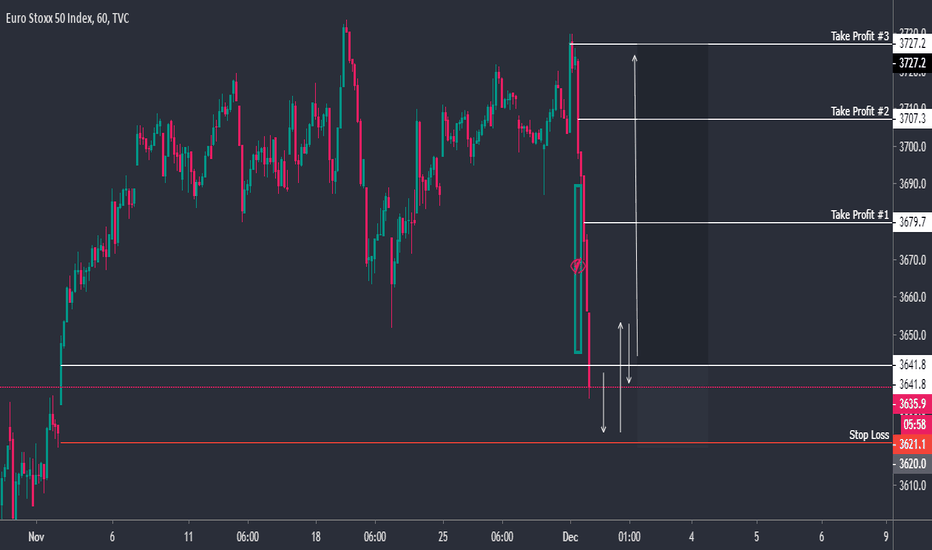
EURO STOXX 50 INDEX (SX5E): Update and Target Extension
Patience pays and those who followed my trading plan made a good profit from this counter-trend short.
now the market is very close to our initial target and I suggest only partial profit-taking.
With the protected position, we can expect with you a drop lower.
I would aim at 3525 levels as the second target and 3425 as the third.
good luck!
Shorting timeThe Euro Stox 50 is near a big resistance at 3817 and couldnt break it after many days of trying but now , the Index is going down and unless we break 3817 I think the downside will continue to 3660
So keep an eye on 3817 level and try to short now at 3768 with a stop loss at 3811 and a first take profit at 3734 then 3680
"EuroStoxx breaking the Ascending Trendline" by ThinkingAntsOk4H Chart Explanation:
- Price was on an Ascending Wedge since August.
- Price bounced on the Resistance Zone.
- Price broke the Ascending Wedge.
- Now, it has potential to move down towards the Support Zones.
Weekly Vision:
Daily Vision:
Updates coming soon!
EU50EUR is close to the Historical Key Level!We can open Sell after the false breakout of Historical Key Level 3824.0.
The price was at that level 5 years ago.
Potential profit will be in 3...5 times bigger than risk.
Push like if you think this is a useful idea!
Before to trade my ideas make your own analysis.
Write your comments and questions here!
Thanks for your support!
EURO STOXX 50 (SX5E) May Drop Soon!
Euro stocks index is approaching a 4 years' high!
there is a high chance to see a strong bearish reaction from the underlined weekly resistance,
but because the trend is bullish, I will trade the market only with a good confirmation signal.
On 4H chart, the market is currently forming the right shoulder of a head and shoulders pattern.
I pay close attention to 3725.0 neckline.
Being broken, it will trigger a selling reaction and it will be a perfect signal for us to open short.
The initial target will be 3625.0 level
The second target 3410.0 level.
Stop will be above head!
Good luck!
Key level for Eurostoxx50 index - at 5 year highEurostoxx 50 has been on a very strong run. Key level being tested on the 5 year weekly chart. The index has already reached a 5 year high but if can break and hold above the resistence line at 3705 it could head up 3824 and anything above that would be the high going all the way back to May 2008
EUROPE50 STOXX Index SHORT - divergence and momentum resistanceAfter the sharp rise it has slowed down and we can see more bearish bars on the chart. This has also created a divergence on the RSI. The loss of momentum has established a momentum resistance around 65 on the RSI which price doesn't seem to be able to push through and the 9EMA on the RSI has caught up with the signal line.
All this suggest a technical reversal which maybe will re-test the MA200 support.


