SPI200 trade ideas

AUS200 - Long trade signal daily* 50% for all predicting.
- Risk: 1%.
- Risk/reward: 1/1.08
- Profit factor: 1.08
- Data backtest: default from Tradingview.
- Good luck.

ASX 200 XJO long term outlook bearishASX:XJO
Has broken below the 10 year channel. Will most likely retest the channel and then down towards the primary trend.


AUS2000 - SHORT 15m & daily timeframe.In a retracement wave in an ascending triangle.
If it breaks the triangle trend then expect to go lower, but expect to bounce off and head back towards resistance.

Down, down, prices are downGood sell signal on the AUS200. Bears are in order based on big fat red candle punching below the 23.6% fib retracement. Good sesh for the bears.

ASX Fluff Has Pushed A Little Higher. Above ConsolidationMid week trading and the ASX has pumped a little above the consolidation fluff I wrote about for the last 28 days which is actually just good to see some movement in a direction. For strength this market needs to get up to the previous high market to have full confidence that things are changing. Aussie markets to get sucked up with USA confidence. Still dribble IMO unless a more dominant p…u…s…h.…
Also watch out for the battle zone starting at R1: 5624.5 and above…
📈Support & Resistance📉*
Support Levels
1st Support Zone: 5482.9
2nd Support Zone: 5283.0
3rd Support Zone: 4887.9
Resistance Levels:
1st Resistance Zone: 5624.5
2nd Resistance Zone: 5723.3
3rd Resistance Zone: 5943.8
Price Level Consideration
ATH: 7208.2
All Time High Half Way Point: 3604.1
Previous High: 5568.6
Previous Low: 4392.7
🐃 Bulls Verse Bears 🐻
🐃 Bullish above: 6880.9
🐻 Bearish below: 5397.8
Monthly & Weekly Opens
Monthly Open: 5520.6
Weekly Open: 5403.6

Australia 200 (ASX) breakthrough longShort period retest on AUD200 resistance line + ascending triangle for a few days now. Should continue upwards after breakthrough again.

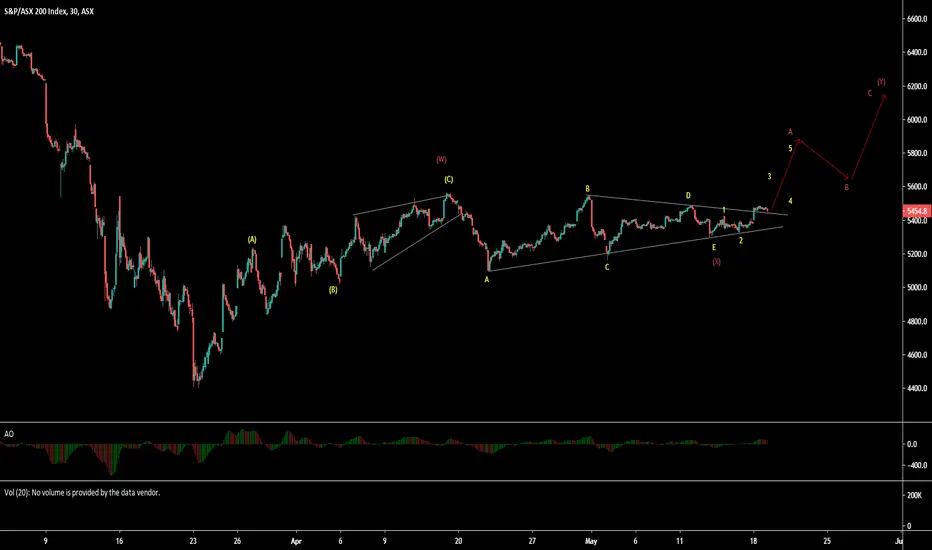
ASX 200 Index (XJO) - Updated EW count ASX 200 Index (XJO) is in WXY complex correction pattern, where W is zigzag wave and X wave was triangle. Wave 5th of A of Y up is in progress as shown in chart.
ASX - Ending Diagonal Trickery - So Now Wave 3 Down? ASX TOP???So back to my original ending diagonal idea. This made that last Wave v needed to complete the ending diagonal.
Has Wave 3 begun? Probably but a break of the Magenta line will confirm this.
If this is Wave 3 down in a major C wave then we should see this sharply lower sooner rather than later.
Please LIKE and FOLLOW to get notification of updates and future posts.

AU200AUD Long Continuation AU200AUD Long Continuation
The triangle formation is clear now. Expectin a long continuation is very probable.
Today market in general get recover almost all equities get recovered follow by a fall in Gold.

XJO - WXY patternXJO - (ASX 200 Index) is in WXY pattern from bottom and X was in triangle, which was broken up side. Y is now in progress, which again progresses in ABC as shown in chart.
AU200AUD Triangle Breakout Soon!Hello Friends,
There is a bearish triangle formed on the H4 chart. However, the price action has already pushed past the triangle trendline and is looking bullish. If this continues we will be seeing a nice push up towards the target. If this is a fake-out then expect a bearish push down as indicated on this chart.
Cheers!

My thought on XJO aka ASX in a single chartASX is showing a bullish signal according to the charts. Below is my analysis and when i will be fully bullish.
Bullish case:
- ascending triangle which is inherently bullish.
- LSMA in upwards direction
- price above 50MA
- daily velocity positive
- RSI neutral
Bearish case:
- price below a key fib level: 0.382 at 5468
- price below key resistance level at 5580
I will be full-bullish with of course tight SL when price closes daily above 5584.
I will keep you updated with any changes bullish or bearish. If you like these TA please click like or leave a comment.

ASX 200 Index - Short to medium term price chart analysis.ASX 200 Index - Short to medium term price chart analysis.
My views and price target for Aus 200 Index remain the same as per my last analysis on May 5th. www.tradingview.com
The Index reached my second target at 5480.0 and retreated to the first target before heading back up on Friday's session, closing at 5404.80. The short to the medium-term trend is still bullish as long as it remains within the uptrend price channel, as indicated on the 30 minutes price chart.
A new price pattern that appeared on the US major Indices is duplicated on this chart, which is the longterm price channel supporting the price action, This could act as a strong support base for future price movements. However, if prices fall below the longterm price channel, we could properly see the Index head south.
The critical price points to keep an eye in next week's session are estimated at the following area:
Support - 5380.0, 5305.0, and 5164.0
Resistance - 5484.0, 5617.0, and 5698.0


ASX Consolidation Fluff,P Action Task For The Week = A DirectionLooking for some confidence or lack of, anything really, to move this market out of this range of chop. Price at Mondays open will be APEXing, so hopefully traders can push this in a direction up or down for some clear trading sentiment. If positive during the week an upward carrell channel could form for the following weeks to respect.Taking sentiment away from the charts and to the global economy there could be down side to come as it can’t keep being prop’d up considering this recession. A direction is needed shortly and the market will show that this week…. or next :P
📈Support & Resistance📉*
Support Levels
1st Support Zone: 5283.0
2nd Support Zone: 5185.5
3rd Support Zone: 21718.4
Resistance Levels:
1st Resistance Zone: 5478.2
2nd Resistance Zone: 5624.5
3rd Resistance Zone: 5943.8
Price Level Consideration
ATH: 7208.2
All Time High Half Way Point: 3604.1
Previous High: 5568.6
Previous Low: 4392.7
🐃 Bulls Verse Bears 🐻
🐃 Bullish above: 6880.9
🐻 Bearish below: 5397.8
Monthly & Weekly Opens
Monthly Open: 5520.6
Weekly Open: 5386.9
If P action can break above the present consolidation it would still show strength to get caught up with this previous zone…

AUS200 4hAUS200 is forming a wedge, capping around 5500, and finding support around 5300. A break out of these levels could signal a new trend formation.


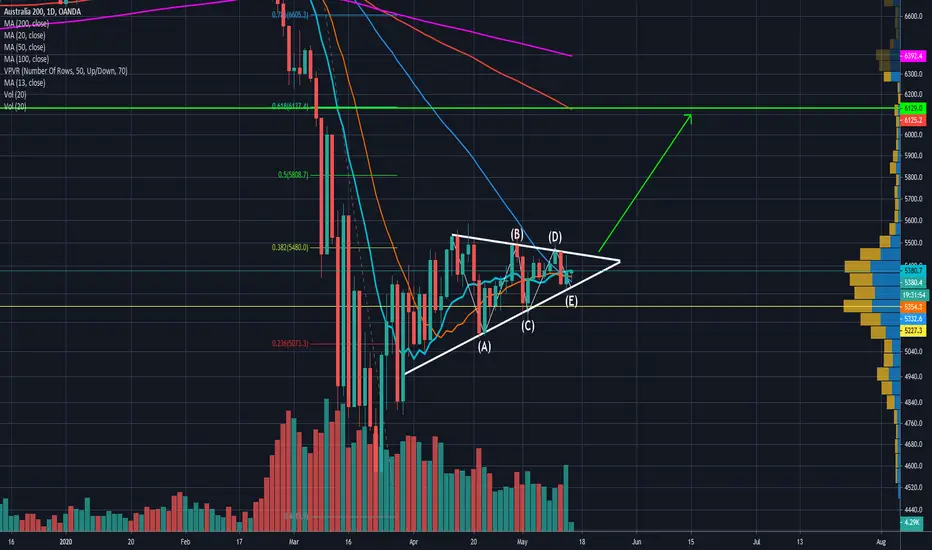
AU200AUD Elliot Wave Symmetrical Triangle Pattern The Australia 200 looks to have formed a nice symmetrical triangle pattern with 5 waves complete. Price is above both the 50dma and 20dma providing some bullish confirmation. Target is the 61,8% fib which is also at the 100dma
ASX200 daily- Rising Wedge+failed to break 38.2% Fib retracemASX200 daily- Rising Wedge + Failed to break 38.2% Fib retracement.
According to Thomas Bulkowski "Rising Wedges, especially for downward breakouts, are some of the worst performing chart patterns. Downward breakouts have an unacceptably high failure rate and small post breakout declines. Also, throwbacks and pullbacks occur 72% of the time."
Breakout for Rising Wedges: Can be in either direction, 60% of the time downwards.
