Russell 2000 B Wave Flat Correction Near Complete. I was forced to relabel my interpretation of the Russell 2000 after the July 2023 high was broken. The structure is now labeled as a regular flat primary B wave correction that is either complete, or nearly complete. The next wave down should be rather fierce, as C waves tend to be. Wave C will decline in 5 waves to meet the depth guideline near the terminus of the previous 4th wave of lessor degree. Somewhere near $971.
US2000 trade ideas

Small Cap may benefit from year end rallySmall cap have been trading sideway since Jun 2022 with the resistance around 2k.
With end of year rally, it may benefit small cap index.
Eying to return back to 2k resistance level.

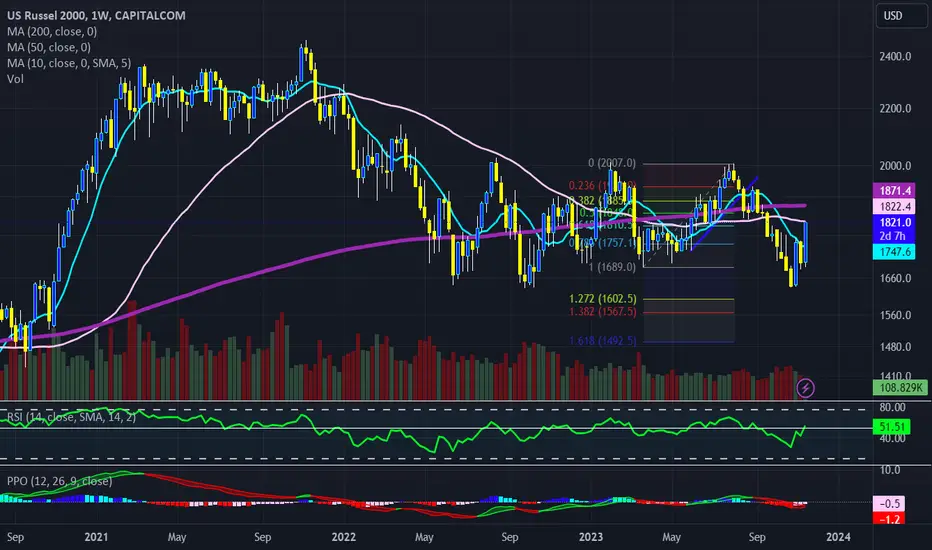
US2000: Technical outlookLevels plotted to look out for, combined with daily and weekly MAs to be used as S/R confluences. RSI and MS are indicating a possible reversal, not a signal itself but a confluence to the shorts from S/R levels. You should also check US500 and US30 before shorting.

Russell 2000 Start of movement in second line stocksRussell 2000 Start of movement in second line stocks
The index was until the last few days very close to the pre-Covid rates
Now starting to wake up with huge potential

Strong ResistanceWe have stopped at a former triple bottom which has been tested as a resistance twice now already.
So it may become a double top now. This the more that it was a top on May 23rd already.
The Moving Average is another resistance.
On November 14th we have opened window that may want to be closed.
Mind the trading range from mid March to 20th May which you can see easily in the weekly chart. It marks the top of today as well as the possible correction level.
We can say that the index has corrected the fall from end of July until 23rd October now and is back in its previous trading range.
This range may hold till the end of the year.

RUSSELL 2000: Short term pullback possible but buy for 1910.Russell 2000 crossed again today overo the 1D MA200 and it remains to be seen if it succeeds at closing above it. After the November 15th crossing but failure to close over it, a repeat may materialize a pullback of at least -4.50%, in similar fashion as the 1D MA200 rejections of May 23rd 2023 and November 1st 2022.
Technically that's possible as on the greater picture, the index is still neutral on the 1W technical outlook (RSI = 50.610, MACD = -19.910, ADX = 34.284) sitting almost halfway of the giant consolidation/ Rectangle pattern of the past year and a half.
Consequently, we will welcome any pullback as a buy opportunity, but we are already bullish, aiming at the R1 level (TP = 1,910).
## If you like our free content follow our profile to get more daily ideas. ##
## Comments and likes are greatly appreciated. ##

Russell priced in goldThat could be it for US small caps #stocks priced in #gold...
this line lost
bull era for gold and silver

Will Rusell2000 follow SP500 and NASDAQ100?
The Russell 2000 index consists of 2,000 small-cap companies, making up the smallest segment of the Russell 3000, which covers approximately 98% of publicly traded stocks in the U.S. Every June the index is rebalanced, adding new companies or removing existing ones.
Currently, the market is focusing on the positive aspects of the data and favoring the demand side. However, the medium-term structure remains trapped in a wide sideways trend, with resistance and support levels acting as key boundaries on the chart.
The Russell 2000 index is highly sensitive to GDP growth, which the Federal Reserve actively manages to control inflation. Consequently, the path of the Russell 2000 is influenced by the trajectory of U.S. economic growth - small caps typically have weaker balance sheets, higher levels of floating debt, lower profit margins, and longer durations, which add to its vulnerability.
The Price Line overlays are Nasdaq100 and SP500.

US Russell 2000 RTY ~ Ping Pong Perpetuity (Daily Chart)CAPITALCOM:RTY chart mapping/analysis.
Russell 2000 still stuck within trading range despite recent rallies across major US indices.
What's on the chart:
Ascending parallel channel (light blue) captures upward trend over multi-decade timeframe
Descending parallel channel (white) frames downward trend from upper to lower range (multi-decade) parallel channel
Horizontal lines (yellow dashed) locks in trading range (June 2022 to present)
Descending trend-line (light blue dotted) highlights pivot support points
Fibonnaci levels establishes key supply/demand zones
Short-medium term outlook:
Neutral-bearish
RTY remains in " Ping Pong Perpetuity " until breakout on either side of trading range
200DMA acting as dynamic resistance, exerting downward pressure
Bullish reversal = rally above 200DMA to switch trend & test upper trading range

SHORT RUT/RTYSHORT RUT/RTY 1820
stop 1900
target sub 1600
This rally on one fluky/flaky piece of data makes zero sense
Inflation is not going away anytime soon
Russell2000russell2000 continues laterization, possible breakout of the long-term high channel, after 2024 only


Do not doubt the bull market!!_ RUSSELL 2000 about to join in!I have posted my views on various global indices as well as major US indices like Nasdaq and SP500 also SP500 realty and written about how i am convinced of the bull market and all the major global indices confirming to this view. Many are here to believe that what the world witnessed in 2020 is all going to dirt now and everything will collapse.
Well I on the contrary believe that what the world witnessed in 2020 was the start(look at Japan (nikkei225)coming out of 30 years range, Australia(XJO 200) standing at new 16year high, Italy(IT 40)moving out of past 10years range,EU50 at standing at a new 10 year high and the list goes on and on.)
Major moves(to upside) in many global indices will be seen in 2024-2025.
Speaking of the US market, my attention now goes to the RUSSELL 2000.The Russell 2000 Index is a small-cap U.S. stock market index.
The RUSSELL 2000 I believe has started out now in its major 3rd wave which could more than double this particular index.
The index was seen a complex triple three correction for past two years and the structure of this complex triple three appears completed to me. I am therefore anticipating this index to rally hard going into 2024.
4000-4200 is the projected target zone for wave 3.
Note*- This chart and its explanation is based on personal views/opinions. Please try do do your own research/analysis before making any financial decisions.
Note*- the wave counts and marking were done using daily and 4hour charts for anyone interested in knowing.

$RUT $IWM Wyckoff Spring / TestLooking for a retest here and recovery of the range low. which would give confidence to our idea of the the spring phase here on the last sweep of the lows
We would expect to see strength coming off a successful retest, and price should move next to the last point of supply and toward the top of the range which would be your sign of strength.
Its still early here, but with the run on alt coins and other more risky speculative assets, i think that would itself be a sign of risk on and potential to see the same on smaller cap stocks.
Keeping an eye on this one. A return to riskier trading behavior would be indicative of confidence in the market as a whole and further validate our ideas of continuation on both SP:SPX & NASDAQ:IXIC

Is this 2008 again for RUT?Russel 2000 trend line looks wobbly and could easily break on some bad news.


US Stocks in Counter Trend BounceRussell 2000 (RUT) is an index of 2000 stocks. It can be seen as a barometer on the health of the US economy as mid-size and smaller companies are included in the index.
RUT has been declining in an impulse wave. The decline was not deep enough to count a completed wave from the all-time high.
Today, the price is rejecting the underside of the trend line that extends back 1 year ago to October 2022.
If any further rally is required, it is viewed as a corrective bounce that might reach $1776 or the 61.8% Fibonacci retracement.

RUSSELL 2000 Spearheading the next stock market run?Russell 2000 / RUT closed the 3rd green day after hitting the Support A Zone that is holding since June 16th 2022.
This is turning into a major long term buy signal and will be validated when tomorrow the 1day MACD forms the lowest Bullish Cross since March.
Technically the bullish break out happens after the price crosses over the 1day MA50, but on a broader horizon, the current level is low enough to attempt a buy.
Target 2000 (bottom of Resistance Zone A).
Follow us, like the idea and leave a comment below!!

Russell pried in goldThe vice is tightening.
notes:
this line lost
one more rally?
#stocks #banks #spx #inflation #gold #silver

Russell priced in silverThat looks like a massive double top for US small cap stocks priced in silver.
Who is betting against this?
#silver #purchasingpower #gold #inflation #stocks

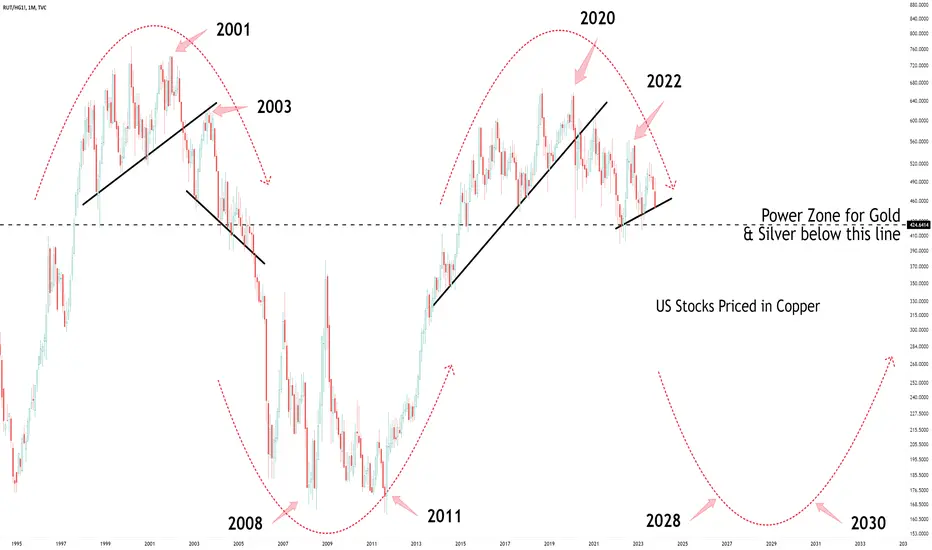
Russell priced in CopperHow can this be bullish for US equities?
Very close to full melt down.
Expect #gold and #silver to out perform when this happens.
#copper #stocks #gold #silver #uranium #crudeoil
Russell 2000 Roadmap Oct 2023C wave underway now. Early stages but likely to be more complex and prolonged into 2025
