Not out of the storm yet.The Russell 2000 is currently at the pre-covid 19 high area however this area is not going to hold because many of these small debt ridden high growth assets will be killed by a combination of both high interest rates which increases debt servicing costs when many of them are over leveraged. Along with soaring costs due to severely damaged global supply chains (which face even more headwinds due to Chinese policy missteps and war in Ukraine) and soaring commodity prices. I do not think this support are will hold I think minimum we are looking at a return to 1450. Most crashes such It took from December the 12th 2007 when it started. to march the 3rd 2009 from top to bottom in the 08 financial crisis for most indices. We are currently in a super high risk uncertain global economic environment with no good news in sight for these types of entities. We are only roughly 3 months into the current market crash for some perspective. There is much more pain on the way.
US2000 trade ideas

RUT update - 28/04/2022upside focus remains, expecting a strong move higher in wave (3), critical support at 0.776

US2000 short Looking for a potential short again on US2000, potentially from the 15min unmitigated OB. Will look for confirmation on lower timeframe (1min)

US2000 shortLooking to take short on the unmitigated 15min OB if I get a confirmation on lower timeframe

us Russel vs other US indexesJust look at the drop in the Russel, its shows you what the others have to look forward to.

$RUT support at 1700 areaThe Small Caps had a hugh surge of a run during the October '20- January '21 time period. Just the same, now it's got little to no support on the way back down. I don't see any meaningful support until the 1700's area.

RUT: 1000 Target ?Wyckoffians usually Call a Narkdown when they see that Pattern. 1440 correction Potential from the TOP... Be cautious when trading!!!

1.5 YEAR as the INDUSTRY's been SHORTING. Sentiment RUssel 2000 small capitalization companies .
the cycles of growth and fall, aka distribution and collection (accumulating).
the index characterizes how much of private capital in market
15 months of institutions shorting
no private investors , no needed sentiment now , the Fed, wars and conflicts
I predict 1.5 year is enough and it's time for hedge funds and banks to close their short positions and start accumulating
fall 2022 when its gon be the new cycle of enormous rise
as the war ends and the Fed stops talking shit, people will be dragged to put their money into the stock market
look how Nasdaq index falls since January, there's no money in market currently , but it's about turning around in near months
remember my words
AUTUMN 2022
Market Sentiment is the most crucial

Bias more on downside30th April 2022.
Since RUT failed to recover back its previous support area at 2130, it became the resistance there after.
Small cap will suffer along with its brother (3major index) falling. We shall see next support level around 1750

RUT RUT looking extremely weak here.
Expect large caps to continue to outperform supported by passive flows.

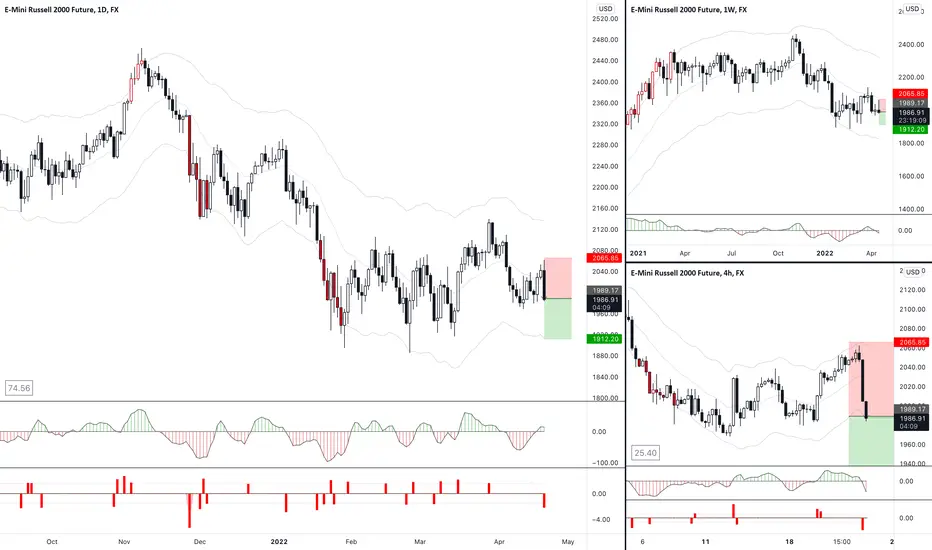
RUT Russell 2000 Support and Resistance playRussell 2000 is showing strong support at the $1940 area.
I think that RUT is a support and resistance play from here, the first target being the $2130 Resistance.
Looking forward to read your opinion about it.

Russell US2000 Daily Outlook | 22 - AprYesterday was massively profitable for me. Today, once again lets see how price will react towards my expectations.
Note: Am not a mentor, i am just a random guy who journals his trades on TView for trading community to read and comment their opinion. This not a signal hence copy at your own risk!
Kings.

Short term MAs to help see swingsI discuss how a short term moving average such as a 5MA can be useful to help your brain focus on the swings rather than getting sucked into the randomness of single candles.

US2000 Daily Outlook | 21- AprEager to see which way price will eventually choose today.
Will update intermittently.
Kings.

US2000 Russel Index shortRecent strength in stocks early in the week seems to be a false rally as markets sell off on Thursday. Looking to see a test of the low of the larger range. Momentum should continue and be in profit or at least near entry after tomorrow otherwise will look to close if market is still choppy and there is weak followthough. This volatility today could be the first sign of the next impulsive leg down.
US2000 Daily Outlook - 20 AprCurious to see which way price will choose. Will update by EOD on the result.
Kings.

russell buy signalwe see a little trendline here, retested with inverted pinbar,
as confirm we can check stochastic over sold and divergence.


8 Difference Between Pros And Amateurs In Day TradingIt doesn’t matter how long you’ve been trading; there is always room to improve your approach and become a more profitable trader. To be a successful day trader, you need to learn what the pros do, implement their tools into your methods, and constantly be willing to improve your strategy.
1. Have a strategy.
This may seem simple but almost all amateurs trade purely based on emotion, gut feeling, or tips from their friends. Maybe they even have a trading strategy, but for some reason they still don’t follow it. Pros always stick to their strategy under any circumstance.
2. Stick to the strategy like a robot.
Pros always follow their strategy because they realise that reliable data is more valuable than trying to get lucky on big traders here and there. Even if they aren’t confident in a trade, they realise that they created the strategy for a reason, based on historical market data, when they were thinking clearly, and that following their strategy will produce consistent profits long term. When you don’t follow your strategy, or you take profits early, or move stops, that invalidates all of your historical results and future results, which means you never have any reliable data you can use to improve your trading.
3. Pros don’t get emotional when trading.
When it comes to managing your emotions in trades, pros have an amazing ability to recognise how they’re feeling in the moment, and use that information to avoid taking bad trades or to improve their good trades. While amateurs tend to avoid even considering the fact they may be trading emotionally, and fail to recognise when it’s impacting their trades.
4. Pros don’t hold onto their losers.
It’s common for beginners to hold onto a trade that’s gone against them a bit. Often, they will wait for it to get at breakeven to get out – and then it continues to go down and down until eventually they’re forced to sell for a big loss, only to be left feeling like an idiot when the market does turn around. Pros, on the other hand, cut their losers early, and look for the next trade. Pros don’t get attached to any single trade and they realise there are plenty of opportunities in the future.
5. Pros let their winners run.
A common mistake of amateurs is to close their trades early and take the profit. Hey, you can’t go broke taking profits, right? Wrong! Nothing could be further from the truth. You absolutely can go broke taking profits and it’s actually a common mistake for beginner traders. When you try to avoid losses by taking profits early, it reduces your average win, and negatively impacts your risk:reward ratio which is a recipe for disaster. You need to know how to effectively set your take profits and stop losses so that you have a positive expectancy, and remain profitable long term.
6. Pros keep a trading journal.
Pros track literally every aspect of their trading. They want statistics on everything so they can fine tune their trading approach based on any little statistic that is lagging. They want detailed statistics on winrate, average win, average loss, expectancy, trades per day, winrate based on time of the day or day of the week. They’re going to track literally everything they could possibly use to give themselves an advantage.
7. Pros constantly study the market.
Besides keeping an eye on things like technical indicators, pros will always spend time looking at the news, their trade journals, studying books and anything else they can get that improves their trading knowledge and performance.
Pros always want to get smarter, but that’s not to say that they spend all their time studying - one of the reasons we day trade is for freedom to live life on our terms. But that doesn’t mean we should set aside some time every day for study.
8. Pros have realistic expectations.
Pretty much every beginner comes into day trading with the expectation of being able to double, triple, or even quadruple their money in a matter of weeks. With this goal in mind there is literally no other option than for them to trade with unlimited risk. Pros realise what kinds of returns they can actually expect as a day trader - and most of the time it’s a lot less than doubling your money every year.
Day trading is a long game, and results never come overnight. To be successful in this field you should be consistently looking to improve your approach in every aspect.
I hope you found this guide helpful and it serves as a reminder to keep working hard to reach your goals.
Happy trading!

Russel Potential pullbackRussel is currently stuck in a Trading Range, but also experienced a lot of buying pressure in the first half of the NY trading session. Possibility for a short stop hunt before reversing back down.

Russel 2000: more downside potential?Objective? The lower range of the Bollinger bands or the Linear regression channel pattern?
A bearish trend is applicable below 2100.
Crossing above this level will negate the bearish stance.
Downside price potential supports the bearish trend.
RSI leaves enough room for further downside price potential.
MACD bearish crossover applicable.

Price reversal during FOMC Minutes at Supply ZoneAs the FOMC Minutes where released, Price traded up to the Last Supply zone before collapsing back to the bottom of Daily Range.

Full multiple breakdown analysis of US30Here is a full multiple timeframe breakdown of US30 /Wallstreet30 indice.
Enjoy and come back with a feedback of results.
