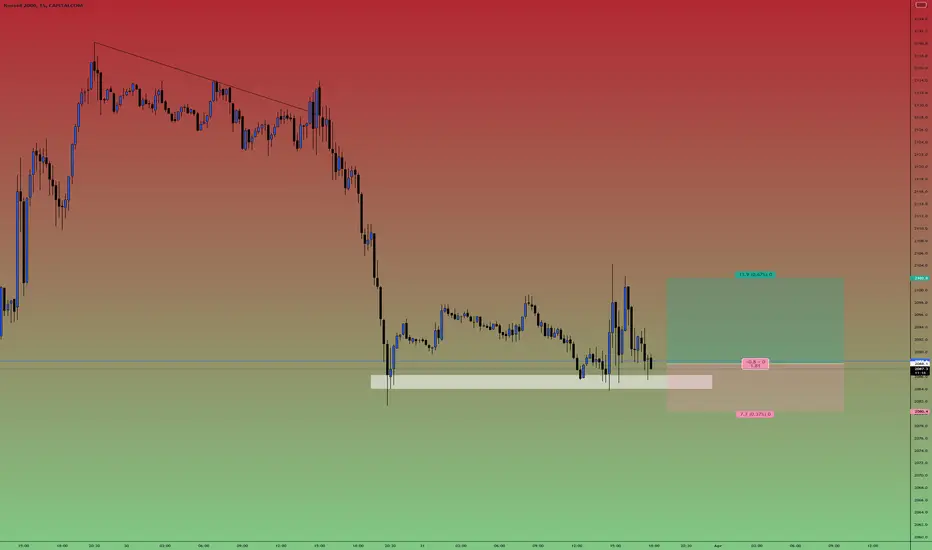
RTY LONG 2Going in for another go here. Already scooped 1.5r earlier in the session. Same set up. Lets see what happens,
US2000 trade ideas
RUT 3/20/22Russell 2000
RUT chart paints one of the best and clear pictures of where our economy stands.
Since topping out in Sept. ’18, RUT broke the trend and went into a sideways market.
In Nov.’20, price broke out of sideways range and continued uptrend.
At breakout price of 1708, price continued uptrend and topped out at 2355.
From there price broke down and close beneath 50ema in May ‘21. This ended the uptrend and sent price into a sideways range.
Price started to range between low of 2100 to high of 2350
Early Nov.’21 break broke out and upwards out of this range in what looked to be the start of new uptrend.
By the end of Nov.’21, price couldn’t hold support and fell back into range. The breakout is now deemed a “False Breakout”.
As price fell back into range, it found itself unable to break and close above 50 and 200 ema.
In Jan.’22, Price broke down from range. This breakdown now signaled a possible start of new downtrend.
Price continued its move downwards and bounced at 1920 area. During this time, we also saw a Death cross between 50 and 200 ema. This cross further confirmed the bearish conditions in the market.
After the breakdown, price pulled back to previous support @ 2100 and bounces off it turning previous support into resistance.
Currently, we are at support turned resistance level after breakdown of range.
The market broke down from this sideways range and we can now label it a “Distribution Stage”.
The Stochastic currently sits at 100, showing us the market is current completely “over-bought”.
The MACD is also under 0 in bearish territory.
We are entering a downtrend and couldn’t be at a better place to enter the market to short.
This is an ideal time to find short set-ups in the stock market.

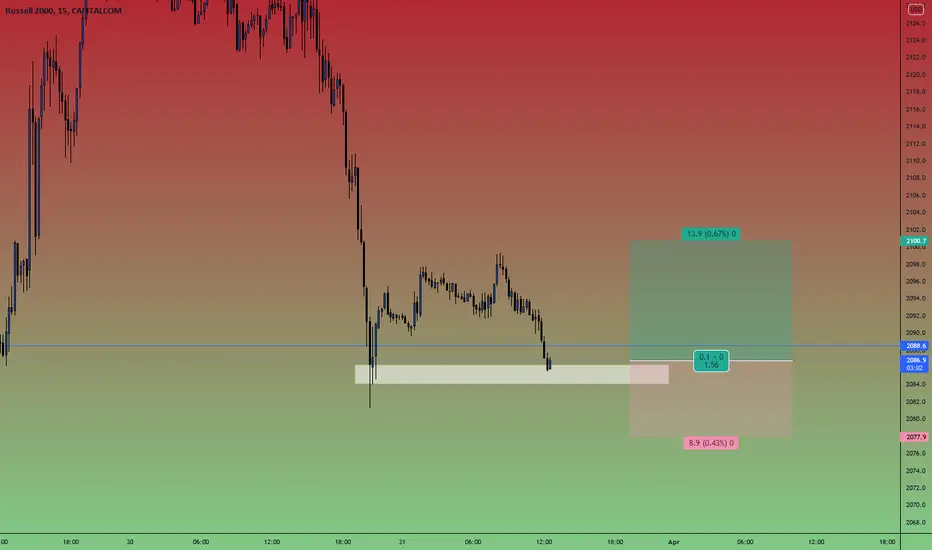
RTY LongTaking a shot at this reversal here. Double bottom with potential weak divergence. 4hr level hopefully supporting. Looking to see NY open push price back up.
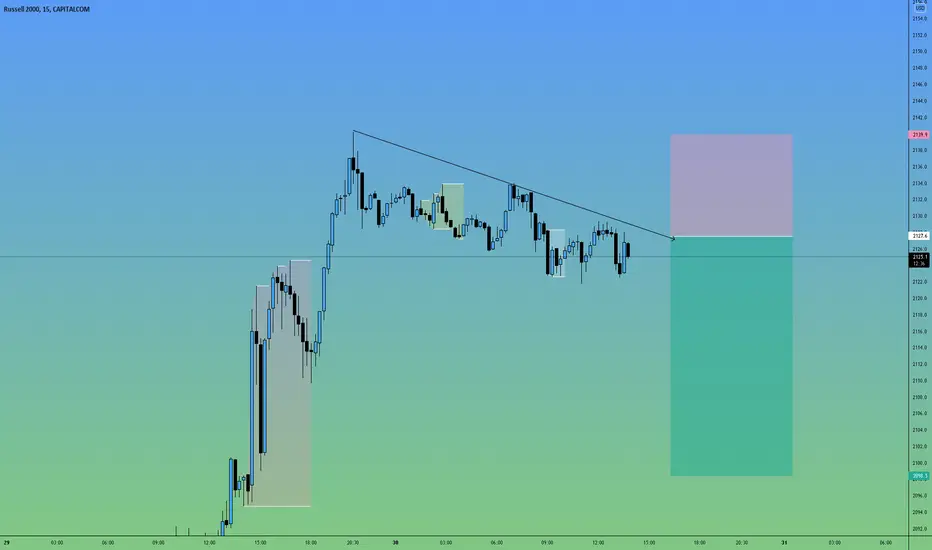
RTY SHORTSome HTF levels being retested atm. Gonna take a shot here, awaiting daily inside bar to be formed. Just came back up on open to retest ltf levels. as i type, is moving down lol.
RUT Russell 2000 Support and ResistanceRUT Russell 2000 bounced from the strong support of $1940 and is heading to the $2180 resistance.
I also think we might see the end of the war soon.
Russia says the first phase of its “military operation” in Ukraine is mostly complete.
Looking forward to read your opinion about it.

Russel Stuck in RangeRussel Index is Currently stuck between a Supply and demand Zone, basically creating a Range.

RUSSELL2000:FUNDAMENTAL NEWS+NEXT TARGET | LONG SETUPRUSSELL 2000 FORECAST:
The Russell 2000 tumbles as U.S. inflation rises at the fastest pace since 1982
Lack of progress in peace negotiations between Russia and Ukraine also weighs on sentiment, accelerating the sell-off on Wall Street
The Russell 2000 near-term outlook remains bearish from a technical perspective
The Russell 2000 fell Thursday in midday trading, sinking about 1.3% to 1,990, weighed down by risk-averse mood due to rising geopolitical tensions and rampant inflation in the United States. Investor sentiment improved briefly yesterday on expectations that the crisis between Russia and Ukraine could begin to de-escalate soon, but the winds shifted again today after high-level talks between the two countries' foreign ministers failed to produce any progress towards a ceasefire.
To make matters worse, U.S. CPI continued to accelerate and reached 7.9% year-on-year in February, its highest level since 1982, driven by rising fuel, food and housing costs.The commodity market price shock of the past few days did not influence data for this period, so we can effectively say that inflation has not yet peaked, and that much higher readings are likely in the coming months.
Mounting price pressures will lead the Fed to raise interest rates multiple times in 2022, starting at next week's meeting, although the hiking cycle may be less aggressive than anticipated earlier in the year amid extraordinary uncertainty stemming from the military conflict in Eastern Europe. In any case, the direction of travel is toward less accommodation and tighter financial conditions over the forecast horizon.
The transition to a more restrictive monetary policy environment, coupled with weakening activity, runaway inflation, and the war in Ukraine, will ensure that volatility remains elevated for the foreseeable future, complicating the equity market recovery, particularly for cyclically oriented companies that are highly dependent on healthy GDP growth. This leaves the economically sensitive Russell 2000 in a precarious situation and vulnerable to near-term weakness.
From a price action perspective, the outlook is bleak for the Russell 2000. Looking at the daily chart, we can see that the index is currently trading below its 200-day, 100-day and 50-day simple moving averages, and has been making lower highs and lower lows in recent months, two bearish signals that reinforce the argument that the path of least resistance is south.
In this regard, if the small and mid-cap stock benchmark stays on a downward trajectory, bears may attempt to launch on assault on 1,890/1,895. This technical support, defined by the 38.2% Fibonacci retracement of the 2020/2021 rally, has been tested twice in recent weeks, successfully repelling sellers each time. Should it be tested again, we may see a bounce from these levels, but if the floor breached, all bets are off, with a breakout exposing the 1,815 region.
On the flip side, if buyers return and bid price higher, resistance is seen near the 2,065 area, where the March high aligns with the 50-day SMA and a descending trendline in play since November last year. If bulls manage to push the index above this barrier, the next upside focus appears at 2,105 (February high). A sustained move above 2,105 and monthly higher high is required to resuscitate buying momentum and improve the near-term outlook.

Russell 2000-the next target is 1700.As we can see, the price has broken through the important support line of 2100 and has not been able to return back for more than two months. Then, we will consider this a confirmation of the truth of this breakdown. Now, let's pay attention to the wave structure. The falls occurred in the form of a pulse wave (1-2-3-4-5). This means that despite a slight consolidation, the downward movement will continue to the next support level of 1700.

How Many Resistances Does Russell Have ?I count 8 resistance and still below the 200Day exponential and simple averages. It's great place to the put short position.

Quiz..?A quiz is usually a short test and often doesn't have a huge impact on your grades as a test has. But this one could have a huge impact on your portfolio..!
I provide the chart and the cheat sheet.
For more help you can look at my previous analysis as well:
or
or
You like to learn more, read this article:
www.investopedia.com
Question:
How you can make money out of this analysis?
Write your answer in the comment section
Best,
Dr. Moshkelgosha M.D
DISCLAIMER
I’m not a certified financial planner/advisor, a certified financial analyst, an economist, a CPA, an accountant, or a lawyer. I’m not a finance professional through formal education. The contents on this site are for informational purposes only and do not constitute financial, accounting, or legal advice. I can’t promise that the information shared on my posts is appropriate for you or anyone else. By using this site, you agree to hold me harmless from any ramifications, financial or otherwise, that occur to you as a result of acting on information found on this site.

Russell 2000, The Weakest LinkFolks, Inflation affects small companies more than the large-cap stocks. Capitalism supports the survival of the fittest businesses. Many large-cap companies can dominate the smaller competitors in a rising price environment as inflation is a more significant threat for companies with less capital. Rising interest rates that increase financing and debt servicing costs also weigh on profit margins. Inflation can be a damaging beast for the small-cap arena.
let me know about your thoughts on Russell 2000, Compared to S&P 500 will it fall much harder during the economic hardship cycle?
Not financial advice.

RUT trailing on long positionsLocking in profits on the RUT longs. Bulls now as impressive on the resistance as I'd have hoped they'd be for a continued long trade.

What is going on in Small Caps?After successfully predicting a 10-15% decline in Russell 2000 now we need to look at it once again..!
I think the top of the orange box could be a strong resistance level and the relief rally will be ended there..!
Also, this could be the SOW part of Wyckoff model:
Best,
Dr. Moshkelgosha M.D
DISCLAIMER
I’m not a certified financial planner/advisor, a certified financial analyst, an economist, a CPA, an accountant, or a lawyer. I’m not a finance professional through formal education. The contents on this site are for informational purposes only and do not constitute financial, accounting, or legal advice. I can’t promise that the information shared on my posts is appropriate for you or anyone else. By using this site, you agree to hold me harmless from any ramifications, financial or otherwise, that occur to you as a result of acting on information found on this site.

Exiting RUT shorts and going longRUT short squeeze looks very much back on the table. This could be a super interesting move. Positioning long and will aggressively add to position if we trend up. I think this is is really strong above the last lows. Bullish trades cut under there,

Russell 2000 Macro Outlook1750 within 4 weeks, followed by melt-up to 3000. 40-60% bear market after. 1.618 Fibonacci will be respected in cycle top. Top H2 '22 / H1 '23. Unfortunately, fundamental supporting research is private.

RUT short Looking for two RUT shorts. One from the current price and if we get that will take profit 1789 and re-load into a bounce.

Russell 2000 Wave 4 TriangleLooks like the RUT 2000 possibly finished a wave 4 triangle. If we take out yesterdays lows that should confirm.Look for new lows next week.

Russell 2000: FUNDAMENTAL + NEWS INFOs | LONG SETUPRUSSELL 2000 FORECAST:
The Russell 2000 tumbles as U.S. inflation rises at the fastest pace since 1982
Lack of progress in peace negotiations between Russia and Ukraine also weighs on sentiment, accelerating the sell-off on Wall Street
The Russell 2000 near-term outlook remains bearish from a technical perspective
The Russell 2000 fell Thursday in midday trading, sinking about 1.3% to 1,990, weighed down by risk-averse mood due to rising geopolitical tensions and rampant inflation in the United States. Investor sentiment improved briefly yesterday on expectations that the crisis between Russia and Ukraine could begin to de-escalate soon, but the winds shifted again today after high-level talks between the two countries' foreign ministers failed to produce any progress towards a ceasefire.
To make matters worse, U.S. CPI continued to accelerate and reached 7.9% year-on-year in February, its highest level since 1982, driven by rising fuel, food and housing costs.The commodity market price shock of the past few days did not influence data for this period, so we can effectively say that inflation has not yet peaked, and that much higher readings are likely in the coming months.
Mounting price pressures will lead the Fed to raise interest rates multiple times in 2022, starting at next week's meeting, although the hiking cycle may be less aggressive than anticipated earlier in the year amid extraordinary uncertainty stemming from the military conflict in Eastern Europe. In any case, the direction of travel is toward less accommodation and tighter financial conditions over the forecast horizon.
The transition to a more restrictive monetary policy environment, coupled with weakening activity, runaway inflation, and the war in Ukraine, will ensure that volatility remains elevated for the foreseeable future, complicating the equity market recovery, particularly for cyclically oriented companies that are highly dependent on healthy GDP growth. This leaves the economically sensitive Russell 2000 in a precarious situation and vulnerable to near-term weakness.

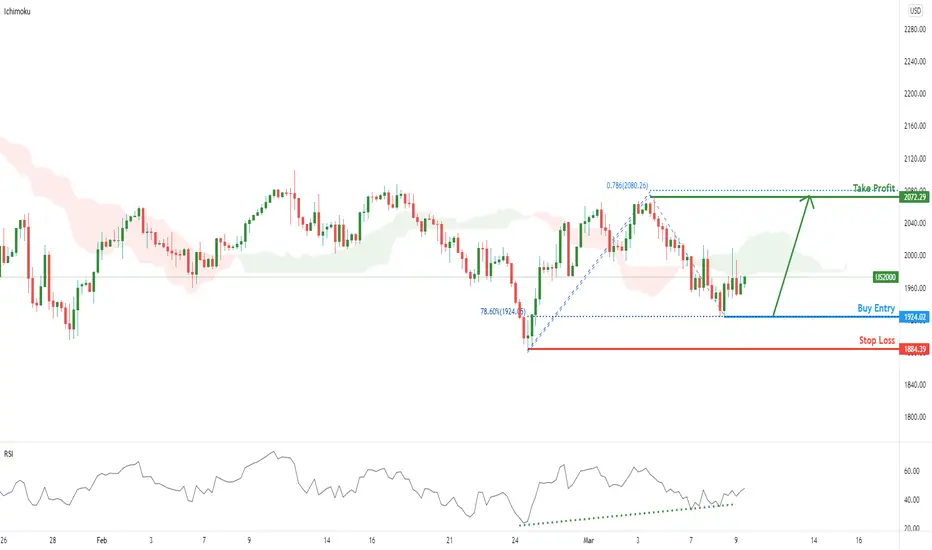
US2000 is on bullish momentum! | 9th March 2022Prices are on bullish momentum. We se the potential for a bounce from our buy entry at 1924.02 in line with 78.6% Fibonacci retracement towards our Take Profit at 2078.79 in line with 78.6% Fibonacci Projection. Our bullish bias is further supported by RSI depicting bullish momentum.
Any opinions, news, research, analyses, prices, other information, or links to third-party sites contained on this website are provided on an "as-is" basis, as general market commentary, and do not constitute investment advice. The market commentary has not been prepared in accordance with legal requirements designed to promote the independence of investment research, and it is therefore not subject to any prohibition on dealing ahead of dissemination. Although this commentary is not produced by an independent source, FXCM takes all sufficient steps to eliminate or prevent any conflicts of interest arising out of the production and dissemination of this communication. The employees of FXCM commit to acting in the clients' best interests and represent their views without misleading, deceiving, or otherwise impairing the clients' ability to make informed investment decisions. For more information about the FXCM's internal organizational and administrative arrangements for the prevention of conflicts, please refer to the Firms' Managing Conflicts Policy. Please ensure that you read and understand our Full Disclaimer and Liability provision concerning the foregoing Information, which can be accessed on the website.
Small-Caps Are Soon Looking To RallyWe have a Double Bottom at the 800 Day Simple Moving Average and at the PCZ of a Bullish ABCD and are trying to break free from a Downtrend we've been in for the last several weeks if all goes as expected we will rally towards the 200 Day Simple Moving Average up near $2,220

Russell2000 Held at 2100 Support, Counter Trend Move to 2280Trend Analysis
The main view of this trade idea is on the 15-Min Chart.
Support appears to have held at around the 2100 for the Russell 2000 Index (US2000). This is corroborated by the US2000 crossing above its medium term (195-MA) moving average. Also the Supertrend broke above its 2146 resistance above the last trading session. When observing the technical indicators there is a unique pattern on the Awesome Oscillator (AO) and the RSI. There is positive price divergence with the indicators. The AO is above 0 and the RSI is greater than 50. It is expected that US2000 rallies towards the 2280 price level. Failure of this move will be seen if US2000 declines below 2100.
The Point and Figure chart as well is showing a bullish reversal. Support is seen around 2110 and the Index rallied above its short (30-MA), medium (100-MA) and long (200-MA) moving averages. There are also positive crossovers with the short and medium as well as short and long term MAs. The AO is above 0 with the RSI trading above 50.
The longer term view remains corrective for the US2000. Resistance is observed around 2185.
Recommendation
The recommendation will be to go long at market, with a stop loss at 2100 and a target of 2280. This produces a risk/reward ratio of 1.70.
Disclaimer
The views expressed are mine and do not represent the views of my employers and business partners. Persons acting on these recommendations are doing so at their own risk. These recommendations are not a solicitation to buy or to sell but are for purely discussion purposes. At the time of publishing I have exposure to US2000.

Russell 2000| Potential Bullish Harmonic Pattern Like all the other indexes Russell 2000 made a very sharp correction.
The top of the wave is located at the beginning of November 21
and until now the price moved only lower.
We can see that the price decreased with -23%
I am expecting the price to face increase and the face the first and the
strongest resistance close to 2090.
If the price will manage to close above 2090 the next target will be 2240
Thank you and Good Luck!

Russell 2000 - Bloomberg Special small-cap stock market index (ONE TO WATCH)
TVC:RUT
RUSSELL:RUT
AMEX:IWM
CME_MINI:RTY1!
AMEX:IWO
OANDA:US2000USD
AAN
AAOI
AAON
AAT
AAWW
AAXN
ABCB
ABEO
ABG
ABM
ABTX
AC
ACA
ACAD
ACBI
ACCO
ACER
ACHN
ACIA
ACIW
ACLS
ACNB
ACOR
ACRE
ACRS
ACRX
ACTG
ADC
ADES
ADMA
ADMS
ADNT
ADRO
ADSW
ADTN
ADUS
ADVM
AEGN
AEIS
AEL
AEO
AERI
AFI
AFIN
AFMD
AGE
AGEN
AGLE
AGM
AGS
AGX
AGYS
AHH
AHT
AI
AIMC
AIMT
AIN
AIR
AIRG
AIT
AJRD
AJX
AKBA
AKCA
AKR
AKRO
AKRX
AKS
AKTS
ALBO
ALCO
ALDR
ALDX
ALE
ALEC
ALEX
ALG
ALGT
ALLK
ALLO
ALOT
ALRM
ALTM
ALTR
ALX
AMAG
AMAL
AMBA
AMBC
AMC
AMED
AMEH
AMK
AMKR
AMN
AMNB
AMOT
AMPH
AMRC
AMRS
AMRX
AMSC
AMSF
AMSWA
AMTB
AMWD
ANAB
ANDE
ANF
ANGO
ANH
ANIK
ANIP
AOBC
AOSL
APAM
APEI
APLS
APOG
APPF
APPN
APPS
APTS
APYX
AQUA
ARA
ARAY
ARCB
ARCH
ARDX
ARES
ARGO
ARI
ARL
ARLO
ARNA
AROC
AROW
ARQL
ARR
ARTNA
ARVN
ARWR
ASC
ASGN
ASIX
ASMB
ASNA
ASPS
ASRT
ASTE
AT
ATEC
ATEN
ATEX
ATGE
ATHX
ATI
ATKR
ATLO
ATNI
ATNX
ATRA
ATRC
ATRI
ATRO
ATRS
ATSG
AUB
AVA
AVAV
AVCO
AVD
AVDR
AVID
AVNS
AVRO
AVX
AVXL
AVYA
AWR
AX
AXAS
AXDX
AXE
AXGN
AXL
AXLA
AXNX
AXSM
AXTI
AYR
AZZ
B
BANC
BAND
BANF
BANR
BATRA
BATRK
BBBY
BBCP
BBIO
BBSI
BBX
BCBP
BCC
BCEI
BCEL
BCML
BCO
BCOR
BCOV
BCPC
BCRX
BDC
BDGE
BDSI
BE
BEAT
BECN
BELFB
BFC
BFIN
BFS
BFST
BGG
BGS
BGSF
BH
BHB
BHE
BHLB
BHR
BHVN
BIG
BIOS
BJ
BJRI
BKD
BKE
BKH
BL
BLBD
BLD
BLDR
BLFS
BLKB
BLMN
BLX
BMCH
BMI
BMRC
BMTC
BNED
BNFT
BOCH
BOLD
BOMN
BOOM
BOOT
BOX
BPFH
BPMC
BPRN
BRC
BREW
BRG
BRID
BRKL
BRKS
BRT
BRY
BSET
BSGM
BSIG
BSRR
BSTC
BSVN
BTAI
BTU
BUSE
BV
BWB
BWFG
BXC
BXG
BXMT
BXS
BY
BYD
BYSI
BZH
CAC
CADE
CAI
CAKE
CAL
CALA
CALM
CALX
CAMP
CAR
CARA
CARB
CARE
CARG
CARO
CARS
CASA
CASH
CASI
CASS
CATC
CATM
CATO
CATS
CATY
CBAN
CBAY
CBB
CBL
CBLK
CBM
CBMG
CBNK
CBPX
CBRL
CBTX
CBU
CBZ
CCB
CCBG
CCF
CCMP
CCNE
CCO
CCOI
CCRN
CCS
CCXI
CDE
CDLX
CDMO
CDNA
CDR
CDXC
CDXS
CDZI
CECE
CECO
CEIX
CELC
CELH
CENT
CENTA
CENX
CERC
CERS
CETV
CEVA
CFB
CFFI
CFFN
CFMS
CHAP
CHCO
CHCT
CHDN
CHEF
CHGG
CHMA
CHMG
CHMI
CHRA
CHRS
CHS
CHUY
CIA
CIO
CIR
CISN
CIVB
CIX
CJ
CKH
CKPT
CLAR
CLBK
CLCT
CLDR
CLDT
CLF
CLFD
CLI
CLNC
CLNE
CLPR
CLVS
CLW
CLXT
CMBM
CMC
CMCO
CMCT
CMLS
CMO
CMP
CMPR
CMRE
CMRX
CMTL
CNBKA
CNCE
CNDT
CNMD
CNNE
CNO
CNOB
CNR
CNS
CNSL
CNST
CNTY
CNX
CNXN
CODA
COHU
COKE
COLB
COLL
CONN
COOP
CORE
CORR
CORT
COWN
CPE
CPF
CPK
CPLG
CPRX
CPS
CPSI
CRAI
CRBP
CRC
CRCM
CRD.A
CRK
CRMD
CRMT
CRNX
CROX
CRS
CRTX
CRUS
CRVL
CRY
CRZO
CSFL
CSGS
CSII
CSLT
CSOD
CSTE
CSTL
CSTR
CSV
CSWI
CTB
CTBI
CTMX
CTO
CTRA
CTRC
CTRE
CTRN
CTS
CTSO
CTT
CTWS
CUB
CUBI
CUE
CULP
CURO
CUTR
CVA
CVBF
CVCO
CVCY
CVGI
CVGW
CVI
CVIA
CVLT
CVLY
CVM
CVRS
CVTI
CWCO
CWEN
CWEN.A
CWH
CWK
CWST
CWT
CXW
CYCN
CYH
CYRX
CYTK
CZNC
Aaron’s, Inc.
Applied Optoelectronics, Inc.
AAON, Inc.
American Assets Trust, Inc.
Atlas Air Worldwide Holdings, Inc.
Axon Enterprise, Inc.
Ameris Bancorp
Abeona Therapeutics, Inc.
Asbury Automotive Group, Inc.
ABM Industries, Inc.
Allegiance Bancshares, Inc. (Texas)
Associated Capital Group, Inc.
Arcosa, Inc.
ACADIA Pharmaceuticals, Inc.
Atlantic Capital Bancshares, Inc.
ACCO Brands Corp.
Acer Therapeutics, Inc.
Achillion Pharmaceuticals, Inc.
Acacia Communications, Inc.
ACI Worldwide, Inc.
Axcelis Technologies, Inc.
ACNB Corp.
Acorda Therapeutics, Inc.
Ares Commercial Real Estate Corp.
Aclaris Therapeutics, Inc.
AcelRx Pharmaceuticals, Inc.
Acacia Research Corp.
Agree Realty Corp.
Advanced Emissions Solutions, Inc.
ADMA Biologics, Inc.
Adamas Pharmaceuticals, Inc.
Adient plc
Aduro BioTech, Inc.
Advanced Disposal Services, Inc.
ADTRAN, Inc.
Addus HomeCare Corp.
Adverum Biotechnologies, Inc.
Aegion Corp.
Advanced Energy Industries, Inc.
American Equity Investment Life Holding Co.
American Eagle Outfitters, Inc.
Aerie Pharmaceuticals, Inc.
Armstrong Flooring, Inc.
American Finance Trust, Inc.
Affimed NV
AgeX Therapeutics, Inc.
Agenus, Inc.
Aeglea Biotherapeutics, Inc.
Federal Agricultural Mortgage Corp.
PlayAGS, Inc.
Argan, Inc.
Agilysys, Inc.
Armada Hoffler Properties, Inc.
Ashford Hospitality Trust, Inc.
Arlington Asset Investment Corp.
Altra Industrial Motion Corp.
Aimmune Therapeutics, Inc.
Albany International Corp.
AAR Corp.
Airgain, Inc.
Applied Industrial Technologies, Inc.
Aerojet Rocketdyne Holdings, Inc.
Great Ajax Corp.
Akebia Therapeutics, Inc.
Akcea Therapeutics, Inc.
Acadia Realty Trust
Akero Therapeutics, Inc.
Akorn, Inc.
AK Steel Holding Corp.
Akoustis Technologies, Inc.
Albireo Pharma, Inc.
Alico, Inc.
Alder Biopharmaceuticals, Inc.
Aldeyra Therapeutics, Inc.
ALLETE, Inc.
Alector, Inc.
Alexander & Baldwin, Inc.
Alamo Group, Inc.
Allegiant Travel Co.
Allakos, Inc.
Allogene Therapeutics, Inc.
AstroNova, Inc.
Alarm.com Holdings, Inc.
Altus Midstream Co.
Altair Engineering, Inc.
Alexander’s, Inc.
AMAG Pharmaceuticals, Inc.
Amalgamated Bank
Ambarella, Inc.
Ambac Financial Group, Inc.
AMC Entertainment Holdings, Inc.
Amedisys, Inc.
Apollo Medical Holdings, Inc.
AssetMark Financial Holdings, Inc.
Amkor Technology, Inc.
AMN Healthcare Services, Inc.
American National Bankshares, Inc. (Virginia)
Allied Motion Technologies, Inc.
Amphastar Pharmaceuticals, Inc.
Ameresco, Inc.
Amyris, Inc.
Amneal Pharmaceuticals, Inc.
American Superconductor Corp.
AMERISAFE, Inc.
American Software, Inc.
Amerant Bancorp, Inc.
American Woodmark Corp.
AnaptysBio, Inc.
The Andersons, Inc.
Abercrombie & Fitch Co.
AngioDynamics, Inc.
Anworth Mortgage Asset Corp.
Anika Therapeutics, Inc.
ANI Pharmaceuticals, Inc.
American Outdoor Brands Corp.
Alpha & Omega Semiconductor Ltd.
Artisan Partners Asset Management, Inc.
American Public Education, Inc.
Apellis Pharmaceuticals, Inc.
Apogee Enterprises, Inc.
AppFolio, Inc.
Appian Corp.
Digital Turbine, Inc.
Preferred Apartment Communities, Inc.
Apyx Medical Corp.
Evoqua Water Technologies Corp.
American Renal Associates Holdings, Inc.
Accuray, Inc.
ArcBest Corp.
Arch Coal, Inc.
Ardelyx, Inc.
Ares Management Corp.
Argo Group International Holdings Ltd.
Apollo Commercial Real Estate Finance, Inc.
American Realty Investors, Inc.
Arlo Technologies, Inc.
Arena Pharmaceuticals, Inc.
Archrock, Inc.
Arrow Financial Corp.
ArQule, Inc.
ARMOUR Residential REIT, Inc.
Artesian Resources Corp.
Arvinas, Inc.
Arrowhead Pharmaceuticals, Inc.
Ardmore Shipping Corp.
ASGN, Inc.
Advansix, Inc.
Assembly Biosciences, Inc.
Ascena Retail Group, Inc.
Altisource Portfolio Solutions SA
Assertio Therapeutics, Inc.
Astec Industries, Inc.
Atlantic Power Corp.
Alphatec Holdings, Inc.
A10 Networks, Inc.
Anterix, Inc.
Adtalem Global Education, Inc.
Athersys, Inc.
Allegheny Technologies, Inc.
Atkore International Group, Inc.
Ames National Corp.
ATN International, Inc.
Athenex, Inc.
Atara Biotherapeutics, Inc.
AtriCure, Inc.
Atrion Corp.
Astronics Corp.
Antares Pharma, Inc.
Air Transport Services Group, Inc.
Atlantic Union Bankshares Corp.
Avista Corp.
AeroVironment, Inc.
Avalon GloboCare Corp.
American Vanguard Corp.
Avedra
Avid Technology, Inc.
Avanos Medical, Inc.
Avrobio, Inc.
AVX Corp.
Anavex Life Sciences Corp.
Avaya Holdings Corp.
American States Water Co.
Axos Financial, Inc.
Abraxas Petroleum Corp.
Accelerate Diagnostics, Inc.
Anixter International, Inc.
AxoGen, Inc.
American Axle & Manufacturing Holdings
Axcella Health, Inc.
Axonics Modulation Technologies, Inc.
Axsome Therapeutics, Inc.
AXT, Inc.
Aircastle Ltd.
AZZ, Inc.
Barnes Group, Inc.
Banc of California, Inc.
Bandwidth, Inc.
BancFirst Corp. (Oklahoma)
Banner Corp.
Liberty Media Corp. Liberty Braves
Liberty Media Corp. Liberty Braves
Bed Bath & Beyond, Inc.
Concrete Pumping Holdings, Inc.
BridgeBio Pharma, Inc.
Barrett Business Services, Inc.
BBX Capital Corp.
BCB Bancorp, Inc.
Boise Cascade Co.
Bonanza Creek Energy, Inc.
Atreca, Inc.
BayCom Corp.
The Brink’s Co.
Blucora, Inc.
Brightcove, Inc.
Balchem Corp.
BioCryst Pharmaceuticals, Inc.
Belden, Inc.
Bridge Bancorp, Inc.
BioDelivery Sciences International, Inc.
Bloom Energy Corp.
BioTelemetry, Inc.
Beacon Roofing Supply, Inc.
Bel Fuse, Inc.
Bank First Corp.
BankFinancial Corp.
Saul Centers, Inc.
Business First Bancshares, Inc.
Briggs & Stratton Corp.
B&G Foods, Inc.
BG Staffing, Inc.
Biglari Holdings, Inc.
Bar Harbor Bankshares
Benchmark Electronics, Inc.
Berkshire Hills Bancorp, Inc.
Braemar Hotels & Resorts, Inc.
Biohaven Pharmaceutical Holding Co. Ltd.
Big Lots, Inc.
Option Care Health, Inc.
BJ’s Wholesale Club Holdings, Inc.
BJ’s Restaurants, Inc.
Brookdale Senior Living, Inc.
The Buckle, Inc.
Black Hills Corp.
BlackLine, Inc.
Blue Bird Corp.
TopBuild Corp.
Builders FirstSource, Inc.
BioLife Solutions, Inc.
Blackbaud, Inc.
Bloomin’ Brands, Inc.
Banco Latinoamericano de Comercio
BMC Stock Holdings, Inc.
Badger Meter, Inc.
Bank of Marin Bancorp
Bryn Mawr Bank Corp.
Barnes & Noble Education, Inc.
Benefitfocus, Inc.
Bank of Commerce Holdings
Audentes Therapeutics, Inc.
Boston Omaha Corp.
DMC Global, Inc.
Boot Barn Holdings, Inc.
Box, Inc.
Boston Private Financial Holdings, Inc.
Blueprint Medicines Corp.
The Bank of Princeton
Brady Corp.
Craft Brew Alliance, Inc.
Bluerock Residential Growth REIT, Inc.
Bridgford Foods Corp.
Brookline Bancorp, Inc.
Brooks Automation, Inc.
BRT Apartments Corp.
Berry Petroleum Corp.
Bassett Furniture Industries, Inc.
BioSig Technologies, Inc.
BrightSphere Investment Group, Inc.
Sierra Bancorp
Biospecifics Technologies Corp.
Bank7 Corp.
BioXcel Therapeutics, Inc.
Peabody Energy Corp.
First Busey Corp.
BrightView Holdings, Inc.
Bridgewater Bancshares, Inc.
Bankwell Financial Group, Inc.
BlueLinx Holdings, Inc.
Bluegreen Vacations Corp.
Blackstone Mortgage Trust, Inc.
BancorpSouth Bank
Byline Bancorp, Inc.
Boyd Gaming Corp.
BeyondSpring, Inc.
Beazer Homes USA, Inc.
Camden National Corp. (Maine)
Cadence Bancorporation
CAI International, Inc.
Cheesecake Factory, Inc.
Caleres, Inc.
Calithera Biosciences, Inc.
Cal-Maine Foods, Inc.
Calix, Inc.
CalAmp Corp.
Avis Budget Group, Inc.
CARA Therapeutics, Inc.
Carbonite, Inc.
Carter Bank & Trust
Cargurus, Inc.
Carolina Financial Corp.
Cars.com, Inc.
Casa Systems, Inc.
Meta Financial Group, Inc.
CASI Pharmaceuticals, Inc.
Cass Information Systems, Inc.
Cambridge Bancorp
Cardtronics plc
The Cato Corp.
Catasys, Inc.
Cathay General Bancorp
Colony Bankcorp, Inc.
CymaBay Therapeutics, Inc.
Cincinnati Bell, Inc.
CBL & Associates Properties, Inc.
Carbon Black, Inc. (Massachusetts)
Cambrex Corporation
Cellular Biomedicine Group, Inc.
Capital Bancorp, Inc. (Maryland)
Continental Building Products, Inc.
Cracker Barrel Old Country Store, Inc.
CBTX, Inc. (Texas)
Community Bank System, Inc.
CBIZ, Inc.
Coastal Financial Corp. (Washington)
Capital City Bank Group, Inc.
Chase Corp.
Cabot Microelectronics Corp.
CNB Financial Corp. (Pennsylvania)
Clear Channel Outdoor Holdings, Inc.
Cogent Communications Holdings, Inc.
Cross Country Healthcare, Inc.
Century Communities, Inc.
ChemoCentryx, Inc.
Coeur Mining, Inc.
Cardlytics, Inc.
Avid Bioservices, Inc.
CareDx, Inc.
Cedar Realty Trust, Inc.
Chromadex Corp.
Codexis, Inc.
Cadiz, Inc.
CECO Environmental Corp.
Career Education Corp.
CONSOL Energy, Inc.
Celcuity, Inc.
Celsius Holdings, Inc.
Central Garden & Pet Co.
Central Garden & Pet Co.
Century Aluminum Co.
Cerecor, Inc.
Cerus Corp.
Central European Media Enterprises Ltd.
CEVA, Inc.
CrossFirst Bankshares, Inc.
C&F Financial Corp.
Capitol Federal Financial, Inc.
ConforMIS, Inc.
Chaparral Energy, Inc.
City Holding Co.
Community Healthcare Trust, Inc.
Churchill Downs, Inc.
The Chefs’ Warehouse, Inc.
Chegg, Inc.
Chiasma, Inc.
Chemung Financial Corp.
Cherry Hill Mortgage Investment Corp.
Charah Solutions, Inc.
Coherus BioSciences, Inc.
Chico’s FAS, Inc.
Chuy’s Holdings, Inc.
Citizens, Inc. (Austin, Texas)
City Office REIT, Inc.
CIRCOR International, Inc.
Cision Ltd.
Civista Bancshares, Inc.
CompX International, Inc.
C&J Energy Services, Inc.
SEACOR Holdings, Inc.
Checkpoint Therapeutics, Inc.
Clarus Corp.
Columbia Financial, Inc.
Collectors Universe, Inc.
Cloudera, Inc.
Chatham Lodging Trust
Cleveland-Cliffs, Inc.
Clearfield, Inc.
Mack-Cali Realty Corp.
Colony Credit Real Estate, Inc.
Clean Energy Fuels Corp.
Clipper Realty, Inc.
Clovis Oncology, Inc.
Clearwater Paper Corp.
Calyxt, Inc.
Cambium Networks Corp.
Commercial Metals Co.
Columbus McKinnon Corp.
CIM Commercial Trust Corp.
Cumulus Media, Inc.
Capstead Mortgage Corp.
Compass Minerals International, Inc.
Cimpress Plc
Costamare Inc.
Chimerix, Inc.
Comtech Telecommunications Corp.
Century Bancorp, Inc. (Massachusetts)
Concert Pharmaceuticals, Inc.
Conduent, Inc.
CONMED Corp.
Cannae Holdings, Inc.
CNO Financial Group, Inc.
ConnectOne Bancorp, Inc.
Cornerstone Building Brands, Inc.
Cohen & Steers, Inc. (New York)
Consolidated Communications Holdings, Inc.
Constellation Pharmaceuticals, Inc.
Century Casinos, Inc.
CNX Resources Corp.
PC Connection, Inc.
Coda Octopus Group, Inc.
Cohu, Inc.
Coca-Cola Consolidated, Inc.
Columbia Banking System, Inc.
Collegium Pharmaceutical, Inc.
Conn’s, Inc.
Mr. Cooper Group, Inc.
Core-Mark Holding Co., Inc.
CorEnergy Infrastructure Trust, Inc.
Corcept Therapeutics, Inc.
Cowen, Inc.
Callon Petroleum Co.
Central Pacific Financial Corp.
Chesapeake Utilities Corp.
CorePoint Lodging, Inc.
Catalyst Pharmaceuticals, Inc.
Cooper-Standard Holdings, Inc.
Computer Programs & Systems, Inc.
CRA International, Inc.
Corbus Pharmaceuticals Holdings, Inc.
California Resources Corp.
Care.com, Inc.
Crawford & Co.
Comstock Resources, Inc.
CorMedix, Inc.
America’s Car-Mart, Inc.
Crinetics Pharmaceuticals, Inc.
Crocs, Inc.
Carpenter Technology Corp.
Cortexyme, Inc.
Cirrus Logic, Inc.
CorVel Corp.
CryoLife, Inc.
Carrizo Oil & Gas, Inc.
CenterState Bank Corp.
CSG Systems International, Inc.
Cardiovascular Systems, Inc.
Castlight Health, Inc.
Cornerstone OnDemand, Inc.
Caesarstone Ltd.
Castle Biosciences, Inc.
CapStar Financial Holdings, Inc.
Carriage Services, Inc.
CSW Industrials, Inc.
Cooper Tire & Rubber Co.
Community Trust Bancorp, Inc. (Kentucky)
CytomX Therapeutics, Inc.
Consolidated-Tomoka Land Co.
Contura Energy, Inc.
Centric Brands, Inc.
CareTrust REIT, Inc.
Citi Trends, Inc.
CTS Corp.
CytoSorbents Corp.
CatchMark Timber Trust, Inc.
Connecticut Water Service, Inc.
Cubic Corp.
Customers Bancorp, Inc.
Cue Biopharma, Inc.
Culp, Inc.
CURO Group Holdings Corp.
Cutera, Inc.
Covanta Holding Corp.
CVB Financial Corp.
Cavco Industries, Inc.
Central Valley Community Bancorp
Commercial Vehicle Group, Inc.
Calavo Growers, Inc.
CVR Energy, Inc.
Covia Holdings Corp.
Commvault Systems, Inc.
Codorus Valley Bancorp, Inc.
CEL-SCI Corp.
Corindus Vascular Robotics, Inc.
Covenant Transportation Group, Inc.
Consolidated Water Co. Ltd.
Clearway Energy, Inc.
Clearway Energy, Inc.
Camping World Holdings, Inc.
Cushman & Wakefield Plc
Casella Waste Systems, Inc.
California Water Service Group
CoreCivic, Inc.
Cyclerion Therapeutics, Inc.
Community Health Systems, Inc.
CryoPort, Inc.
Cytokinetics, Inc.
Citizens & Northern Corp.
Russell 2000 Stocks List (D-K)
DAKT
DAN
DAR
DBD
DBI
DCO
DCOM
DCPH
DDD
DDS
DEA
DECK
DENN
DERM
DF
DFIN
DGICA
DGII
DHIL
DHT
DHX
DIN
DIOD
DJCO
DK
DLA
DLTH
DLX
DMRC
DNBF
DNLI
DNOW
DNR
DO
DOC
DOMO
DOOR
DORM
DOVA
DPLO
DRH
DRNA
DRQ
DS
DSKE
DSPG
DSSI
DTIL
DVAX
DX
DXPE
DY
DZSI
EAT
EB
EBF
EBIX
EBS
EBSB
EBTC
ECHO
ECOL
ECOM
ECOR
ECPG
EDIT
EE
EEX
EFC
EFSC
EGAN
EGBN
EGHT
EGLE
EGOV
EGP
EGRX
EHTH
EIDX
EIG
EIGI
EIGR
ELF
ELOX
ELVT
ELY
EME
EML
ENDP
ENFC
ENOB
ENPH
ENS
ENSG
ENTA
ENV
ENVA
ENZ
EOLS
EPAY
EPC
EPM
EPRT
EPZM
EQBK
ERA
ERI
ERII
EROS
ESCA
ESE
ESGR
ESNT
ESPR
ESQ
ESSA
ESTE
ESXB
ETH
ETM
EVBG
EVBN
EVC
EVER
EVFM
EVH
EVI
EVLO
EVOP
EVRI
EVTC
EXLS
EXPI
EXPO
EXPR
EXTN
EXTR
EYE
EYPT
EZPW
FARM
FARO
FATE
FBC
FBIZ
FBK
FBM
FBMS
FBNC
FBP
FC
FCAP
FCBC
FCBP
FCCY
FCF
FCFS
FCN
FCPT
FDBC
FDEF
FDP
FELE
FET
FF
FFBC
FFG
FFIC
FFIN
FFNW
FFWM
FG
FGBI
FGEN
FI
FIBK
FII
FISI
FIT
FIVN
FIX
FIXX
FIZZ
FLDM
FLIC
FLMN
FLNT
FLOW
FLWS
FLXN
FLXS
FMAO
FMBH
FMBI
FMNB
FN
FNCB
FNHC
FNKO
FNLC
FNWB
FOCS
FOE
FOLD
FOR
FORM
FORR
FOSL
FOXF
FPI
FPRX
FR
FRAC
FRAF
FRBA
FRBK
FRGI
FRME
FRPH
FRPT
FRTA
FSB
FSBW
FSCT
FSP
FSS
FSTR
FTK
FTR
FTSI
FTSV
FUL
FULC
FULT
FVCB
FWRD
GABC
GAIA
GALT
GATX
GBCI
GBL
GBLI
GBT
GBX
GCAP
GCBC
GCI
GCO
GCP
GDEN
GDOT
GDP
GEF
GEF.B
GEN
GENC
GEO
GEOS
GERN
GES
GFF
GFN
GHDX
GHL
GHM
GIII
GKOS
GLDD
GLNG
GLOG
GLRE
GLT
GLUU
GLYC
GME
GMED
GMRE
GMS
GNC
GNE
GNK
GNL
GNLN
GNMK
GNRC
GNTY
GNW
GOGO
GOLF
GOOD
GORO
GOSS
GPI
GPMT
GPOR
GPRE
GPRO
GPX
GRBK
GRC
GRIF
GRPN
GRTS
GSBC
GSHD
GSIT
GTHX
GTLS
GTN
GTS
GTT
GTY
GTYH
GVA
GWB
GWGH
GWRS
HA
HABT
HAE
HAFC
HALL
HALO
HARP
HASI
HAYN
HBB
HBCP
HBMD
HBNC
HCAT
HCC
HCCI
HCI
HCKT
HCSG
HEES
HELE
HFFG
HFWA
HI
HIBB
HIFS
HIIQ
HL
HLI
HLIO
HLIT
HLNE
HLX
HMHC
HMN
HMST
HMSY
HMTV
HNGR
HNI
HNRG
HOFT
HOMB
HOME
HONE
HOOK
HOPE
HPR
HQY
HR
HRI
HRTG
HRTX
HSC
HSII
HSKA
HSTM
HT
HTBI
HTBK
HTH
HTLD
HTLF
HTZ
HUBG
HUD
HURC
HURN
HVT
HWBK
HWC
HWKN
HY
HZO
I
IBCP
IBKC
IBOC
IBP
IBTX
ICD
ICFI
ICHR
ICPT
IDCC
IDEX
IDT
IESC
IHC
III
IIIN
IIIV
IIN
IIPR
IIVI
ILPT
IMAX
IMGN
IMKTA
IMMR
IMMU
IMXI
INBK
INDB
INFN
INGN
INN
INO
INOV
INS
INSE
INSG
INSM
INSP
INST
INSW
INT
INTL
INVA
INWK
IOSP
IOTS
IOVA
IPAR
IPHI
IPHS
IPI
IRBT
IRDM
IRET
IRMD
IRT
IRTC
IRWD
ISBC
ISCA
ISRL
ISTR
ITCI
ITGR
ITI
ITIC
ITRI
IVC
IVR
JACK
JAG
JAX
JBSS
JBT
JCAP
JCOM
JCP
JELD
JILL
JJSF
JNCE
JOE
JOUT
JRVR
JYNT
KAI
KALA
KALU
KALV
KAMN
KBAL
KBH
KBR
KDMN
KE
KELYA
KEM
KFRC
KFY
KIDS
KIN
KLDO
KLXE
KMT
KN
KNL
KNSA
KNSL
KOD
KOP
KPTI
KRA
KREF
KRG
KRNY
KRO
KRTX
KRUS
KRYS
KTB
KTOS
KURA
KVHI
KW
KWR
KZR
Daktronics, Inc.
Dana, Inc.
Darling Ingredients, Inc.
Diebold Nixdorf, Inc.
Designer Brands, Inc.
Ducommun, Inc.
Dime Community Bancshares, Inc.
Deciphera Pharmaceuticals, Inc.
3D Systems Corp.
Dillard’s, Inc.
Easterly Government Properties, Inc.
Deckers Outdoor Corp.
Denny’s Corp.
Dermira, Inc.
Dean Foods Co.
Donnelley Financial Solutions, Inc.
Donegal Group, Inc.
Digi International, Inc.
Diamond Hill Investment Group, Inc.
DHT Holdings, Inc.
DHI Group, Inc.
Dine Brands Global, Inc.
Diodes, Inc.
Daily Journal Corp.
Delek US Holdings, Inc.
Delta Apparel, Inc.
Duluth Holdings, Inc.
Deluxe Corp.
Digimarc Corp.
DNB Financial Corporation
Denali Therapeutics, Inc.
NOW, Inc.
Denbury Resources, Inc.
Diamond Offshore Drilling, Inc.
Physicians Realty Trust
Domo, Inc.
Masonite International Corp.
Dorman Products, Inc.
Dova Pharmaceuticals, Inc.
Diplomat Pharmacy, Inc.
DiamondRock Hospitality Co.
Dicerna Pharmaceuticals, Inc.
Dril-Quip, Inc.
Drive Shack, Inc.
Daseke, Inc.
DSP Group, Inc.
Diamond S Shipping, Inc.
Precision BioSciences, Inc.
Dynavax Technologies Corp.
Dynex Capital, Inc.
DXP Enterprises, Inc.
Dycom Industries, Inc.
DASAN Zhone Solutions Inc.
Brinker International, Inc.
Eventbrite, Inc.
Ennis, Inc.
Ebix, Inc.
Emergent BioSolutions, Inc.
Meridian Bancorp, Inc.
Enterprise Bancorp, Inc.
Echo Global Logistics, Inc.
US Ecology, Inc.
ChannelAdvisor Corp.
electroCore, Inc.
Encore Capital Group, Inc.
Editas Medicine, Inc.
El Paso Electric Co.
Emerald Holding, Inc.
Ellington Financial, Inc.
Enterprise Financial Services Corp.
eGain Corp.
Eagle Bancorp, Inc. (Maryland)
8×8, Inc.
Eagle Bulk Shipping, Inc.
NIC, Inc.
EastGroup Properties, Inc.
Eagle Pharmaceuticals, Inc.
eHealth, Inc.
Eidos Therapeutics, Inc.
Employers Holdings, Inc.
Endurance International Group
Eiger BioPharmaceuticals, Inc.
e.l.f. Beauty, Inc.
Eloxx Pharmaceuticals, Inc.
Elevate Credit, Inc.
Callaway Golf Co.
EMCOR Group, Inc.
The Eastern Co.
Endo International Plc
Entegra Financial Corp.
Enochian Biosciences, Inc.
Enphase Energy, Inc.
EnerSys
The Ensign Group, Inc.
Enanta Pharmaceuticals, Inc.
Envestnet, Inc.
Enova International, Inc.
Enzo Biochem, Inc.
Evolus, Inc.
Bottomline Technologies, Inc.
Edgewell Personal Care Co.
Evolution Petroleum Corp.
Essential Properties Realty Trust, Inc.
Epizyme, Inc.
Equity Bancshares, Inc.
Era Group, Inc.
Eldorado Resorts, Inc.
Energy Recovery, Inc.
Eros International Plc
Escalade, Inc.
ESCO Technologies, Inc.
Enstar Group Ltd.
Essent Group Ltd.
Esperion Therapeutics, Inc.
Esquire Financial Holdings, Inc.
ESSA Bancorp, Inc.
Earthstone Energy, Inc.
Community Bankers Trust Corp.
Ethan Allen Interiors, Inc.
Entercom Communications Corp.
Everbridge, Inc.
Evans Bancorp, Inc.
Entravision Communications Corp.
EverQuote, Inc.
Evofem Biosciences, Inc.
Evolent Health, Inc.
EVI Industries, Inc.
Evelo Biosciences, Inc.
EVO Payments, Inc.
Everi Holdings, Inc.
EVERTEC, Inc.
ExlService Holdings, Inc.
eXp World Holdings, Inc.
Exponent, Inc.
Express, Inc.
Exterran Corp.
Extreme Networks, Inc.
National Vision Holdings, Inc.
EyePoint Pharmaceuticals, Inc.
EZCORP, Inc.
Farmer Brothers Co.
FARO Technologies, Inc.
Fate Therapeutics, Inc.
Flagstar Bancorp, Inc.
First Business Financial Services, Inc.
FB Financial Corp.
Foundation Building Materials, Inc.
The First Bancshares, Inc. (Mississippi)
First Bancorp (North Carolina)
First BanCorp (Puerto Rico)
Franklin Covey Co.
First Capital, Inc.
First Community Bancshares, Inc. (Virginia)
First Choice Bancorp (California)
1st Constitution Bancorp
First Commonwealth Financial Corp.
FirstCash, Inc.
FTI Consulting, Inc.
Four Corners Property Trust, Inc.
Fidelity D&D Bancorp, Inc.
First Defiance Financial Corp.
Fresh Del Monte Produce, Inc.
Franklin Electric Co., Inc.
Forum Energy Technologies, Inc.
FutureFuel Corp.
First Financial Bancorp (Ohio)
FBL Financial Group, Inc.
Flushing Financial Corp.
First Financial Bankshares, Inc.
First Financial Northwest, Inc.
First Foundation, Inc.
FGL Holdings
First Guaranty Bancshares, Inc.
FibroGen, Inc.
Frank’s International NV
First Interstate BancSystem, Inc. (Montana)
Federated Investors, Inc.
Financial Institutions, Inc.
Fitbit, Inc.
Five9, Inc.
Comfort Systems USA, Inc.
Homology Medicines, Inc.
National Beverage Corp.
Fluidigm Corp.
The First of Long Island Corp.
Falcon Minerals Corp.
Fluent, Inc.
SPX Flow, Inc.
1-800-FLOWERS.COM, Inc.
Flexion Therapeutics, Inc.
Flexsteel Industries, Inc.
Farmers & Merchants Bancorp, Inc. (Ohio)
First Mid Bancshares, Inc.
First Midwest Bancorp, Inc. (Illinois)
Farmers National Banc Corp.
Fabrinet
FNCB Bancorp, Inc.
FedNat Holding Co.
Funko, Inc.
The First Bancorp, Inc. (Maine)
First Northwest Bancorp (Washington)
Focus Financial Partners, Inc.
Ferro Corp.
Amicus Therapeutics, Inc.
Forestar Group, Inc.
FormFactor, Inc.
Forrester Research, Inc.
Fossil Group, Inc.
Fox Factory Holding Corp.
Farmland Partners, Inc.
Five Prime Therapeutics, Inc.
First Industrial Realty Trust, Inc.
Keane Group, Inc.
Franklin Financial Services Corp.
First Bank (Hamilton, New Jersey)
Republic First Bancorp, Inc.
Fiesta Restaurant Group, Inc.
First Merchants Corp. (Indiana)
FRP Holdings, Inc.
Freshpet Inc.
Forterra, Inc.
Franklin Financial Network, Inc.
FS Bancorp, Inc.
ForeScout Technologies, Inc.
Franklin Street Properties Corp.
Federal Signal Corp.
L.B. Foster Co.
Flotek Industries, Inc.
Frontier Communications Corp.
FTS International, Inc.
Forty Seven, Inc.
H.B. Fuller Co.
Fulcrum Therapeutics, Inc.
Fulton Financial Corp.
FVCBankcorp, Inc.
Forward Air Corp.
German American Bancorp, Inc.
Gaia, Inc.
Galectin Therapeutics, Inc.
GATX Corp.
Glacier Bancorp, Inc.
GAMCO Investors, Inc.
Global Indemnity Ltd.
Global Blood Therapeutics, Inc.
Greenbrier Cos., Inc.
GAIN Capital Holdings, Inc.
Greene County Bancorp, Inc.
Gannett Co., Inc.
Genesco, Inc.
GCP Applied Technologies, Inc.
Golden Entertainment, Inc.
Green Dot Corp.
Goodrich Petroleum Corp.
Greif, Inc.
Greif, Inc.
Genesis Healthcare, Inc.
Gencor Industries, Inc.
The GEO Group, Inc.
Geospace Technologies Corp.
Geron Corp.
Guess?, Inc.
Griffon Corp.
General Finance Corp.
Genomic Health, Inc.
Greenhill & Co., Inc.
Graham Corp.
G-III Apparel Group Ltd.
Glaukos Corp.
Great Lakes Dredge & Dock Corp.
Golar LNG Ltd.
GasLog Ltd.
Greenlight Capital Re Ltd.
P.H. Glatfelter Co.
Glu Mobile, Inc.
GlycoMimetics, Inc.
GameStop Corp.
Globus Medical, Inc.
Global Medical REIT, Inc.
GMS, Inc.
GNC Holdings, Inc.
Genie Energy Ltd.
Genco Shipping & Trading Ltd.
Global Net Lease, Inc.
Greenlane Holdings, Inc.
GenMark Diagnostics, Inc.
Generac Holdings, Inc.
Guaranty Bancshares, Inc. (Texas)
Genworth Financial, Inc.
Gogo, Inc.
Acushnet Holdings Corp.
Gladstone Commercial Corp.
Gold Resource Corp.
Gossamer Bio, Inc.
Group 1 Automotive, Inc.
Granite Point Mortgage Trust, Inc.
Gulfport Energy Corp.
Green Plains, Inc.
GoPro, Inc.
GP Strategies Corp.
Green Brick Partners, Inc.
The Gorman-Rupp Co.
Griffin Industrial Realty, Inc.
Groupon, Inc.
Gritstone Oncology, Inc.
Great Southern Bancorp, Inc. (Missouri)
Goosehead Insurance, Inc.
GSI Technology, Inc.
G1 Therapeutics, Inc.
Chart Industries, Inc.
Gray Television, Inc.
Triple-S Management Corp.
GTT Communications, Inc.
Getty Realty Corp.
GTY Technology Holdings, Inc.
Granite Construction, Inc.
Great Western Bancorp, Inc. (South Dakota)
GWG Holdings, Inc.
Global Water Resources, Inc.
Hawaiian Holdings, Inc.
The Habit Restaurants, Inc.
Haemonetics Corp.
Hanmi Financial Corp.
Hallmark Financial Services, Inc.
Halozyme Therapeutics, Inc.
Harpoon Therapeutics, Inc.
Hannon Armstrong Sustainable Infrastructure
Haynes International, Inc.
Hamilton Beach Brands Holding Co.
Home Bancorp, Inc.
Howard Bancorp, Inc. (Maryland)
Horizon Bancorp, Inc. (Indiana)
Health Catalyst, Inc.
Warrior Met Coal, Inc.
Heritage-Crystal Clean, Inc.
HCI Group, Inc.
The Hackett Group, Inc.
Healthcare Services Group, Inc.
H&E Equipment Services, Inc.
Helen of Troy Ltd.
HF Foods Group, Inc.
Heritage Financial Corp. (Washington)
Hillenbrand, Inc.
Hibbett Sports, Inc.
Hingham Institution for Savings
Health Insurance Innovations, Inc.
Hecla Mining Co.
Houlihan Lokey, Inc.
Helios Technologies, Inc.
Harmonic, Inc.
Hamilton Lane, Inc.
Helix Energy Solutions Group, Inc.
Houghton Mifflin Harcourt Co.
Horace Mann Educators Corp.
HomeStreet, Inc.
HMS Holdings Corp.
Hemisphere Media Group, Inc.
Hanger, Inc.
HNI Corp.
Hallador Energy Co.
Hooker Furniture Corp.
Home Bancshares, Inc. (Arkansas)
At Home Group, Inc.
HarborOne Bancorp, Inc.
HOOKIPA Pharma, Inc.
Hope Bancorp, Inc.
HighPoint Resources Corp.
HealthEquity, Inc.
Healthcare Realty Trust, Inc.
Herc Holdings, Inc.
Heritage Insurance Holdings, Inc.
Heron Therapeutics, Inc.
Harsco Corp.
Heidrick & Struggles International, Inc.
Heska Corp.
HealthStream, Inc.
Hersha Hospitality Trust
HomeTrust Bancshares, Inc.
Heritage Commerce Corp.
Hilltop Holdings, Inc.
Heartland Express, Inc.
Heartland Financial USA, Inc.
Hertz Global Holdings, Inc.
Hub Group, Inc.
Hudson Ltd.
Hurco Cos., Inc.
Huron Consulting Group, Inc.
Haverty Furniture Cos., Inc.
Hawthorn Bancshares, Inc.
Hancock Whitney Corp.
Hawkins, Inc.
Hyster-Yale Materials Handling, Inc.
MarineMax, Inc.
Intelsat SA
Independent Bank Corp. (Michigan)
IBERIABANK Corp.
International Bancshares Corp.
Installed Building Products, Inc.
Independent Bank Group, Inc.
Independence Contract Drilling, Inc.
ICF International, Inc.
Ichor Holdings Ltd.
Intercept Pharmaceuticals, Inc.
InterDigital, Inc.
Ideanomics, Inc.
IDT Corp.
IES Holdings, Inc.
Independence Holding Co.
Information Services Group, Inc.
Insteel Industries, Inc.
i3 Verticals, Inc.
Intricon Corp.
Innovative Industrial Properties, Inc.
II-VI, Inc.
Industrial Logistics Properties Trust
IMAX Corp.
ImmunoGen, Inc.
Ingles Markets, Inc.
Immersion Corp.
Immunomedics, Inc.
International Money Express, Inc.
First Internet Bancorp
Independent Bank Corp. (Massachusetts)
Infinera Corp.
Inogen, Inc.
Summit Hotel Properties, Inc.
Inovio Pharmaceuticals, Inc.
Inovalon Holdings, Inc.
Intelligent Systems Corp.
Inspired Entertainment, Inc.
Inseego Corp.
Insmed, Inc.
Inspire Medical Systems, Inc.
Instructure, Inc.
International Seaways, Inc.
World Fuel Services Corp.
INTL FCStone, Inc.
Innoviva, Inc.
InnerWorkings, Inc.
Innospec, Inc.
Adesto Technologies Corp.
Iovance Biotherapeutics, Inc.
Inter Parfums, Inc.
Inphi Corp.
Innophos Holdings, Inc.
Intrepid Potash, Inc.
iRobot Corp.
Iridium Communications, Inc.
Investors Real Estate Trust
IRadimed Corp.
Independence Realty Trust, Inc.
iRhythm Technologies, Inc.
Ironwood Pharmaceuticals, Inc.
Investors Bancorp, Inc. (New Jersey)
International Speedway Corp.
Isramco, Inc.
Investar Holding Corp.
Intra-Cellular Therapies, Inc.
Integer Holdings Corp.
Iteris, Inc.
Investors Title Co.
Itron, Inc.
Invacare Corp.
Invesco Mortgage Capital, Inc.
Jack in the Box, Inc.
Jagged Peak Energy, Inc.
J. Alexander’s Holdings, Inc.
John B. Sanfilippo & Son, Inc.
John Bean Technologies Corp.
Jernigan Capital, Inc.
j2 Global, Inc.
J. C. Penney Co., Inc.
JELD-WEN Holding, Inc.
J.Jill, Inc.
J&J Snack Foods Corp.
Jounce Therapeutics, Inc.
The St. Joe Co.
Johnson Outdoors, Inc.
James River Group Holdings Ltd.
The Joint Corp. (United States)
Kadant, Inc.
Kala Pharmaceuticals, Inc.
Kaiser Aluminum Corp.
KalVista Pharmaceuticals, Inc.
Kaman Corp.
Kimball International, Inc.
KB Home
KBR, Inc.
Kadmon Holdings, Inc.
Kimball Electronics, Inc.
Kelly Services, Inc.
KEMET Corp.
Kforce, Inc.
Korn Ferry
OrthoPediatrics Corp.
Kindred Biosciences, Inc.
Kaleido Biosciences, Inc.
KLX Energy Services Holdings, Inc.
Kennametal, Inc.
Knowles Corp.
Knoll, Inc.
Kiniksa Pharmaceuticals Ltd.
Kinsale Capital Group, Inc.
Kodiak Sciences, Inc.
Koppers Holdings, Inc.
Karyopharm Therapeutics, Inc.
Kraton Corp.
KKR Real Estate Finance Trust, Inc.
Kite Realty Group Trust
Kearny Financial Corp.
Kronos Worldwide, Inc.
Karuna Therapeutics, Inc.
Kura Sushi USA, Inc.
Krystal Biotech, Inc.
Kontoor Brands, Inc.
Kratos Defense & Security Solutions, Inc.
Kura Oncology, Inc.
KVH Industries, Inc. (Delaware)
Kennedy-Wilson Holdings, Inc.
Quaker Chemical Corp.
Kezar Life Sciences, Inc.
Russell 2000 Stocks List (L-R)
LAD
LADR
LANC
LAND
LASR
LAUR
LAWS
LBAI
LBC
LBRT
LC
LCI
LCII
LCNB
LCTX
LCUT
LDL
LE
LEAF
LEE
LEGH
LEVL
LFVN
LGIH
LGND
LHCG
LILA
LILAK
LIND
LITE
LIVN
LIVX
LJPC
LKFN
LKSD
LL
LLNW
LMAT
LMNR
LMNX
LNDC
LNN
LNTH
LOB
LOCO
LOGC
LORL
LOVE
LPG
LPI
LPSN
LPX
LQDA
LQDT
LRN
LSCC
LTC
LTHM
LTRPA
LTS
LTXB
LVGO
LXFR
LXP
LXRX
LXU
LZB
MANT
MATW
MATX
MAXR
MBI
MBII
MBIN
MBIO
MBUU
MBWM
MC
MCB
MCBC
MCFT
MCHX
MCRB
MCRI
MCRN
MCS
MDC
MDCA
MDCO
MDGL
MDP
MDR
MDRX
MEC
MED
MEDP
MEET
MEI
MEIP
MESA
METC
MFIN
MFNC
MFSF
MG
MGEE
MGLN
MGNX
MGPI
MGRC
MGTA
MGTX
MGY
MHO
MIK
MINI
MIRM
MITK
MITT
MJCO
MLAB
MLHR
MLI
MLND
MLP
MLR
MLVF
MMAC
MMI
MMS
MMSI
MNK
MNKD
MNLO
MNOV
MNR
MNRL
MNRO
MNSB
MNTA
MOBL
MOD
MODN
MOFG
MOG.A
MORF
MOV
MPAA
MPB
MPX
MR
MRC
MRCY
MRKR
MRLN
MRNS
MRSN
MRTN
MRTX
MSA
MSBI
MSEX
MSGN
MSON
MSTR
MTDR
MTEM
MTH
MTOR
MTRN
MTRX
MTSC
MTSI
MTW
MTX
MTZ
MUSA
MVBF
MWA
MXL
MYE
MYGN
MYOK
MYRG
NANO
NAT
NATH
NATR
NAV
NBEV
NBHC
NBN
NBR
NBTB
NC
NCBS
NCI
NCMI
NCSM
NDLS
NE
NEO
NEOG
NERV
NESR
NEWM
NEXT
NFBK
NG
NGHC
NGM
NGS
NGVC
NGVT
NHC
NHI
NINE
NJR
NKSH
NL
NMIH
NMRK
NNBR
NNI
NODK
NOG
NOVA
NOVT
NP
NPK
NPO
NPTN
NR
NRC
NRCG
NRIM
NSA
NSIT
NSP
NSSC
NSTG
NTB
NTCT
NTGN
NTGR
NTLA
NTRA
NTUS
NUVA
NVAX
NVCR
NVEC
NVEE
NVRO
NVTA
NWBI
NWE
NWFL
NWLI
NWN
NWPX
NX
NXGN
NXRT
NXTC
NYMT
NYNY
OAS
OBNK
OCFC
OCN
OCUL
OCX
ODC
ODP
ODT
OEC
OFG
OFIX
OFLX
OGS
OII
OIS
OLBK
OLP
OMCL
OMER
OMI
OMN
ONB
ONCE
ONDK
OOMA
OPB
OPBK
OPI
OPK
OPRX
OPTN
OPY
ORA
ORBC
ORC
ORGO
ORIT
ORRF
OSBC
OSG
OSIS
OSMT
OSPN
OSTK
OSUR
OSW
OTTR
OVBC
OVLY
OXM
PACB
PACD
PAHC
PAR
PARR
PATK
PAYS
PBFS
PBH
PBI
PBIP
PBPB
PBYI
PCB
PCH
PCRX
PCSB
PCYO
PDCE
PDCO
PDFS
PDLB
PDLI
PDM
PEB
PEBK
PEBO
PEGI
PEI
PENN
PETQ
PETS
PFBC
PFBI
PFGC
PFIS
PFNX
PFS
PFSI
PGC
PGNX
PGTI
PHAS
PHR
PHUN
PHX
PI
PICO
PIRS
PJC
PJT
PKBK
PKD
PKE
PKOH
PLAB
PLAY
PLCE
PLMR
PLOW
PLPC
PLSE
PLT
PLUG
PLUS
PLXS
PMBC
PMT
PNM
PNRG
PNTG
POL
POR
POWI
POWL
PPBI
PQG
PRA
PRAA
PRFT
PRGS
PRGX
PRIM
PRK
PRLB
PRMW
PRNB
PRO
PROS
PROV
PRPL
PRSC
PRSP
PRTA
PRTH
PRTK
PRTY
PRVL
PSB
PSDO
PSMT
PSN
PSNL
PTCT
PTE
PTGX
PTLA
PTN
PTSI
PTVCB
PUB
PUMP
PVAC
PVBC
PWOD
PYX
PZN
PZZA
QADA
QCRH
QDEL
QEP
QLYS
QNST
QTRX
QTS
QTWO
QUAD
QUOT
RAD
RAMP
RARE
RARX
RAVN
RBB
RBBN
RBCAA
RBNC
RC
RCII
RCKT
RCKY
RCM
RCUS
RDFN
RDI
RDN
RDNT
RDUS
REAL
RECN
REGI
REI
REPH
REPL
RES
RESI
RETA
REV
REVG
REX
REXR
RFL
RGCO
RGEN
RGNX
RGR
RGS
RH
RHP
RICK
RIGL
RILY
RLGT
RLGY
RLH
RLI
RLJ
RM
RMAX
RMBI
RMBS
RMNI
RMR
RMTI
RNET
RNST
ROAD
ROAN
ROCK
ROG
ROIC
ROLL
ROSE
RPD
RPT
RRBI
RRD
RRGB
RRR
RRTS
RST
RTEC
RTIX
RTRX
RTW
RUBI
RUBY
RUN
RUSHA
RUSHB
RUTH
RVI
RVNC
RVSB
RWT
RXN
RYAM
RYI
RYTM
