FISHY moves in the STOCKMARKETHey tradomaniacs,
Current markets mood is harder to indentify as we see the same cashflow like we`ve seen with the first vaccine-wave this year.
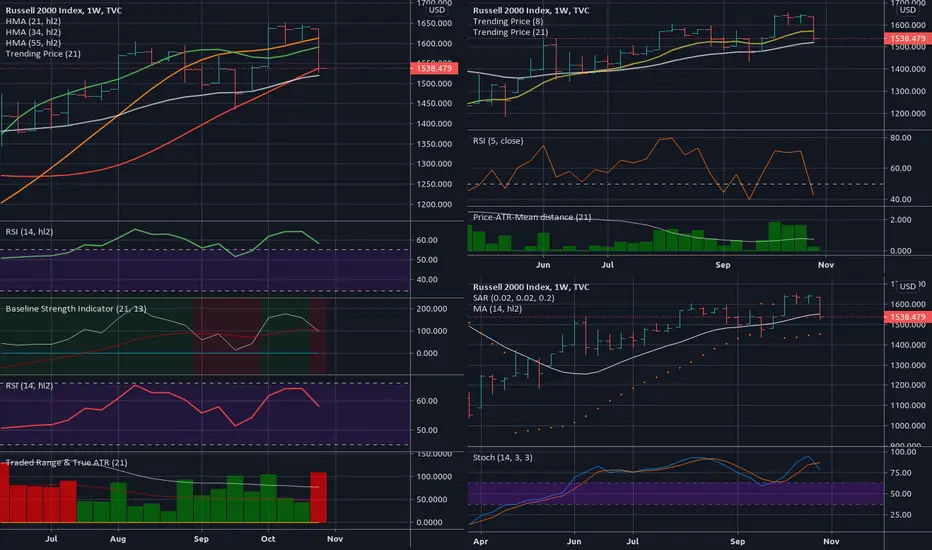
Comparing RUSSELL 2000 and SPX500 it looks like we see a flow out of big companies into the small-cap-section.
This is very weird as the small businesses were those who suffered the most during the COVID-Lockdown in the USA.
Does the market expect a BOOM of these companies with the upcoming vaccine?
There is one fact:
More than 50% of these companies listed in RUSSELL are not making any profit 👉 They are the "zombies" of the market who are only able to survive due to financial injections by the central bank.
These odd moves are forcing me to trade a bit less as I don`t think that institutional traders are willing to buy stocks of companies that only just able to buoy up.
Sell off coming soon?
LEAVE A LIKE AND A COMMENT - I appreciate every support! =)
Peace and good trades
Irasor
Wanna see more? Don`t forget to follow me.
Any questions? PM me. :-)
US2000 trade ideas

OPENING (IRA): RUT DECEMBER 24TH 1450/1500 SHORT PUT VERTICAL... for a 5.00 credit.
Notes: Selling 45 days 'til expiry premium in the broad market instrument with highest 30-day implied. Manage at 50% max, 2 x credit received.

Russ2000 mooningRuss2000 recover at a much more rapid pace than SPY from Sept, broke out from its October high and Feb highs before COVID-19
200SMA has flattened and 50/100SMAs are both sharply pointing up, expecting w/ the PFE vaccine news, we can expect a very bullish run from Russ2000, outperforming the other 3 major indices.


RUT Russell - important days & TheBigDrop (February 9th 2021)
Russell (RUT, IWM) index could be just finishing end of a HEAD of a major H&S pattern
major trend should be turning DOWN from now - SHORTS from now for few next days
but still keeping on high levels with many ZIG/ZAG patterns
moving towards main low levels likely at around February 9th

Russell2000 - Trouble ahead ! Shorts recommendedLooking at the other indexes, I have to favor the Flat count on this one.
I don't believe to be in a 1,2 / i,ii situation but it's still a valid option just as a potential Diagonal count !
But in both cases price needs to remain above invalidation level !
Shorting is the best option for now.
For non-elliottitians :
Idealized chart :
Other indexes are at similiar position.

RUT - crazy idea -Veterans Day and TWO MINUTES OF SILENCE spike?
tomorrow 11am - Veterans Day and TWO MINUTES OF SILENCE
is it meaning ATH (1818) on Russel another 7% spike?
making double top and slide DOWN???

RUT Russell ATH 1817 - a FINAL top of massive H&S - SHORT time!
today massive spike +7% to 1817.703 ATH on Russell - the middle of big H&S structure and major trend reversal towards the BIG DROP!
1817 beginnings of FED - the Second Bank of the United States founded
important days for H&S pattern in the chart


RUSSELL 2000. 3 Drive Pattern. Russell has ben leading recently and is getting close to ATHs again.
I'm looking for a turn near the 17oo Double top area, But if it gets there it is likely to take out the top before a reversal lower.
A 3 drive can be the end of a trend.
Watching this one with smaller TFs to get entries.


RUT End Of Week Evaluation*** Comments prior to evaluation summary ***
Orion:4Sight Range for coming week: 1633.14 - 1740.65 (Mean: 1686.90)
NOT A POLITICAL MESSAGE, JUST LOOKING AT ECONOMIC/FINANCIAL SITUATION.
Last week saw a 126.26 point run-up, 169% the weekly average.
News sources say this was due to a potential win by President Elect Biden.
Was it? Perhaps it was because earlier President Trump was leading in the battleground states?
Could we see an equally or lesser sell-off this week? Why?
This is the tax situation facing corporations in 2021/2022 with President-Elect Biden.
Raising the corporate tax rate to 28 percent.
Requiring a true minimum tax on ALL foreign earnings of United States companies located overseas so that we do our part to put an end to the global race to the bottom that rewards global tax havens. This will be 21% — TWICE the rate of the Trump offshoring tax rate and will apply to all income.
Imposing a tax penalty on corporations that ship jobs overseas in order to sell products back to America.
Imposing a 15% minimum tax on book income so that no corporation gets away with paying no taxes.
Raising the top individual income rate back to 39.6 percent.
Asking those making more than $1 million to pay the same rate on investment income that they do on their wages.
(Source: joebiden.com)
It will be interesting to see the futures market on Monday.
Trend Analysis:
The current trend is defined by the last price and it's relationship to specific moving averages.
Check the MA strategy for more specific suggestions.
Weekly: The relationship to the primary trend MA is bullish. The price in relationship to the other averages suggest long positions
Price Action:
Weekly: The average price range currently is 74.42 points/ticks/pips. Prices are currently 1.56x the normal trading range. Prices are trading within the mean range for activity. This generally indicates a healthy trading range.
Prices are currently caught in consolidation between 1526.22 and 1652.05.
While in consolidation the trade range may decrease to 45.732 points/ticks/pips.
Standard Deviation
Weekly: Standard deviation suggests a range from 1574.54 to 1713.77 for the following week.
Calculated Price Strength:
The strength of the trend in conjunction with specific averages.
News announcements can change the strength and directional attitude.
Weekly: Trend strength suggests trading between a range of 1606.95 to 1690.15 for the following week.
Price Projection:
The price action has generated a projection signal for the underlying.
Weekly: Price currently displays (if strength and attitude continue) a desire to move toward 1741.12
If strength and attitude continue, it could take between 3 to 6 trade periods (weeks) to reach the projection.
Indicators Summary.
A collection of technical indicators whose directional attitude has been summarized.
Weekly: Out of the cumulative indicators monitored, 90.00% are bullish, 0.00% are bearish, 10.00% are neutral
The CCI indicator trading strategy suggest the following:
Weekly: Strongly bullish - No entries at this time. If in, consider covering..
Confirmation Signal
6 indicators combined to confirm entry/exit.
Weekly Bullish - Open directional trades

RUT Russell - open SHORTs on this top level values!
H&S forming overnight
Monday could open on 1620 on Monday
further decline to 1600 and lows
this is not a final BIG DROP yet!


Russel about to move up...Expect the unexpected! I was a HUGE Russel bear in late 2018... now, it looks ready to move up and conquer it's all time highs! WOW. #debt #gold #silver $slv $gld #fintwit $sil $silj $gdx $gdxj

RUT Russell - a main "TRIPLE CROWN" pattern could be evolving!
we could be heading to a second part of the main "triple crown" pattern
a final DROP should be postponed to mid Jan

RUT Russell 2000 - H&S 3tops - DOWN before UP?
reached 1574 level - matching levels for a left shoulder
expecting down moves before another UP and final ZIG-ZAG to 1610

RUT End Of Week Evaluation*** Comments prior to evaluation summary ***
Orion:4Sight Range for coming week 1444.22 - 1549.25 (Mean: 1496.73)
Orion:4Sight Range for November 1522.70 - 1676.61 (Mean: 1599.66)
Analysis is done based on the attitude and strength (or lack of) set up in the indicators on a weekly chart as of close Friday. Any news released over the weekend or during the follow on week can greatly impact the charts. Under normal world circumstances, I would say that most of the news is already playing into the charts as traders anticipate. However, 2020 is a little more different isn't it? So, what is the news?
Covid cases increase, they say maybe no vaccine until 2021 and world wide distribution until 2022, Europe locks down (Spain, Belgium, France, Germany), Winter sets in, Movie Theaters close, Restaurants and bars close, economy slows. America is getting ready to vote.
2020 by itself could be a Billy Joel song. "We didn't start the pandemic".
This week the RUT moved 109 points, the 21 day average is 77 points.
Trend Analysis:
The current trend is defined by the last price and it's relationship to specific moving averages.
Check the MA strategy for more specific suggestions.
Weekly: The relationship to the primary trend MA is bullish. The price in relationship to the other averages suggest close current positions.
Price Action:
Weekly: The average price range currently is 77.37 points/ticks/pips. Prices are currently .24x the normal trading range. Prices are trading within the mean range for activity. This generally indicates a consolidation of strength/indecision in the market regarding direction.
Prices are currently caught in consolidation between 1432.57 and 1652.05.
While in consolidation the trade range may decrease to 47.586 points/ticks/pips.
Standard Deviation
Weekly: Standard deviation suggests a range from 1607.34 to 1469.62 for the following week.
Calculated Price Strength:
The strength of the trend in conjunction with specific averages.
News announcements can change the strength and directional attitude.
Weekly: Trend strength suggests trading between a range of 1490.67 to 1586.29 for the following week.
Price Projection:
The price action has generated a projection signal for the underlying.
Weekly: Price currently displays (if strength and attitude continue) a desire to move toward 1471.12
If strength and attitude continue, it could take between 1 to 2 trade periods (weeks) to reach the projection.
Indicators Summary.
A collection of technical indicators whose directional attitude has been summarized.
Weekly: Out of the cumulative indicators monitored, 70.00% are bullish, 10.00% are bearish, 20.00% are neutral
The CCI indicator trading strategy suggest the following:
Weekly: Bullish - cover longs.
Confirmation Signal
6 indicators combined to confirm entry/exit.
Weekly Bullish - Close/Cover directional trades, profit taking/trend switch in process.
RUT triple top - 22 December drop version
pattern is developing - update of the plan
decline starts around 22nd December


RUT Russell 2000 - two next days?
H&S to build up a reversal trend tomorrow
reaching top levels day after (to finish a new channel resistance)
Friday reversal to DOWN trend

RUT Russell 2000 - short term LONG - Son & Father in H&S
UP tomorrow?
ZIG ZAG till US election
Finish of Head and move DOWN
part of a massive H&S - more in a related link
