US2000 trade ideas

RUT End Of Week Evaluation*** Comments prior to evaluation summary ***
This coming week is earning from very large (186 of them are SP500) corporations, the news from Europe is looking grim as Spain declares a 6 month state of emergency and of course American politics.
Anyone saying, with this amount of news pending, that forecasting is accurate is foolish. All I can say at this point is that the close of the week was neutral pattern bar.
Orion:4Sight Range for coming week 1626.91 - 1733.21 (Mean: 1681.56)
Trend Analysis:
The current trend is defined by the last price and it's relationship to specific moving averages.
Check the MA strategy for more specific suggestions.
Weekly: The relationship to the primary trend MA is bullish. The price in relationship to the other averages suggest long positions
Price Action:
Weekly: The average price range currently is 78.34 points/ticks/pips. Prices are currently 1.613x the normal trading range. Prices are trading within the mean range for activity. This generally indicates a healthy trading range.
Prices are currently caught in consolidation between 1541.20 and 1652.05.
While in consolidation the trade range may decrease to 48.204 points/ticks/pips.
Standard Deviation
Weekly: Standard deviation suggests a range from 1708.49 to 1572.52 for the following week.
Calculated Price Strength:
The strength of the trend in conjunction with specific averages.
News announcements can change the strength and directional attitude.
Weekly: Trend strength suggests trading between a range of 1606.33 to 1693.91 for the following week.
Price Projection:
The price action has generated a projection signal for the underlying.
Weekly: Price currently displays (if strength and attitude continue) a desire to move toward 1741.12
If strength and attitude continue, it could take between 3 to 6 trade periods (weeks) to reach the projection.
Indicators Summary.
A collection of technical indicators whose directional attitude has been summarized.
Weekly: Out of the cumulative indicators monitored, 90.00% are bullish, 0.00% are bearish, 10.00% are neutral
The CCI indicator trading strategy suggest the following:
Weekly: Strongly bullish - long entries.
Confirmation Signal
6 indicators combined to confirm entry/exit.
Weekly Bullish - Open directional trades


RUT End Of Week Evaluation*** Comments prior to evaluation summary ***
Orion:4Sight Range for coming week 1541.57 - 1644.34 (Mean: 1592.96)
Trend Analysis:
The current trend is defined by the last price and it's relationship to specific moving averages.
Check the MA strategy for more specific suggestions.
Weekly: The relationship to the primary trend MA is bullish. The price in relationship to the other averages suggest long positions
Price Action:
Weekly: The average price range currently is 80.56 points/ticks/pips. Prices are currently 1.62x the normal trading range. Prices are trading within the mean range for activity. This generally indicates a healthy trading range.
Prices are currently caught in consolidation between 1541.20 and 1652.05.
While in consolidation the trade range may decrease to 49.44 points/ticks/pips.
Standard Deviation
Weekly: Standard deviation suggests a range from 1567.93 to 1699.682 for the following week.
Calculated Price Strength:
The strength of the trend in conjunction with specific averages
Weekly: Trend strength suggests a trade range of 1593.53 to 1683.59 for the following week.
Price Projection:
The price action has generated a projection signal for the underlying.
Weekly: Price currently displays (if strength and attitude continue) a desire to move toward 1741.15
If strength and attitude continue, it could take between 3 to 6 trade periods (weeks) to reach the projection.
Indicators Summary.
A collection of technical indicators whose directional attitude has been summarized.
Weekly: Out of the cumulative indicators monitored, 90.00% are bullish, 0.00% are bearish, 10.00% are neutral
The CCI indicator trading strategy suggest the following:
Weekly: Strongly bullish - long entries.
Confirmation Signal
6 indicators combined to confirm entry/exit.
Weekly Bullish - Open directional trades

small cap companies next week analysisthe weekly chart indicates that the price is showing rejection in a downtrend trendline that comes back from 2019.
the MACD indicator is also showing divergence
price action is showing a downtrend structure and the candle closed forming a doji.

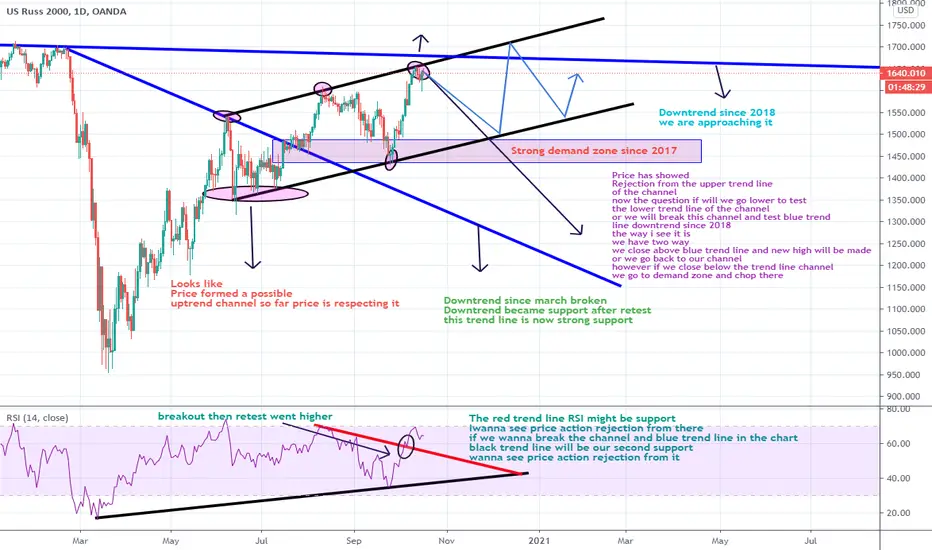
Russel2000 (RUT) Path and directionHello everyone
This is my Russel2000 idea for Daily time frame
watch key notes for more detail on chart
for any question feel free to ask :) good luck
Russell 2000 (My Dead Friend loved to trade this)Updated View on Russell 2000 (29 Sept 2020)
My dead trader friend loved to trade Russell 2000.
He was the one who showed me the world of trading in 2008-2009.
Due to the family issue, he took his own life in early 2010-2012. Thanks for the memories, Philip.
Memories aside. RUSS 100 is in the strong UP trend and it shall continue to stay so.
1,500 shall act as strong support/ gate keeper for now as long as the level is support well, any sell positions shall be considered as a counter-trend entries and you need to be very fast.
Overall. it is still BULLISH.
DYODD, all the best and read the disclaimer too.
Feel Free to "Follow", press "LIKE" "Comment".
Thank You!
Legal Risk Disclosure:
Trading foreign exchange or CFD on margin carries a high level of risk, and may not be suitable for all investors.
The high degree of leverage can work against you as well as for you. Before deciding to trade foreign exchange you should carefully consider your investment objectives, level of experience and risk appetite.
The possibility exists that you could sustain a loss of some or all of your initial investment and therefore you should not invest money that you cannot afford to lose.
You should be aware of all the risks associated with foreign exchange trading, and seek advice from an independent financial advisor.
DISCLAIMER:
Any opinions, news, research, analyses, prices or other information discussed in this presentation or linked to from this presentation are provided as general market commentary and do not constitute investment advice.
Sonicr Mastery Team does not accept liability for any loss or damage, including without limitation to, any loss of profit, which may arise directly or indirectly from use of or reliance on such information.

RUSSEL 2000 short tradeSo the Russel is set to retrace a lot more, impo, it has now hit the .618Fib on very low TF, just look at the chart, after that you can see a long trade to follow. The measured move from the upwards channel has hit the target also already, i really should post these trades more, my confidence is growing, as it should, i never seen someone else posting these kind of precise trades AND hitting them, my best ones i didnt even post the past weeks, no use in posting them now, cause you could say its hindsight, i know...i will post them from now on, give me some comments please, so i got courage to keep posting them, i will only post the high proabalities, promised!

US2000 DAILY CHART ANALYSISUS2000 DAILY
- Watching for Pullback Into Support
Price is in a clear-cut trend one way in this market with all the recent momentum pointing up.
As the daily chart shows; price also recently broke higher and through the key daily supply level.
This level looks like it could now act as a new price flip demand level and a potential area to hunt long trades.
If price can now rotate back lower, then hunting trades at this level would be inline with the momentum and at a major level.

Watching for Pullback Into SupportPrice is in a fairly clear-cut trend one way in this market with all the recent momentum higher.
As the daily chart shows; price also recently broke higher and through the key daily resistance level.
This level looks like it could now act as a new price flip support level and a potential area to hunt long trades.
If price can now rotate back lower, then hunting trades at this level would be inline with the momentum and at a major level.

Small Caps following New Path to ATH After ABC CorrectionGot a clear 5-wave impulsive breakout from the ABC correction of September; but enters overbought condition in RSI, needs a breather and consolidation at support; trade short; then roll long at ~1515
Line tracing back through multiple S/R peaks/troughs at 1506 - 1513 tar zone; look for retracement over ~2 weeks/9 sessions before trend resumes
Uptrend will be a powerful wave 3 breakout to new ATH before year-end IMO; notice how correction moved price into a new, lower channel which now continues uptrend in next blade of Gann Fan; following brief pullback to support, Wave 3 should bull fiercely into Nov/ December/Jan.
NB: Gann fan coincides with Fibo retracement price; a critical intersection IMO
Easy money printing soon IMO as recovery from CV19 crash completes and bull runs to new ATH; small Gap to fill at 1680, ATH 1:1 recovery at 1715.
Not investing advice; trade at your own risk!

RUT - a diamond on Mt Everest TOP!
a DIAMOND reversal patterns on H&S top 1647
a DROP expect today or tomorrow
see more in my previous analysis

RUT US2000USD - Mt Everest top 1647!
Mt Everest reached! Officially 1647
This should be a TOP of a massive H&S 1608 - 1647 - 1608 pattern
Short to 1550/1520/1490/1430 levels UP and ZIG ZAG from there to 1608+
Nov 6th - the presidential election - should reach the second shoulder levels
the BIG DROP should be around 8th/9th December in this scenario

RUT End Of Week Evaluation*** Comments prior to evaluation summary ***
SWIFT Projected Range for coming week: 1621.33 -1779.57 (Mean: 1700.45)
Trend Analysis:
The current trend is defined by the last price and it's relationship to specific moving averages.
Check the MA strategy for more specific suggestions.
Weekly: The relationship to the primary trend MA is bullish. The price in relationship to the other averages suggest long positions
Price Action:
Weekly: The average price range currently is 81.09 points/ticks/pips. Prices are currently 1.81x the normal trading range. Prices are trading within the mean range for activity. This generally indicates a healthy trading range.
Prices have broken through the high value of the consolidaiton range.
Standard Deviation
Weekly: Standard deviation suggests a range from 1706.694 to 1568.397 for the following week.
Calculated Price Strength:
The strength of the trend in conjunction with specific averages
Weekly: Trend strength suggests a trade range of 1637.55 to 1749.61 for the following week.
Price Projection:
The price action has generated a projection signal for the underlying.
Weekly: Price currently displays (if strength and attitude continue) a desire to move toward 1718.64
If strength and attitude continue, it could take between 3 to 6 trade periods (weeks) to reach the projection.
Indicators Summary.
A collection of technical indicators whose directional attitude has been summarized.
Weekly: Out of the cumulative indicators monitored, 90.00% are bullish, 0.00% are bearish, 10.00% are neutral
The CCI indicator trading strategy suggest the following:
Weekly: Strongly bullish - long entries.
Confirmation Signal
6 indicators combined to confirm entry/exit.
Weekly Bullish - Open directional trades

Bullish Russell (RUT)MACD indicator breaking out before price.
The PMO also trending up successively.
Interesting Small Caps Strength... IWM
Market history of cycles suggests small caps perform best in the early innings of a new bull market.

Bitcoin Daily View Friday Oct 9thBitcoin Daily View Friday Oct 9th
BTC is looking Beautiful this morning!
Have a Great Weekend All!

Russell: The formation of a descending pattern 3W is possible.The formation of a descending 3W pattern is possible if the resistance level of 1575 is not broken upwards.


RUT 1620 TOP heading down to 1490 in H&S pattern next few days
1620 is local top on RUT
H&S pattern to 1490 levels
after that ZIG ZAG uptrend to 1620 levels
final crash after Nov 6th from 1620
SPX, NQ in similar pattern
