Dollar At Resistance; Will Lower CPI Cause New Drop? We had a volatile start of a new trading week.
The dollar moved higher across the board as the US and China appear to be moving toward lowering tariffs, suggesting progress toward a potential trade deal. As a result, stock futures are also trading to the upside. However, keep in mind that sharp moves on Monday can easily be reversed through the rest of the week, possibly even today, after US CPI came out lower than expected, which can cause some weakness on yeilds, and possibly FED will be ready to cut rates after-all.
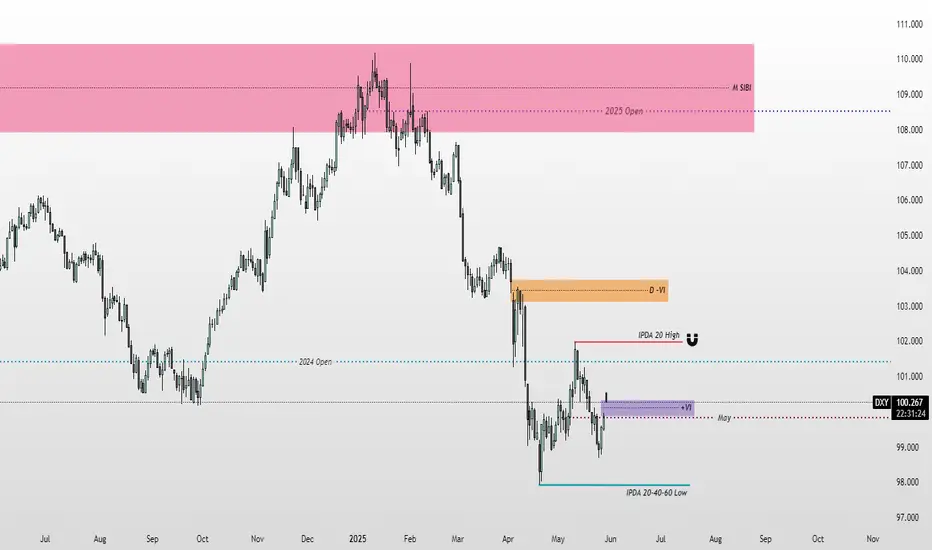
So, I think that USD can still come under pressure, especially if we also consider that rise on DXY is in three legs and that a lot fo gaps from this weekend are still unfilled.
USDX trade ideas

US DOLLAR FORECAST (update)Update of stalking bullish behavior in the USD instrument.
Intermarket confluence has aligned instruments such as Gold & US Stocks are soft to Bearish, I focus on XAUUSD and US30 outside of Oil to gauge validity of idea.
Thus said focus is on the 5 min chart, we seek rejections framed from 30 min area of interests.
Trigger should be after 5m Bullish playbook, manipulation is a sign of a healthy "auction".

DXY,USDCHF & USDCAD Daily Trade SetupsIn this update, we review the recent price action in the Dollar Index, the Swissy, and the Loonie and identify the next high-probability trading locations and price objectives to target. To review today's video analysis, click here!

DXY (LONG)
Break retest of down trend movement
Dollar has been on down trent and till it break trendline,we to bearish.

US DOLLAR INDEX Correlation Between Dollar Index (DXY), 10-Year Bond Yields, Bond Prices, and Interest Rates
1. Bond Prices vs. Yields
Inverse Relationship: Bond prices and yields move in opposite directions.
When bond prices rise, yields fall (e.g., demand for safe-haven assets drives prices up).
When bond prices fall, yields rise (e.g., selling pressure due to inflation fears).
Example: A 1% Fed rate hike can cause bond prices to drop, pushing 10-year yields up by ~1.3% .
2. 10-Year Bond Yields vs. Dollar Index (DXY)
Positive Correlation: Typically, higher yields attract foreign capital into USD assets, strengthening the dollar.
A 1% rise in 10-year yields historically correlates with a 1–2% DXY appreciation .
Risk-Off Scenarios: Investors may flock to both Treasuries (pushing yields down) and USD (DXY↑), weakening the usual correlation .
Policy Divergence: If the Fed delays rate cuts amid global easing, yields and DXY may diverge temporarily .
3. Interest Rates vs. Dollar Index (DXY)
Direct Relationship: Higher US interest rates strengthen the dollar by attracting yield-seeking capital.
A 25-basis-point Fed rate hike can boost DXY by 1–2% .
Example: In 2018, Fed rate hikes to 2.5% drove DXY gains of ~8% .
Inverse Impact on Bonds: Rate hikes depress bond prices (yields rise), reinforcing the DXY-yield link .
4. Interest Rates vs. Bond Yields
Policy-Driven: Fed rate changes directly influence short-term yields, while long-term yields (e.g., 10-year) reflect growth/inflation expectations.
The 10-year yield often leads Fed policy shifts. For example, yields fell 150 basis points ahead of 2019 rate cuts .
The 2-year Treasury yield is particularly sensitive to Fed expectations, serving as a "policy barometer" .
Summary Table of Relationships
Factor Relationship with DXY Relationship with 10-Year Yields
Bond Prices ↑ DXY ↓ (safe-haven flows weaken USD) Yields ↓ (inverse bond price-yield link)
10-Year Yields ↑ DXY ↑ (capital inflows) —
Interest Rates ↑ DXY ↑ (yield appeal) Yields ↑ (policy tightening)
Risk-Off Sentiment DXY ↑ (safe-haven demand) Yields ↓ (bond buying)
Key Exceptions and Contexts
Term Premium Dynamics:
Recent 10-year yield spikes (e.g., to 4.54%) are driven by market psychology (90% due to deficits/inflation fears vs. 10% fundamentals) .
Economic Growth Differentials:
Stronger US GDP growth (vs. peers) supports both yields and DXY, while weak growth decouples them .
Geopolitical Risks:
Trade tensions (e.g., US-China tariffs) can strengthen DXY as a safe haven, even if yields dip .
Conclusion
The Dollar Index (DXY) and 10-year bond yields generally share a positive correlation, reinforced by interest rate policies and capital flows. However, this relationship can weaken during risk-off environments or when fiscal/monetary policies diverge. Bond prices and yields remain inversely tied, while Fed rate decisions directly impact both yields and the dollar. Traders should monitor growth data, inflation trends, and central bank signals to navigate these interconnected dynamics.
#DOLLAR #USD #GOLD #SILVER #COPPER

DXY is pulling back decisivelyIt looks like DXY ready a pullback since it has already showing a significant weakness. We should anticipate continue pullback until NFP release next month. I'd like to see the current Dealing Range High purged and fail to push higher to confirm that the sell program is still intact.
DOLLARTHE dollar index resumes buying on demand floor on multiple confirmation and one more break of supplyroof will push for rally above 100$

USD vying for Monthly Doji after April Support BounceMonthly charts are often underapprecaited by many retail traders. Sure, they're not very actionable as there's only 12 per year but they can do a great job of highlighting trends and broader market themes and, of interest for this scenario, possible turns.
As a case in point, back in January the US Dollar had a full head of steam, and there was nary a bear in sight. But that month showed as a doji in the USD and in February, the tariff theme started to take over. It was a mild pullback that month but collectively, after two months of bulls stalling, many were ready to pull the plug and that's what showed in March and continued through April as the January doji led into a stern sell-off and fresh multi-year lows.
In April, the USD was hit hard by a combination of tariff drama and trend continuation and a major spot of support eventually came into play around Easter Monday, taken from a trendline projection as well as the 38.2% Fibonacci retracement of the 2008-2022 major move.
The bounce wasn't automatic, as there was a slow grind of higher-highs and higher-lows that got another boost around the FOMC rate decision earlier in May. That rally ran all the way until a major spot of resistance came into play at 102, at which sellers reacted.
But at this point they've been stalled at another major spot on the chart of 98.98, which is helping to set a higher-low. And from the monthly chart, the USD is currently showing a doji on the monthly bar for May, which sets the table for a possible turn as we trade into the summer months.
Key for this coming to fruition will be continued recovery in USD/JPY, which has had a major impact in the USD of late. And if we do see that theme of USD-strength continue, I still favor EUR/USD as a major pair of interest for that theme. - js

SELL DXYThis week the USD has been retracing, most traders are going long but we know how this goes. Based of our strategy and approach we are still very much bearish on the USD. Our positions for shorts are at 99.916 and adding more shorts at 100.500. Our targets remain at 94.760. If you are catching this set up now then your stops should be above 1011.300. Use proper risk management and risk what you can afford to loose. Best of luck folks.

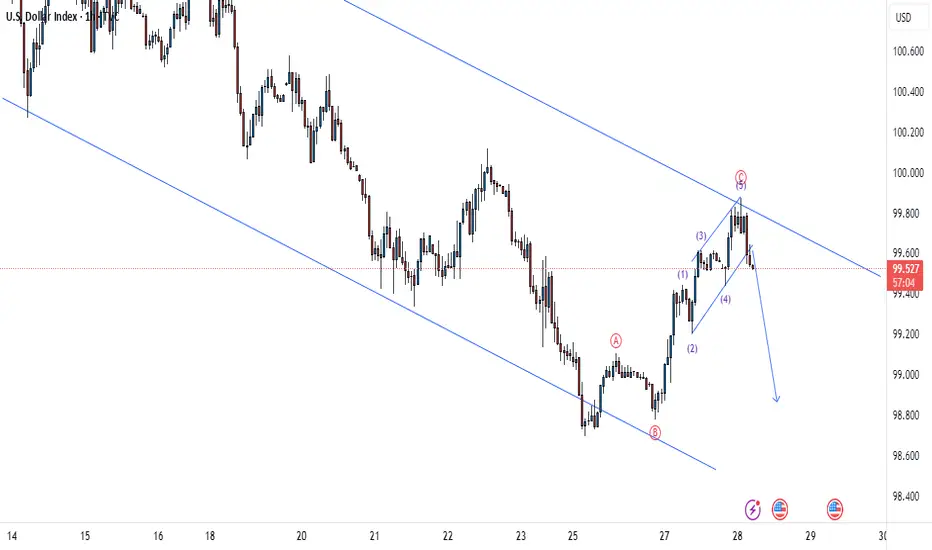
DXY aka usd 28 May 2025Price has formed a 5 waves up from the bottom, expecting correction lower before another attempt higher.


DXYCurrent Market Analysis:
- Monthly Trend: Bearish
- Weekly Trend: Bearish
- Daily Trend: Bullish
- H4 Trend: Bullish
Strategy:
- Waiting for H4 trend shift to confirm a potential reversal
- Anticipated Break: Daily support turning into resistance

DXY Bearish Flag ConfirmedPrice is showing signs of being rejected in the current daily supply zone. A strong momentum to the downside will take price to daily support and if daily support breaks the next target will be in weekly demand.

USXUSD HOTW USXUSD HOTW in once we get a H1 BOS.
Looking for the next target, April Lows.
Let's see....

Potential BearsThe Map explains itself, but from the EW Perspective, we're done with an ABC Correction upwards, and the next move is another Impulse downstairs. Let's enjoy the move and try milk the market as best as we can.
Adam and Eve pattern? Bullish?DXY is finding strong support, possibly forming an Adam and Eve pattern, which indicates a bullish reversal.

DXY 15-Minute Technical & Fundamental AnalysisDXY 15-Minute Technical & Fundamental Analysis
DXY has reclaimed momentum, trading at 99.300, after strong U.S. economic data and a hawkish tone from Fed officials signaled policy stability — boosting short-term confidence in the U.S. dollar. On the 15-minute chart, we’re seeing a bullish structure reinforced by clean liquidity manipulation and institutional flow.
Price confirmed bullish intent after breaking above minor key resistance at 99.250, triggering a wave of buy-side momentum. A brief liquidity hunt below 99.250 followed — a textbook manipulation phase — before buyers stepped back in.
DXY then formed Higher Highs and Higher Lows, indicating a well-supported uptrend. Price is now sitting inside the liquidity zone, where smart money often positions for the next leg up.
📊 Trade Setup
📍 Area of Interest (AOI): 99.140 (Buy Limit)
🛡 Stop-Loss: 98.990 (Below liquidity grab and minor support)
🎯 Take Profit: 99.610 (Next minor resistance / 1:3 RR)
This setup aligns with institutional behavior, offering a high-probability entry for short-term trend continuation.
📰 Fundamental Outlook
🇺🇸 USD Strength Backed by Short-Term Fundamentals
Resilient U.S. Data: Retail sales and durable goods orders beat forecasts, signaling economic strength and limiting downside for the dollar.
Fed Stays Hawkish: Policymakers have reiterated their "higher for longer" stance, reducing expectations for rate cuts and supporting the dollar.
Safe-Haven Demand: Geopolitical concerns and weak economic data abroad have driven flows back into the USD as investors seek stability.
Yield Support: Elevated U.S. bond yields continue to attract foreign capital, giving additional strength to DXY.
📌 Disclaimer:
This is not financial advice. Always wait for proper confirmation before executing trades. Manage risk wisely and trade what you see—not what you feel.

possibility of correctionGiven the behavior of the index in the resistance range and the resistance trend line, an upward trend is expected. Otherwise, a downward trend to the previous low is possible.

Beware, the US dollar is at a technical crossroads 1) The US Dollar remains the weakest major Forex currency in 2025
The US dollar has had a difficult year on the foreign exchange market (Forex), recording a decline of over 9% against the world's major currencies, despite the Federal Reserve's continuing rigid monetary policy. Technically speaking, the DXY index has reached several theoretical bearish targets, notably according to Elliot analysis, but has not yet touched the key objective of the A=C movement. This dynamic is also evident in the strong chartist compression in weekly data, placing the USD at a potential breakout point. The EUR/USD and USD/JPY pairs are also in long-term hinge configurations, and institutional positions remain broadly bearish on the US dollar against a basket of major currencies.
Two interesting charts on the current situation are presented below: the first shows Japanese candlesticks in monthly data, and the second is a theoretical reminder of how Elliott waves work.
As long as the US dollar against a basket of major currencies (DXY) remains below the indicated pivot line, the trend remains bearish, with a target of 95/96 points. Conversely, a rebound above the hinged pivot line would put an end to the US dollar's annual correction, with the starting point for a technical recovery.
2) A weakening dollar despite an inflexible Fed: how to explain this paradox?
The apparent paradox of a falling US dollar while US interest rates remain high and the Fed does not expect to cut rates before September/October, goes beyond simple rate differentials. At a time when the ECB has already embarked on a policy of monetary easing, the rate differential with the Fed should normally support the USD. However, other factors are taking over: the markets' growing mistrust of US assets, fuelled by trade tensions and uncertainty over Trump's fiscal policy, is weakening demand for dollars. Added to this is a major liquidity factor: the recent increase in the money supply (M2) in the United States and the decline in reverse repo operations, which reflect an implicit easing of financial conditions. This easing is encouraging persistent downward pressure on the greenback, despite a Fed that remains intransigent on rates.
The next release of US PCE inflation, scheduled for Friday May 30, could play an important catalytic role: a higher-than-expected figure would strengthen the case for an even firmer Fed, which could offer the USD a temporary technical rebound. Conversely, confirmation of disinflation would fuel bets on future easing and accentuate selling pressure. In short, the US dollar is not only at a technical crossroads, but also a fundamental one, suspended between forthcoming monetary action and deeper signals from the global liquidity market.
DISCLAIMER:
This content is intended for individuals who are familiar with financial markets and instruments and is for information purposes only. The presented idea (including market commentary, market data and observations) is not a work product of any research department of Swissquote or its affiliates. This material is intended to highlight market action and does not constitute investment, legal or tax advice. If you are a retail investor or lack experience in trading complex financial products, it is advisable to seek professional advice from licensed advisor before making any financial decisions.
This content is not intended to manipulate the market or encourage any specific financial behavior.
Swissquote makes no representation or warranty as to the quality, completeness, accuracy, comprehensiveness or non-infringement of such content. The views expressed are those of the consultant and are provided for educational purposes only. Any information provided relating to a product or market should not be construed as recommending an investment strategy or transaction. Past performance is not a guarantee of future results.
Swissquote and its employees and representatives shall in no event be held liable for any damages or losses arising directly or indirectly from decisions made on the basis of this content.
The use of any third-party brands or trademarks is for information only and does not imply endorsement by Swissquote, or that the trademark owner has authorised Swissquote to promote its products or services.
Swissquote is the marketing brand for the activities of Swissquote Bank Ltd (Switzerland) regulated by FINMA, Swissquote Capital Markets Limited regulated by CySEC (Cyprus), Swissquote Bank Europe SA (Luxembourg) regulated by the CSSF, Swissquote Ltd (UK) regulated by the FCA, Swissquote Financial Services (Malta) Ltd regulated by the Malta Financial Services Authority, Swissquote MEA Ltd. (UAE) regulated by the Dubai Financial Services Authority, Swissquote Pte Ltd (Singapore) regulated by the Monetary Authority of Singapore, Swissquote Asia Limited (Hong Kong) licensed by the Hong Kong Securities and Futures Commission (SFC) and Swissquote South Africa (Pty) Ltd supervised by the FSCA.
Products and services of Swissquote are only intended for those permitted to receive them under local law.
All investments carry a degree of risk. The risk of loss in trading or holding financial instruments can be substantial. The value of financial instruments, including but not limited to stocks, bonds, cryptocurrencies, and other assets, can fluctuate both upwards and downwards. There is a significant risk of financial loss when buying, selling, holding, staking, or investing in these instruments. SQBE makes no recommendations regarding any specific investment, transaction, or the use of any particular investment strategy.
CFDs are complex instruments and come with a high risk of losing money rapidly due to leverage. The vast majority of retail client accounts suffer capital losses when trading in CFDs. You should consider whether you understand how CFDs work and whether you can afford to take the high risk of losing your money.
Digital Assets are unregulated in most countries and consumer protection rules may not apply. As highly volatile speculative investments, Digital Assets are not suitable for investors without a high-risk tolerance. Make sure you understand each Digital Asset before you trade.
Cryptocurrencies are not considered legal tender in some jurisdictions and are subject to regulatory uncertainties.
The use of Internet-based systems can involve high risks, including, but not limited to, fraud, cyber-attacks, network and communication failures, as well as identity theft and phishing attacks related to crypto-assets.

dxy had a good base formation ,looks to spike up dxy looks good at 99.77 looks like spike up , on a other not metals can be affected.

Bearish reversal?US Dollar Index (DXY) is rising towards the pivot and could reverse to the 1st support.
Pivot: 100.21
1st Support: 99.08
1st Resistance: 101.14
Risk Warning:
Trading Forex and CFDs carries a high level of risk to your capital and you should only trade with money you can afford to lose. Trading Forex and CFDs may not be suitable for all investors, so please ensure that you fully understand the risks involved and seek independent advice if necessary.
Disclaimer:
The above opinions given constitute general market commentary, and do not constitute the opinion or advice of IC Markets or any form of personal or investment advice.
Any opinions, news, research, analyses, prices, other information, or links to third-party sites contained on this website are provided on an "as-is" basis, are intended only to be informative, is not an advice nor a recommendation, nor research, or a record of our trading prices, or an offer of, or solicitation for a transaction in any financial instrument and thus should not be treated as such. The information provided does not involve any specific investment objectives, financial situation and needs of any specific person who may receive it. Please be aware, that past performance is not a reliable indicator of future performance and/or results. Past Performance or Forward-looking scenarios based upon the reasonable beliefs of the third-party provider are not a guarantee of future performance. Actual results may differ materially from those anticipated in forward-looking or past performance statements. IC Markets makes no representation or warranty and assumes no liability as to the accuracy or completeness of the information provided, nor any loss arising from any investment based on a recommendation, forecast or any information supplied by any third-party.

DXY Technical Outlook – Strong Support Test and Bullish Reversa Chart Summary
The DXY (U.S. Dollar Index) chart illustrates a significant technical structure between strong historical support and resistance zones, with potential for a bullish reversal after a key level retest.
🟢 Key Support Zone: 99.000 – 98.000
📍 Labeled as "STRONG SUPPORT", this zone has held multiple times:
Previous bounce: Early 2023 ✅
Mid-2024 rebound ✅
Current price action once again shows a reaction from this level with a bullish candle forming 🔥
📌 EMA Confluence:
The 200 EMA (blue) sits at 102.401
The 50 EMA (red) at 103.725
Price is currently below both EMAs but near the 200 EMA, suggesting potential for a mean reversion bounce 📈
🔴 Resistance Zones to Watch:
Resistance Zone: 109.000 – 110.000
⛔ Historically rejected in late 2023 and again in early 2025
🧱 Acting as a supply zone — watch for rejection or breakout
ATH Supply Zone: 113.000 – 114.000
🚨 This is a major psychological and technical barrier
🫡 Marked as “NEW ATH” – would need strong momentum and fundamentals for a breakout above this level
📈 Price Action Expectations:
With strong support respected again, a bullish reversal toward 109.000 – 110.000 appears likely (as illustrated by the arrow).
If momentum continues, a retest of ATH zone is on the cards 🔭
However, a failure to hold support could lead to breakdown below 98.000 – watch closely 🔍
🧭 Strategic Insight
Bullish Bias while above support (98.000 zone)
Reversal Confirmation needed above 102.401 (200 EMA) and 103.725 (50 EMA)
Watch for rejection near 110.000 resistance before ATH test
📌 Final Note:
🧊 World Eyes on this Level – As highlighted on the chart, the current support area is under global observation, reinforcing its importance.
🕵️♂️ Stay alert for breakout volume and fundamental catalysts (e.g., Fed decisions, CPI, jobs data).

A retest of 98.00 or even further down.Dollar is almost getting to the support line of a historic rising channel that started almost 20 years ago, I am selling with targets 98.00-97.00 area.
If 97.20 acts a support, I'll be looking for long term longs.
