DOLLAR INDEX U.S. Dollar Index (DXY) and US 10-Year Treasury Yield
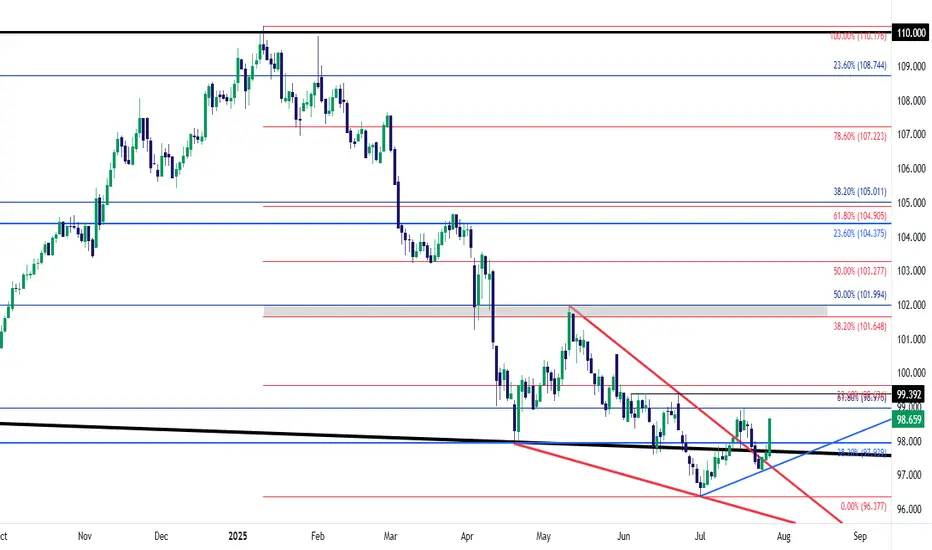
Dollar Index (DXY) — will reclaim 103-102 level if it crosses 100 mark currently is at 98.34 and faces immediate supply roof ,a make or break situation awaits dollar buyers .
Over the past month, the Dollar Index has gained about 2%, although it is still down over 5% compared to a year ago. The recent uptick follows a period of volatility and selling, with investors recalibrating expectations after the resolution of trade risk premiums and recent U.S.–EU trade deals.
US 10-Year Treasury Yield keep rising after its drop from 4.193% in early july to 4.5% on 17th
Yield on the US 10-year Treasury note is currently about 4.42% , modestly higher than last week and unchanged from the previous session.
Current levels reflect ongoing uncertainty regarding future Federal Reserve policy moves, cautious optimism regarding U.S. economic strength, and some abatement of safe-haven flows after recent global trade developments.
Relationship & Market Synopsis
DXY and the 10-year yield typically have a positive correlation: When Treasury yields rise, the dollar often follows, as higher yields make dollar-denominated assets more attractive to global investors. Conversely, falling yields can weigh on the dollar. However, in 2025, there have been periods of divergence due to external shocks and policy uncertainty.
Current setup: Both DXY and the 10Y yield are rising modestly, signaling a shift to a more constructive tone for the U.S. dollar as risk sentiment stabilizes and investors scale back some safe-haven trades. Recent U.S. economic resilience and fading tariff fears have reduced the need for defensive flows, supporting both yields and the dollar.
Forward outlook: Market consensus expects limited further upside for Treasury yields unless there are strong surprises in U.S. data or Federal Reserve communication. The DXY is projected to stabilize near current levels or drift higher on persistent U.S. economic momentum.
Summary:
Both the Dollar Index and US 10-year Treasury yield are modestly higher as of July 29, 2025. Their positive price action reflects improving US growth prospects, reduced global risk premiums, and recalibrated market expectations on Fed policy. While their relationship is generally positive, periods of divergence have occurred in 2025 due to trade, policy, and economic shocks. Currently, both are showing moderate gains as investor sentiment stabilize
USDX trade ideas

IS A HIGHER LOW SECURED ON THE DXY? LET'S FIND OUTIn this weekend analysis, I am still paying attention to the higher time frame downtrend on the dollar index while acknowledging the higher low support on the daily chart forming an inverse Head and Shoulders pattern. On the 4H and lower timeframes we have a strong ceiling made up of the 200SMA and 50SMA resistance level and need to break through from the 20SMA Line in the sand support. This weeks trade plan and thesis is for price to hold above the 20 SMA on the 4H timeframe expecting a potential dip to the zone of 97.128 (liquidity zone) and then bounce up to a weekly target of 97.7. This Thesis is INVALIDATED if a candle opens and closes below 97.015. I wish everyone a great trading week. Thank for supporting my publications and trade ideas. Cheers!!!


USD Rallies into a Major Week - Fed, PCE, NFP on the WayReversals of long-term moves can be tough to work with, especially for shorter-term traders.
While fundamentals are important for shaping future price moves and technicals are key for explaining past moves, while also allowing for strategy and risk management, it's sentiment and positioning that probably matter more.
Because if any and everyone in the world that wants to be long already is, well it doesn't matter how positive the news is if there's simply nobody left to buy. And if there's no influx of fresh demand, and only incoming supply, well, then price can drop, even on good news. And at that point, a heavy one-sided market will take notice of falling prices even in the face of good news, when price should be going up, and they'll be disconcerted to hold long positions, which can lead to even more supply, more selling, and in-turn, lower prices.
As the old saying goes, if a market doesn't rally on good news, well then look out below.
This shows in various ways on varying time frames in numerous markets but from a longer-term perspective, that shifting trend is akin to turning a cruise ship in the middle of the ocean - it's not going to happen suddenly. It takes time, it takes shifting, and it takes the slow grind of late-to-the-trend bulls turning into ahead-of-the-curve sellers.
This is what allows for the build of wedges, just as I had looked at earlier in the month in both USD and EUR/USD. Bulls suddenly get shy as prices approaches highs, although they remain aggressive on pullbacks and tests of support. This leads to a weaker trendline atop the move and, eventually, unless buyers get motivated to punch up to higher-highs with a new breakout, that motive for profit taking can soon take over.
In the USD, the sell-off in the first half of this year was a grinding matter, and the polar opposite of the trend that had held in DXY as we came into 2025. But, now the question is whether resilient US data leads to profit taking from bears and as we saw again last week, sellers have been showing lacking motivation at tests of lows or around support.
The big question for this week is whether we see that shift take-hold on a larger basis. We've seen sellers getting shy around lows, but are buyers ready to punch up to fresh highs in the USD? There's certainly ample potential for motivation as given the economic calendar with FOMC, Core PCE and NFP in the final three days of this week. - js
Dollar us dxyI think the US dollar will fall sharply, causing a sharp rise in gold. There will probably be a bigger fall than in 2008 in the global economy, especially in the US.

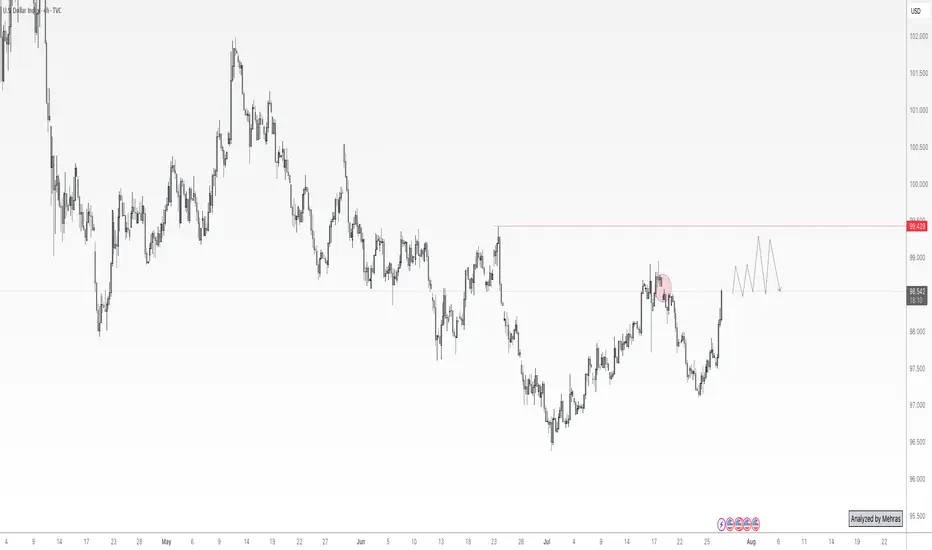
DXY at Its Most Critical Level of 2025 — Will the 100 Bank LevelThe Dollar Index (DXY), just like several other majors, is approaching a very important level. We’re now near the 100 mark, which is not only a psychological level — but also a key institutional (bank) level.
There’s also a gap zone left behind that price is about to fill. I believe the index will stay in a range over the next 1–2 days as it waits for critical data later this week — especially Wednesday’s announcements and Friday’s NFP report, which could set the tone for what’s next.
Based on current market sentiment, Trump’s remarks, Powell’s upcoming speech, and broader macro factors, I believe DXY has the potential to break above 100 and move toward 102–104, if that level is broken cleanly.
Let’s also not forget — price bounced from a monthly demand block near 96, and we’re seeing weak support across majors like EUR and Gold. That adds confluence for potential dollar strength.
📌 What do you think — is dollar strength just around the corner?
🔁 This analysis will be updated whenever necessary.
Disclaimer: This is not financial advice. Just my personal opinion.
DXY bullishDXY is in the early stage of a bull market, so no one want dollars but in my view but the trend is your friend.
This could be a impulsive 5 of 5 or a B of ABC but both are bullish, another view is that the EURO have been a bad day when the US and EU reach tariff agreement??
The lagging indicators are changing or I hope, but this bullish trend for the Dollar could continue for weeks...

Analysis on the DXY – EURUSD RelationshipHello traders,
Here’s an analysis that can be useful for both short-term and swing trades on EURUSD and DXY. Our trading team’s calculations are as follows:
Analysis on the DXY – EURUSD Relationship
Currently, DXY is at 98.200. Historical statistical data indicate that if DXY declines toward 96.300, there is approximately a **1.55% probability of an upward move** in EURUSD.
Based on this scenario:
Current EURUSD level: 1.16500
Projected target level:1.1830
While the correlation data show a strong inverse relationship, it’s important to note that periodic deviations can occur in the market. Therefore, this analysis should be considered a statistical projection only, not a guaranteed outcome.

DXY - ABC Move still in playDXY has been moving not so much on technical factors lately but more so with what Mr. Trump says, we still could see a move lower with an ABC pattern.
Good Luck

DXYDXY needs some more correction, if the correction is completed before Feds decision then a drop can follow otherwise Feds will push it up and NFP will drop it again.
Disclosure: We are part of Trade Nation's Influencer program and receive a monthly fee for using their TradingView charts in our analysis.
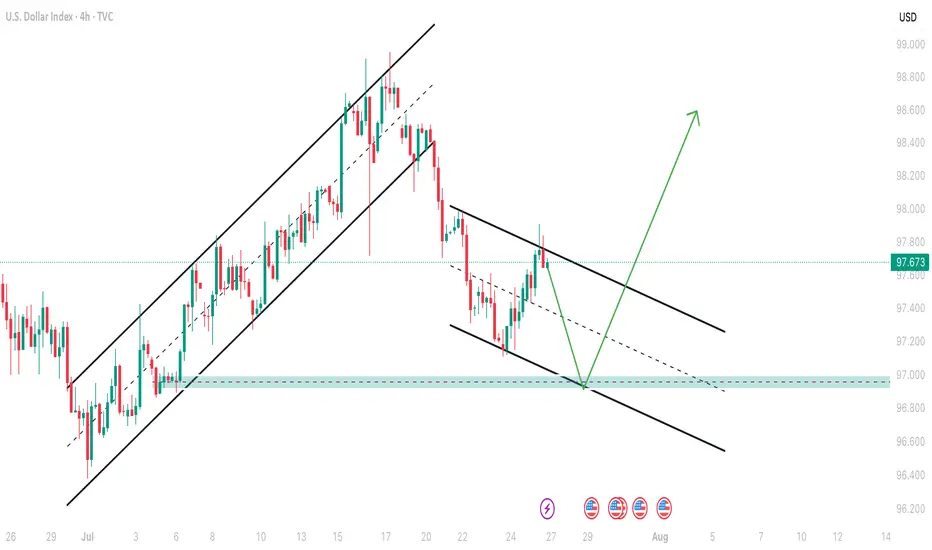
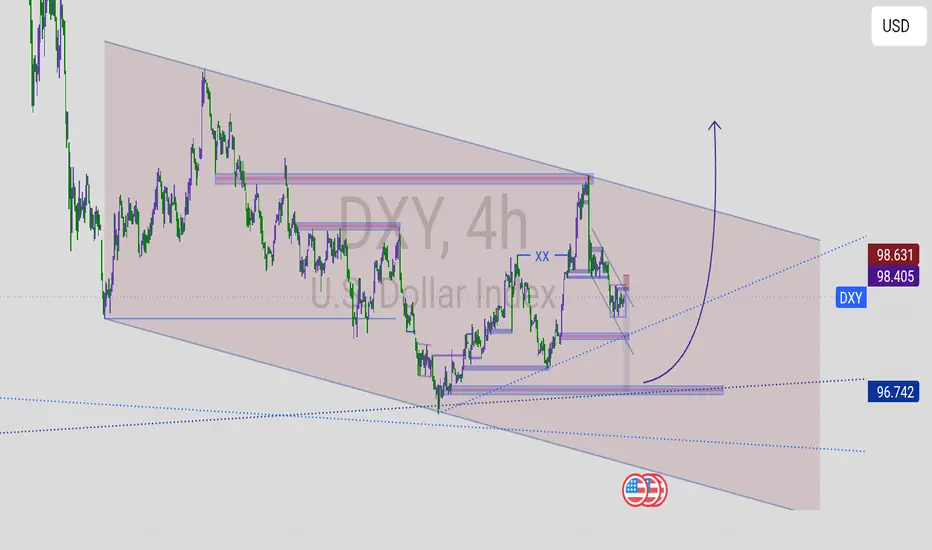
DXY index moving towards down in higher timeframeAs you can see DXY index is moving inside channel and now its time for second swing failure to go down.Then channel movement will finish and it will breakout towards upward so i recomand trade USD pairs accordingly.This is my analysis not a financial advice so trade according your risk management.
DXY Outlook: Can Fed Hold Spark a Move Toward 100?DXY Weekly Forecast – July Week 4
After reaching 96.50 early this month, DXY began showing bullish signs. Last week, price retested the extreme demand zone at 97.00 and closed with a bearish weekly candle that held some bullish pressure at the base.
This week, all eyes are on the Federal Reserve meeting. If the Fed holds rates steady, the dollar could strengthen further. A weekly close above 97.90 would confirm the breakout and open the door to a run toward 100.00 — a key psychological and technical level.
Bias: Bullish (if 97.90 breaks)
Key Zones:
• Demand: 97.00
• Breakout Level: 97.90
• Target: 100.00
This could be the beginning of a fresh bullish leg — especially if macro conditions align with technical structure.
—
Weekly forecast by Sphinx Trading
Let me know your bias in the comments.
#DXY #DollarIndex #ForexForecast #SphinxWeekly #SmartMoney #FOMC #USD #InterestRates

DXY forecast From weekly view the DXY is looking bearish at least till 95.123 key level the will see if we get a bullish power as the DXY is forming a reversal pattern. But of course many factors plays part in this economy, for example, global news like Tariffs and other factors.
So when DXY is trading on the 95.123 key level additional confluence will give us the right to put on trades, as the 95.123 key level is significant for what will take place next.
Take you all.......

DXY 4Hour TF - July 27, 2025DXY 7/27/2025
DXY 4hour Bearish Idea
Monthly - Bearish
Weekly - Bearish
Dailly - Bearish
4hour - Bearish
**We analyze DXY as an indicator of USD strength on a week to week basis**
This week is looking like we can expect bearish momentum on USD but here are two scenarios breaking down the potential:
Bearish Continuation - USD pulled a strong bearish reversal all last week which pushed us below our major 98.000 support zone.
We are now testing that same 98.000 zone as resistance and are looking to see if it will hold. Ideally, we can confirm further bearish structure to gain confidence in a bearish USD for the week ahead.
Bullish Reversal- For us to consider DXY as bullish again we would need to see bullish structure above our 98.000 zone. This would include: A break back above 98.000 with an established HH and HL.

DXY weekly outlookDXY Weekly Outlook
This week, I’m watching to see if the dollar continues its bearish trend or breaks above the current supply zone. We've already seen a strong reaction from the 8hr supply, but price could still tap into the 1hr supply before making its next move.
If price drops from here, I’ll be looking at the 2hr demand zone below for a possible bullish reaction. If DXY pushes up from that zone, pairs like EU and GU could drop — which lines up with my overall short bias on those.
Gold may not always move in sync with the dollar, but DXY still gives a good idea of market sentiment.
Let’s see how it plays out and stay reactive.

DXYJULY 21-25 recap
Net was -296 last week
Price dropped until Wednesday
Hit the weekly demand zone (strong support)
Sellers paused or covered shorts there
Buyers stepped in → possible bounce or reversal

US Dollar: Bullish For The Near Term?Welcome back to the Weekly Forex Forecast for the week of Aug 11 - 15th.
In this video, we will analyze the following FX market:
USD Index
The US Dollar has been weakened by bad employment numbers, the expectation for interest rate cuts in the next FED meeting, and inflation sneaking higher. CPI Data is coming Tuesday, and a soft number will add to selling pressure.
However, price is at levels where a the bearish retracement could end, and the higher low could be established.
React and do not predict.
Enjoy!
May profits be upon you.
Leave any questions or comments in the comment section.
I appreciate any feedback from my viewers!
Disclaimer:
I do not provide personal investment advice and I am not a qualified licensed investment advisor.
All information found here, including any ideas, opinions, views, predictions, forecasts, commentaries, suggestions, expressed or implied herein, are for informational, entertainment or educational purposes only and should not be construed as personal investment advice. While the information provided is believed to be accurate, it may include errors or inaccuracies.
I will not and cannot be held liable for any actions you take as a result of anything you read here.
Conduct your own due diligence, or consult a licensed financial advisor or broker before making any and all investment decisions. Any investments, trades, speculations, or decisions made on the basis of any information found on this channel, expressed or implied herein, are committed at your own risk, financial or otherwise.


this is my bios on Dxy.i will plan a long trade whenever plice aproach my POI.
but for now lets enjoy the water falls
All the Triggers You Need to Watch This Weekyo its Skeptic from Skeptic Lab 🩵
Quick breakdown of my weekly watchlist — from forex pairs to commodities — including the exact levels and triggers I’m watching for potential setups this week. Whether you trade breakouts or reversals, this list will keep you ahead of the moves.
Disclaimer: This content is for educational purposes only and is not financial advice. Trade at your own risk.

DXYThe U.S. Dollar Index is showing weakness after rejecting a key supply zone. Price has broken below recent support, signaling potential downside continuation. If sellers maintain control, we could see further declines toward the next demand zone.

A calm day for DXYGiven the market's lack of momentum and the overall downtrend in the higher timeframe cycle, it is unlikely that anything significant will happen with DXY today. At most, we might see a decline down to the 97.937 level.

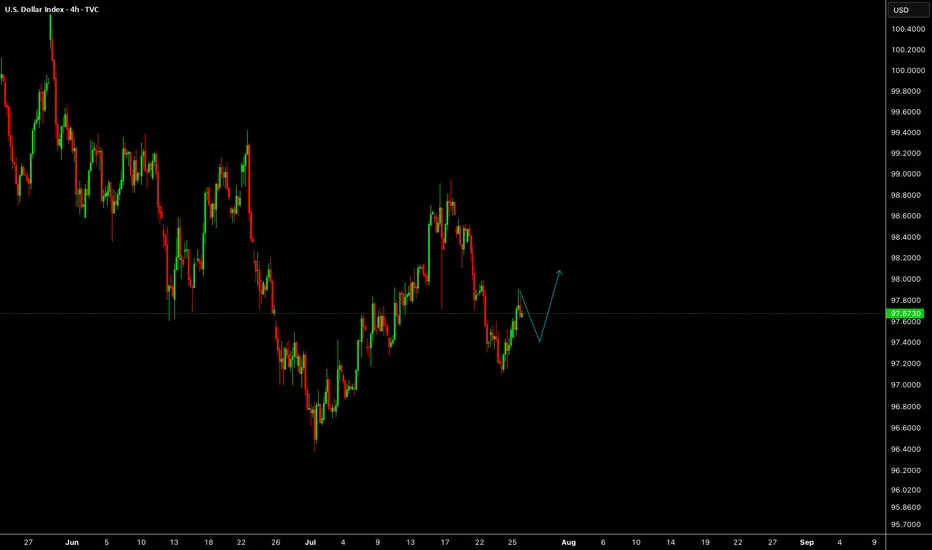
Decision Zone for DXY This Week: Around 97.600After a significant downward expansion in DXY, we observed a consolidation around last week's low. This week, the market opened with a pullback.
The first stop for this pullback appears to be the current daily fractal high candle and the weekly bearish FVG on the chart. We can assess potential selling pressure from this area on lower timeframes. We'll be monitoring the wicks within this zone, along with any newly forming FVGs.
If the price breaks above this area, our next points of interest will be the gaps within the zone above the 0.5 swing level, and ultimately the swing high itself as the final target.
Given the current setup, we believe there are promising trading opportunities on EURUSD.
Take care until the next update!
