DXYDXY Bullish COT Setup
Commercials: Net-long ~3,988 → smart money positioning for strength
Large Specs: Net-short ~3,451 → bearish bias, potential squeeze risk
COT Index: 94.5% → near historical extreme, signaling possible trend shift
USDX trade ideas
Key Events That Could Shape the Dollar This Week🇺🇸 Key Events That Could Shape the Dollar This Week
Three major catalysts are on the radar for USD traders:
📊 ADP Employment Report
💰 Advance GDP (Q2)
🧠 Fed Chair Powell’s Speech
Additionally, ongoing trade developments with the EU may add to volatility.
📊 1. ADP Employment Report
The July ADP report is forecast to show 82K job additions. While this may seem consistent with recent NFP strength, several red flags suggest growing labor market weakness:
Decline in labor force participation
Slowing wage growth
Emerging contraction signals in the services sector
Even if ADP meets expectations, it may not reflect broad-based labor market health. Historically, ADP and NFP have often diverged—so the market reaction may be muted unless the data surprises meaningfully.
💰 2. Advance GDP (Q2)
Q2 GDP is expected to show modest growth, possibly supported by:
Higher tariff revenues boosting government income
A weaker dollar improving export competitiveness
Reduced imports due to elevated import costs
However, much of this growth is likely nominal rather than real. With inflation remaining sticky, headline GDP may be inflated by price effects rather than true economic expansion. Real GDP could remain flat or weak.
🧠 3. Fed Chair Powell’s Speech
This is arguably the most market-sensitive event of the week.
Goldman Sachs and other major banks believe the recent resilience in U.S. data lowers the chances of a rate cut at this meeting. However, political dynamics could add nuance:
With Donald Trump actively campaigning—and reportedly pressuring the Fed to ease rates to boost exports and growth—Powell may face a fine balancing act in his tone.
Markets will dissect every word for clues on future policy.
🌐 U.S.-EU Trade Developments
The U.S. recently announced a new trade agreement with the EU, including a 15% tariff on selected European imports.
In the short term, this could be dollar-supportive, as it:
Favors domestic producers
Reduces reliance on imports
Potentially improves the trade balance
Yet over the longer term, such tariffs can be inflationary and disrupt global supply chains—possibly complicating the Fed’s decision-making.
⚠️ Final Thought
In times of policy uncertainty, markets lose their predictability.
Tariffs, in particular, often have a stronger and more immediate impact than calendar-based economic data.
As a result, traders must monitor trade-related news and tariff decisions just as closely—if not more—than traditional economic releases in order to stay ahead of market direction and central bank decisions.
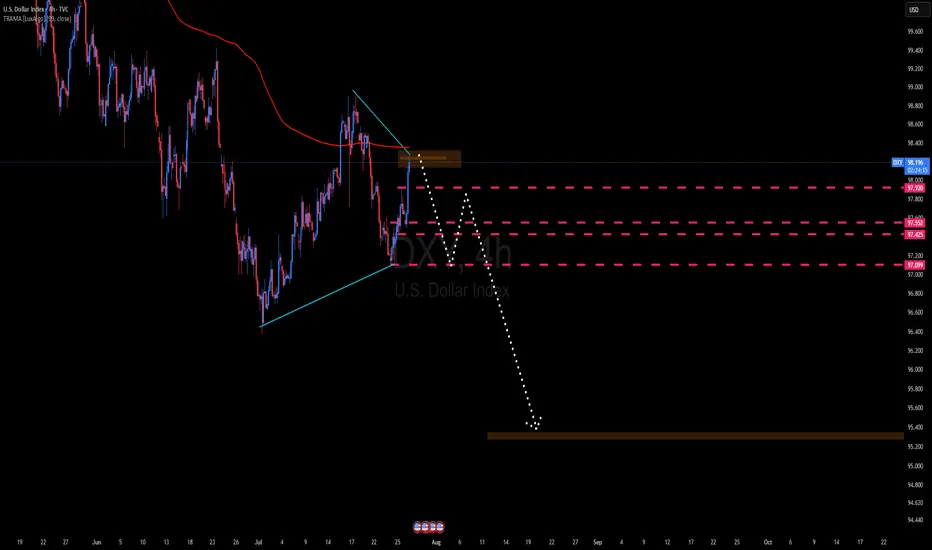
DXY Bearish Trend The DXY is expected to enter a bearish phase, with a potential decline starting from the 98.26–98.35 range, and possibly extending down to the 95.20–94.50 levels, which are anticipated to act as key support zones during the upcoming downtrend
A news-packed week.In this week, which could be considered the most news-packed week of the year, anything can happen. Due to the strength of the news, there's a high possibility that many of our analyses might fail, while many targets could also be hit.

DXYThe U.S. Dollar Index (DXY) continues to exhibit a bearish outlook driven by a combination of technical weakness and shifting macroeconomic fundamentals. Market expectations for Federal Reserve rate cuts, coupled with softer U.S. economic data and declining demand for the dollar as a safe-haven asset, have weighed heavily on the index. Technically, the DXY remains below key moving averages, with momentum indicators showing sustained weakness. Unless there is a significant shift in sentiment or a surprise in monetary policy direction, the bias remains to the downside over the near to medium term.
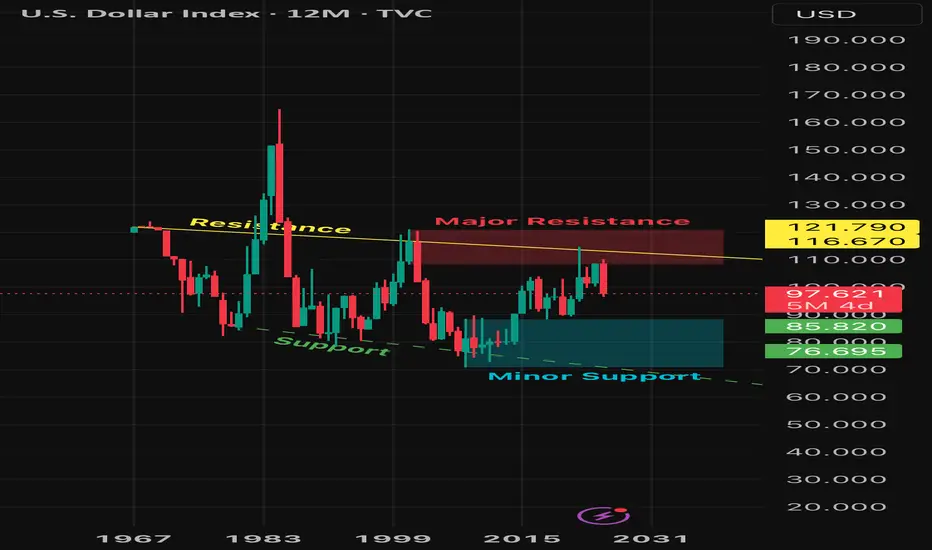
DXY: The Graceful Short This is interesting…Ever since the birth of Bitcoin, the DXY was in an overall uptrend, but that uptrend may have ended in the resistance zone. Price seems to have reversed for the DXY especially after the formation of a bearish engulfing candle on the 6M timeframe. Price may end the year within or on top of the support zone.
What does this mean for crypto and other assets?
If the DXY has reversed and is now in a long term down trend, crypto currencies and other assets will be in long term uptrends! Bitcoin may skip its upcoming bearish year next year or more than likely the bearish year will happen but the retracement may be short. Stay tuned!
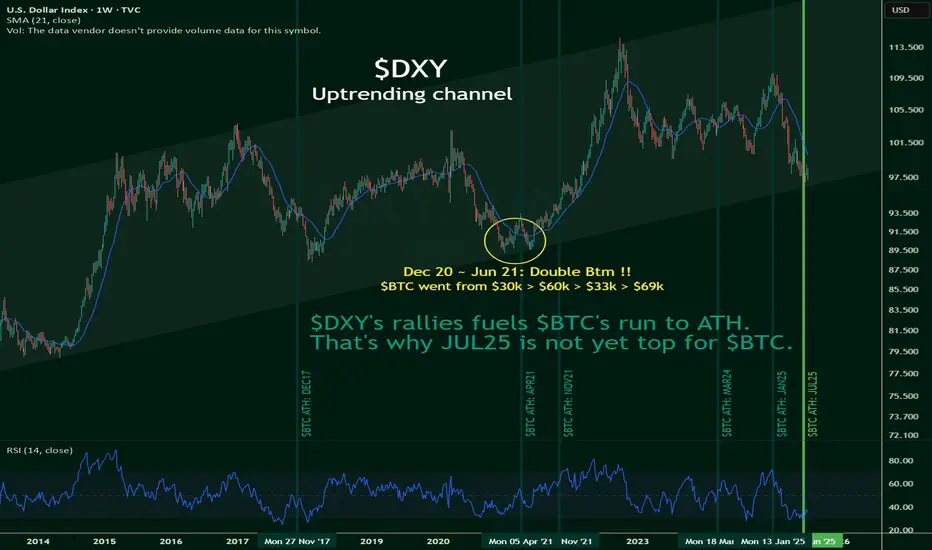
$BTC's run to ATH is fueled by $DXYNOT FINANCIAL ADVICE
I've yet to see this being mentioned anywhere on the internet, but TVC:DXY 's rally may just be CRYPTOCAP:BTC 's best friend.
This, despite the popular notion that when TSX:DXT goes up, CRYPTOCAP:BTC goes down, and vice-versa.
However, this novel idea puts a break to it.
TVC:DXY is hitting the bottoms of its uptrending channel, and it's likely to bounce back up towards the ceilings.
Which means a rally is likely, and this is kinda good for $BTC.
I'll remain bullish, until the numbers say otherwise.
Breakout of the channelAfter the DXY broke out of the channel, it formed a range.
We can see a yellow trendline where the price is moving exactly along it.
If this trendline breaks to the downside, we can take a short position targeting the bottom of the channel.
Otherwise, it would mean the trend reversal in DXY is confirmed.

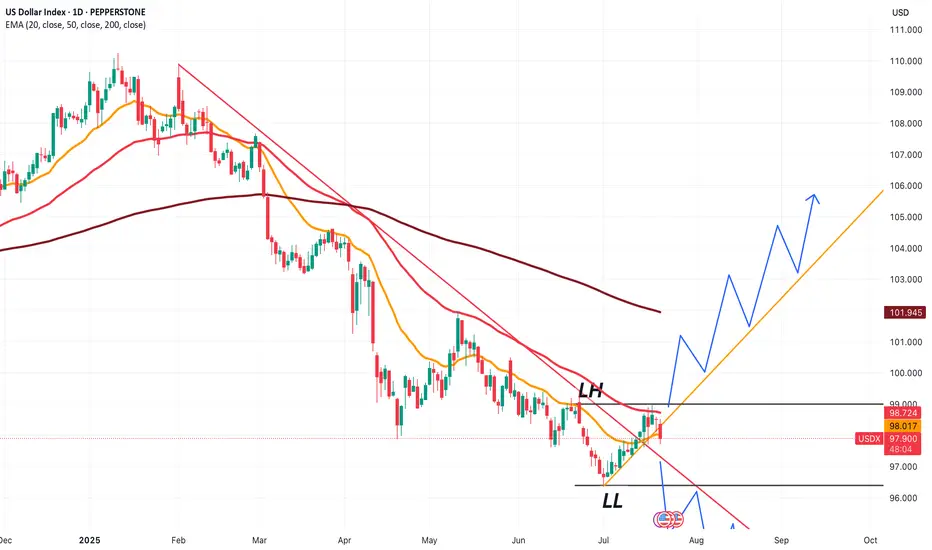
I HATETO BETTING. LET SEE WHY DXY Goes to there in my scenarioon August scenario
* Trumph's 10% import Tariff (Decision imminient)
* Powell speaking at Jackson Hole (August 22-24)
* Safe Haven printing Money

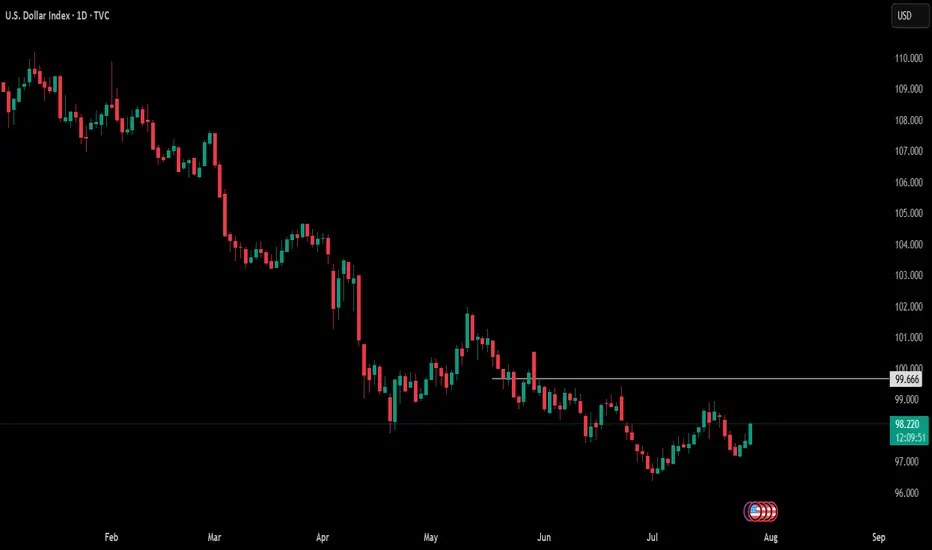
Dollar Index Dips – All Eyes on 97.600?The US Dollar Index (DXY) is currently trading just below the 100.000 🔼 resistance area, following a series of lower highs and lower lows that reflect a clear bearish trend. Price is now approaching the 97.600 🔽 level, which has previously acted as a key turning point and could influence the next directional move.
Support at: 97.600 🔽
Resistance at: 100.000 🔼, 101.500 🔼, 102.812 🔼, 104.223 🔼
🔎 Bias:
🔽 Bearish: The trend remains bearish while price stays below 100.000. A break below 97.600 may lead to further downside continuation.
🔼 Bullish: A bounce from 97.600 followed by a move back above 100.000 could open the door for a recovery toward 101.500.
📛 Disclaimer: This is not financial advice. Trade at your own risk.

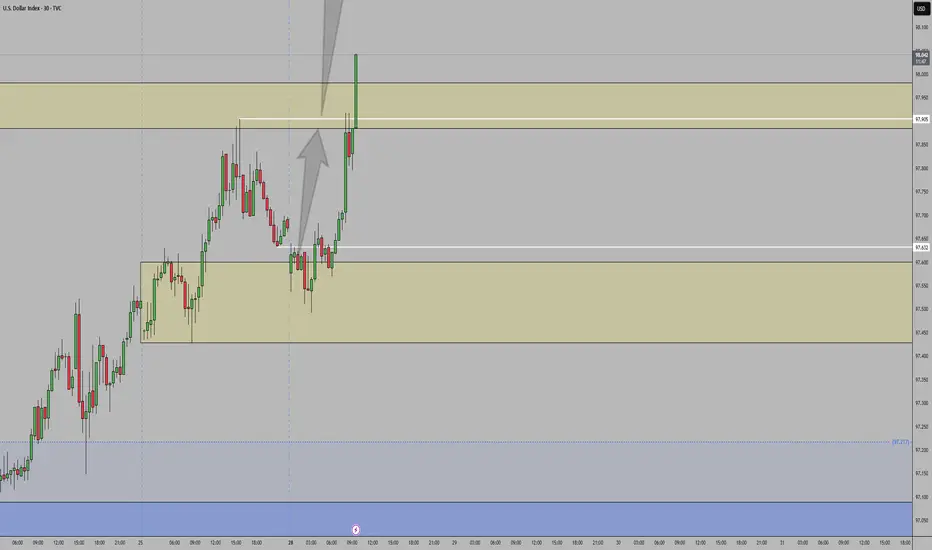
DXY HEADING INTO LAST WEEK OF JULY DXY ZONES
WEEKLY TF, TO DAILY, TO 4HR ANALYSIS.
The successful devaluation of the dollar by the administration since the election continues.
DXY dumped below key daily support at 97.600.
It was reclaimed but failed at key daily resistance dating back to 2024 — the same zone as the 0.382 Fibonacci level.
Failure to gain support at 97.580 (0.23 Fib level) = a bearish signal for the dollar index (DXY), potentially sending it back down to the 97.100–97.200 range. If that breaks, look for a further continuation toward the 96.700–96.800 zone.
This is a big week for news, reports, and interest rate decisions for the U.S., EUR, and CAD, as we close out July.
Still bearish on DXY for now.
However, if the dollar can break through the 97.950–98.000 range and catch support — then push past the 98.135–98.200 zone (0.618 Fib level) — I’ll be looking for a long entry on DXY up to the 98.900–99.400 zone for the next test.
Again, I remain bearish for now, but depending on the data and what the Fed does with U.S. rates, we could see a strong DXY this week. Until we pass those zones, I’m staying bearish.
New to trading (6 months in) — before you leave any hate comments:
I’m here to learn and would genuinely appreciate any advice or help in becoming better and more thorough.

Dollar indexDollar index in deep discount
Looking for higher prices this month
This my idea not a signal
#ICT
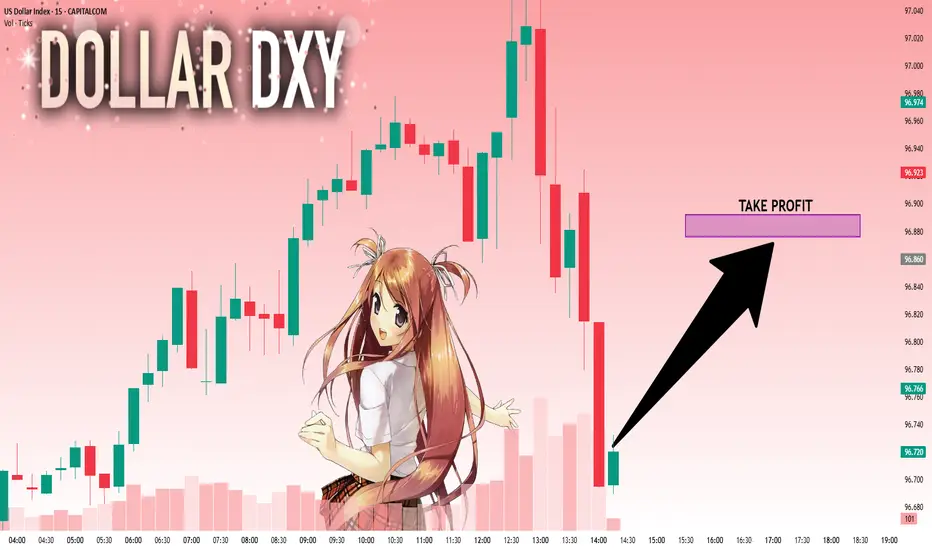
DOLLAR DXY dollar index on monthly support and we are watching the price action.lets watch the price action.
#dollar

dxy buy tradeThe Relative Strength Index (RSI) is showing an upward trend, indicating increasing momentum. Additionally, the Moving Average Convergence Divergence (MACD) is showing a bullish crossover, further supporting the potential for an upward move

DXY - BearishI am expecting more bearish on the USD. There is a possiblity it can get to 97.984 before bearish resumes.

Is the DXY finally changing its trend?It seems that the DXY is showing a tendency to change its trend, but we have to see whether the sellers will allow it or not.

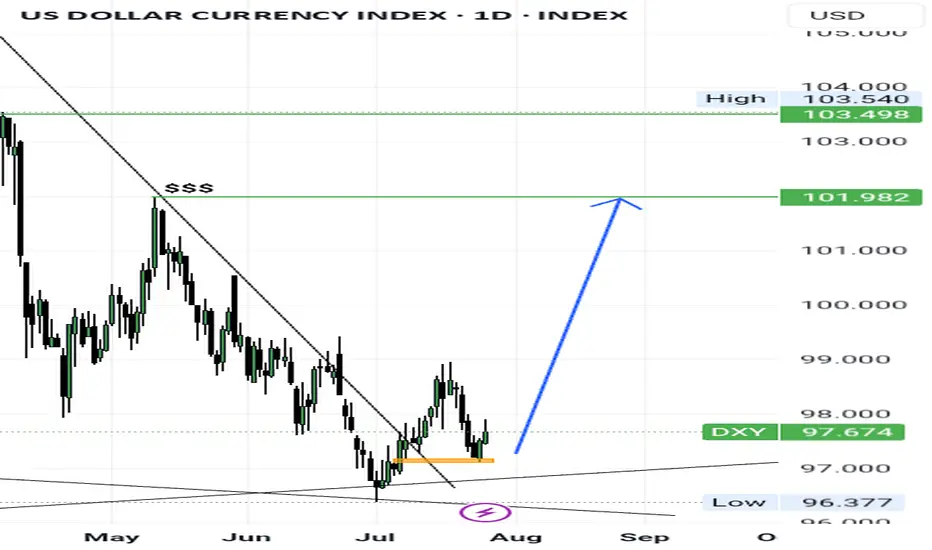
USDX at a crucial price point, which will decide trendThe next few candles for USDX price will be extremely important to understand where the dollar index is headed.
Based on that, we'll be able to choose 'which' Forex pairs we can trade, and more importantly 'how' we can trade them.
If price starts to follow the green line, and takes out 99.000, we'll be in an uptrend.
If price goes back to the red line and eventually goes below 96.400, we'll be in a downtrend.
Hopefully price won't consolidate too much, and trend in a particular direction.
Is the DOLLAR bullish? Look at the weekly support zone levelsI am trying to figure out what the recent bullish days mean within the overall range.
Please let me know what you think 🙏🏾

Dollar Reversal? Inverse Head & Shoulders Spotted!Is the Dollar Index bottoming out? I break down a potential Inverse Head and Shoulders pattern forming on the DXY chart — a classic reversal setup that could signal a major trend change. See as I analyze the key neckline breakout zone, potential upside targets and golden zone fib support defended confirming the pattern.
I hope you find this informative. Thank you for the boosts, comments and discussions of the idea. Cheers and best wishes on every trade
# USDCHF, #AUDUSD, #USDJPY, #EURUSD, #GBPUSD Forex pairs

Why a USD Bounce Could Trigger a Stock PullbackThe US Dollar has faced brutal selling during the first half of 2025. Some are even questioning whether the Dollar’s global hegemony is at risk. Early in the year the US stock market AMEX:SPY sold off aggressively, falling 19% from mid‑March to early April. Since then stocks have more than regained their losses and the Dollar is still in the tank. So where does that leave us for the rest of the year?
The Dollar Inverse Correlation
The US Dollar has an inverse correlation to most everything. Stocks, bonds, crypto, commodities, real estate — all are measured in Dollars. Therefore when the Dollar loses value, all things equal it takes more of them to reach the same value those assets were denominated at before. Conversely when the Dollar rises, other assets lose value in Dollar terms. Here we can see a long standing inverse correlation to stocks AMEX:SPY
Dollar in oversold territory
The Relative Strength Index (RSI) is a momentum oscillator that measures the magnitude of recent price changes on a scale from 0 to 100 to help identify overbought (above 70) or oversold (below 30) conditions. The Dollar has hit oversold several times so far this year, but not yet staged a material recovery.
Stocks in overbought territory
Meanwhile stocks have staged a blistering rebound off the "Liberation Day" driven selloff earlier this year. The S&P 500 now sits at an all‑time high, and you guessed it, has tapped overbought twice this month.
USD is fundamentally attractive
Because investors seek to earn the highest available yield on their capital, they tend to move funds into currencies offering higher interest rates (and away from those with lower rates), so differences in policy rates across countries create incentives for cross‑border borrowing and lending that drive FX flows. For example the Fed ( ECONOMICS:USINTR ) is at 4.5%, and the ECB ( ECONOMICS:EUINTR ) is at 2.15%. Moreover the Dollar is down significantly against major trading pairs that have lower yields. In our prior example the Dollar is down 11.98% against the Euro YTD (1- FX:EURUSD ), leaving substantial room for capital gains. Gravity could lure FX traders back in the second half of 2025.
Tariff calculus
Tariffs tend to bolster the imposing country’s currency in two main ways: by making imports more expensive they reduce import volumes, improving the trade balance (i.e. fewer foreign‑currency outflows), and by collecting duties in domestic currency the government effectively withdraws that currency from circulation, increasing its relative scarcity. Both effects lift demand for—and support the value of—the home currency.
Putting it all together
Despite the TVC:DXY ’s ~10.8% YTD slide and repeated oversold conditions, the compelling carry trade sets the stage for a USD bounce that, in turn, could pressure overextended equities. With stocks stretched and the Dollar oversold, the carry‑driven rebound in USD could well presage a pullback in equities. Stocks are expensive, Dollars are cheap 🤑

DXY: Strong Bullish Sentiment! Long!
My dear friends,
Today we will analyse DXY together☺️
The in-trend continuation seems likely as the current long-term trend appears to be strong, and price is holding above a key level of 96.722 So a bullish continuation seems plausible, targeting the next high. We should enter on confirmation, and place a stop-loss beyond the recent swing level.
❤️Sending you lots of Love and Hugs❤️
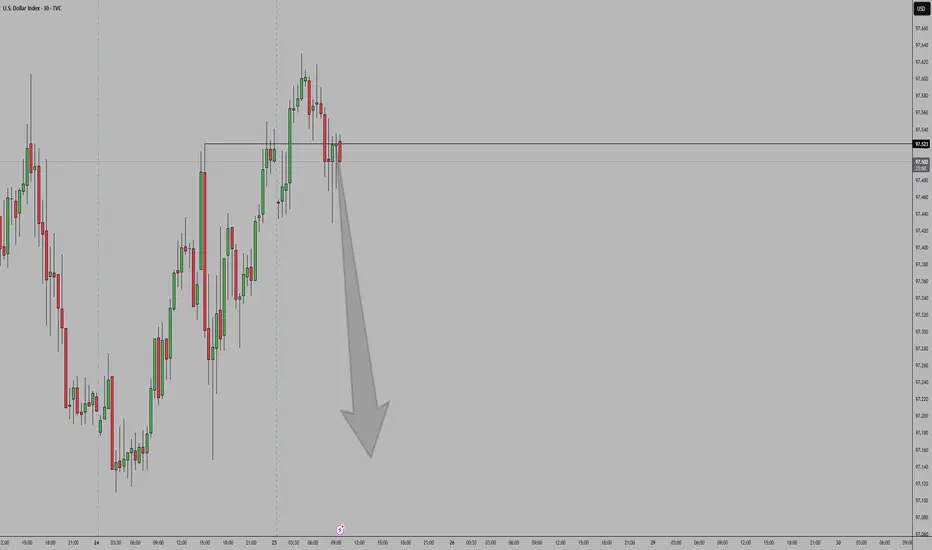
DXY Outlook – From Bias to Execution Previous day closed bearish from a known supply leading to a sell bias, On the 45M, I am currently looking out for possible entry or exit.

DXY 1D – Tipping Point: News or Price Action?Hey Guys,
The DXY index is currently moving within a downtrend. This trend is unlikely to reverse unless it breaks above the 98.950 level.
Sure, key fundamental data could shift the trend, but without those news catalysts, a reversal at this point doesn’t seem realistic.
Don’t forget—98.950 is a critical threshold for the DXY.
I meticulously prepare these analyses for you, and I sincerely appreciate your support through likes. Every like from you is my biggest motivation to continue sharing my analyses.
I’m truly grateful for each of you—love to all my followers💙💙💙
