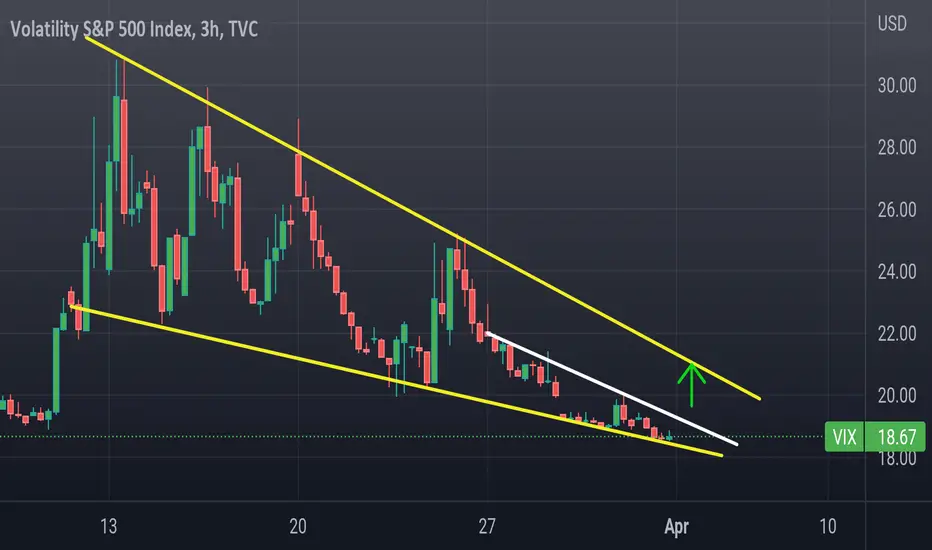
$VIX forming positive divergence while $SPX forms negativeApril has been positive, in fact the BEST MONTH, 16 of last 20 years & has an avg 2.5%!
The orange line coincidentally is around 2.5%!
We've sold TVC:VIX puts further out into May :)
Have a ton of $ reserved for that trade.
Easier 2c neg divergence on 4Hr vs positive on TVC:VIX
#stocks
VIX trade ideas

A Deeper Looking Into VIXThere are issues when it comes to the VIX volatility index's ability to project impending volatility - in part because options themselves are increasingly speculative vehicles rather than mere hedges to the underlying - but there is still a lot to glean from the the implied measures of activity.
Aside from the SKEW in implieds showing tail risk and volatility of volatility gauge showing underlying habits of jumpiness that the VIX alone doesn't well capture, I like the comparison of a shorter and longer duration gauge.
I thought we didn't have any robust short-term implied readings for the US indices space since VXST was scrapped some years ago, but apparently we now have CBOE:VIX9D - which covers is pretty self explanatory - relative to the 30-day traditional index. It's not the 'overnight' relative to '1-week' I like to pull from expensive data providers for FX volatility comparisons, but it can give useful insight.
What do the VIX9D - VIX suggest now? That we are underpricing the potential for a strong reaction (regardless of direction) heading into Wednesday CPI and Friday bank earnings.

VIX: VOLATILITY CYCLES / COMPRESSION / DIVERGENCE / PUTOVERCALLDESCRIPTION: In the chart above I have included an update on a MACRO analysis of VIX VOLATILITY CYCLES. The creation of a set of new cycles is marked when VIX finds a new floor of support.
POINTS:
1. Deviations have been adequately adjusted for VIX with a 7 Point difference between CHANNELS.
2. Price Action is currently resting at NEW FLOOR of 19 & Price Action is consolidating.
3. 5 YEAR TREND LINE IS APPROACHING MONTHLY PRICE ACTION FLOOR.
3. NO RECESSION AFTER 1998 HAS EVER COME TO AN END WITHOUT VIX FIRST SPIKING TO 40 OR 45 AT LEAST.
RSI: There is in fact a lot to be said for RSI as it rests roughly below the 50 Point average which would signal that RSI is set to flip into Oversold territory. RSI must reach the 30 Point average in the coming weeks or anything above the 30 Point average & rising could signal a divergence occurring between ascending RSI LEVELS & CONSOLIDATING PRICE ACTION WHICH CAN MAKE FOR SOME VIOLENT VOLATILITY IN THE NEAR FUTURE.
MACD: As of now MACD is resting at an average oversold level of -2.0 but is signaling a move to the upside in coming weeks.
MAIN POINTS OF CONTROL:
1. RSI DIVERENCE OCCURS AS RSI RISES & PRICE ACTION CONSOLIDATES.
2. MACD FLIPS INTO POSITIVE TERRITORY.
3. A BREAK OF 21 POINTS FOR PRICE ACTION CAN BE INDICATIVE OF FURTHER UPSIDE FOR VIX IN THIS SCENARIO.
FULL CHART LINK: www.tradingview.com
TVC:VIX
CBOE:VIX

✅VOLATILITY INDEX WILL GO DOWN|SHORT🔥
✅VOLATILITY INDEX was trading
Along the rising support but
Then the breakout happened
And I think that it will go
Further down
SHORT🔥
✅Like and subscribe to never miss a new idea!✅

VIX Bearish Bias! Sell!
Hello,Traders!
VIX broke the rising support
And was consolidating below
The broken line so I will
Be expecting the move down
To continue towards the
17.00 level below
Sell!
Like, comment and subscribe to help us grow!
Check out other forecasts below too!

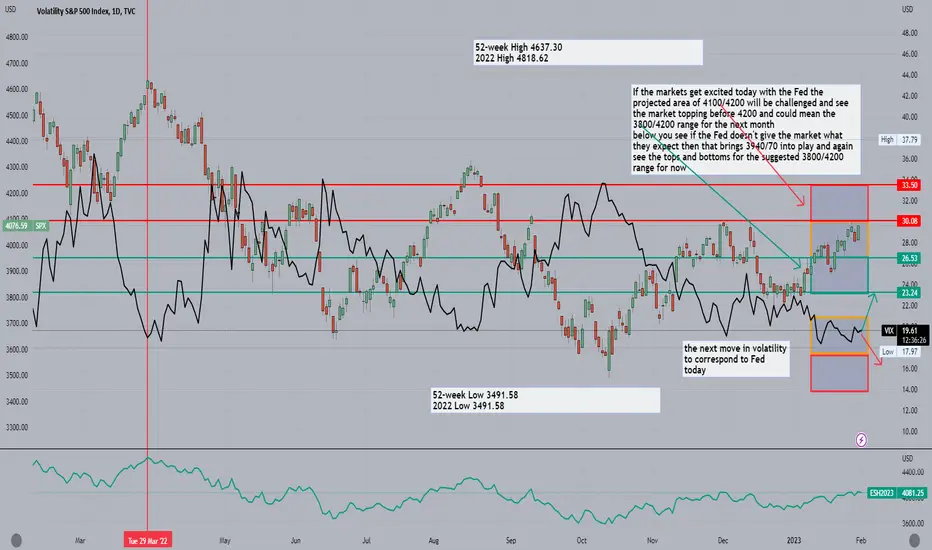
Fed today and expected moves in price and volThe Fed decision today with probably give the market their expected 25bp hike, the devil in the detail is always the press conference and any potential guidance offered, the market is pricing in much slower and ending to rate hikes and possible cuts by year-end. BUT he has consistently said there will be not cuts this year !! and that could disappoint bulls and a quick reversal could ensue. place your bets and good luck out there. Today is about watch the first hour after the announcement manage existing positions and don't get sucked into the frenzy after the announcement the Algo's will kill you
Largest Crash of our Lifetimes is here! For Starters - Go Watch this guy as he is 100% spot on. twitter.com
Lets start with a Chart of the VIX From October 12th (the bottom of the last market rally).
Using the 1hr $VIX Chart, you can see we have 5 open gaps. We filled the last gap TODAY:
And in fact - we now have a gap overhead!
And the VIX bottomed directly into its 100month SMA.
If you watch the SPX and the $VIX side by side, this rally has been mechanical and algo driven, filling both SPX and VIX gaps during the entire rally.
Onto the SPX.
SPX I think set a very sneaky bull trap at the 200dma this week. We are back into an upper trendline which is where the 50w sits as well.
SPX has a small open gap at 4200 - but that is going to be REALLY tough to fill from here. What SPX does have is open gaps all the way down to 910 from 2008
Here is where the real pressure come from - Bond yields are about to
Each Selloff in the SPX from this upper trendline area has been around a 20% drop. This would take us down to ~ 3200 on SPX and fill lots of downside gaps.
The REAL Driver - Bonds.
The bond market has largely priced in all of the Fed Rates Hikes and has moved on. What it is starting to look for now is "what is next". What comes next is the slaughter of earnings in Q1 of 2023.
Here I show the 2yr Bond (which is basically the shadow Fed Funds Rate) in candles, the actual Fed Funds Rate in Orange, and $TLT in Blue.
What you can see is that basically EVERY TIME that the 2yr (candles) crosses BELOW the Fed Funds rate (Orange Line) - the long bond (blue line) starts a massive rally as the next Fed rate cut cycle is coming into play.
What Bulls don't understand is that when the Fed is cutting rates in a global recession - that isn't bullish. It's VERY bearish because the underlying economy is deteriorating and the companies earnings are crashing. If you aren't long Bonds already, start building a position. TLT could easily double in the next year.
The 2s/10s Yield Curve is the most inverted it has been in HISTORY
You want to buy bonds when the curve start to UN-INVERT as this means the front end of the curve is going to 0, and you will get massive capital appreciation of long bond holdings like TLT
Energy has already caught on
Energy stocks are WAY overdone - and Oil is starting its next big leg down. Oil is extremely sensitive and has already caught on to the coming massive global recession in 2023.
How to Play This
1) Buy Long bonds like $TLT or $ZROZ
2) Short indexes/banks/Semi Conductors / Energy


The curious case for a $28 VIX trip... FUD about to hit markets?FUD FUD FUD, Fear, Uncertainty and Doubt. The 3 letters every trader on the street should know. No matter if you are dealing with Cryptocurrencies, Stocks or Forex, no one wants to wake up to an overnight position hit by FUD.
The VIX has long been known as the leading indicator as to the sentiment of the markets. It is known as the fear index and right now it is unreasonably low compared to recent history and current events. I mean we did just arrest our previous President and current candidate for President. Away from politics we also found ourselves in a currency war with the BLOC using the Chinese Yuan for settlements over the US Dollar. Well aside from economics, we still are funding our ongoing proxy war in Ukraine with the only other 2 superpowers on the planet. Well, Away from politics, economics, and war.... Oh wait, yeah the data on our economy came in pretty meh (not impressive).
So why in the world would the VIX be representing so much strength? Careful, you are starting to think for yourself and our TV overlords don't like that so much. But you are starting down the right track.
The VIX should be easily in the low to mid 20's but instead its flexing at 19.01?!? For reference the 50 Moving Average is 20.63 and the midline of the current Bollinger Bands is 22.04 with the low band being 16.83 and the high band being 27.25. If I was thinking about the next few weeks I would probably think that our world right now is providing significant enough risk to justify a trip northward towards the midline @ 22.04 but actually even higher to the high band of 27.25. Recently we touched 29 multiple times in recent weeks but immediately rejected and shot down to the 19.01 where we sit currently. Rejecting off a ceiling once, twice and even sometimes three times is common but I probably wouldn't need very many fingers to count the times an Index pegged a ceiling 4 times and didnt break through it significantly.
The market has stayed propped up on hopium for long enough and now its time to start pricing in reality. All is NOT well. I don't view this as a doomsday scenario at all but we need to move closer to reality. I see 28 as a start, it would signify the markets beginning to accept reality and no longer rely on the Buy the Dip hopium that retail investors bankrupted themselves on over the last 2 years.
$28 Vix is what i see coming.
Just documenting my own thoughts from my own charts. Dont mind me. Most likely not a human anyway.

$VIX @ lower level & indices closing in to MAJOR RESISTANCEApril has been the most profitable month over the last 2 decades for #stocks.
The SP 500 has been positive 80% of the time with a 2.5% return.
Posted on this yesterday, but not here.
ATM we're @ the lower end of the $VIX & close to resistance levels for indices; $DJI $NDX $SPX $VIX

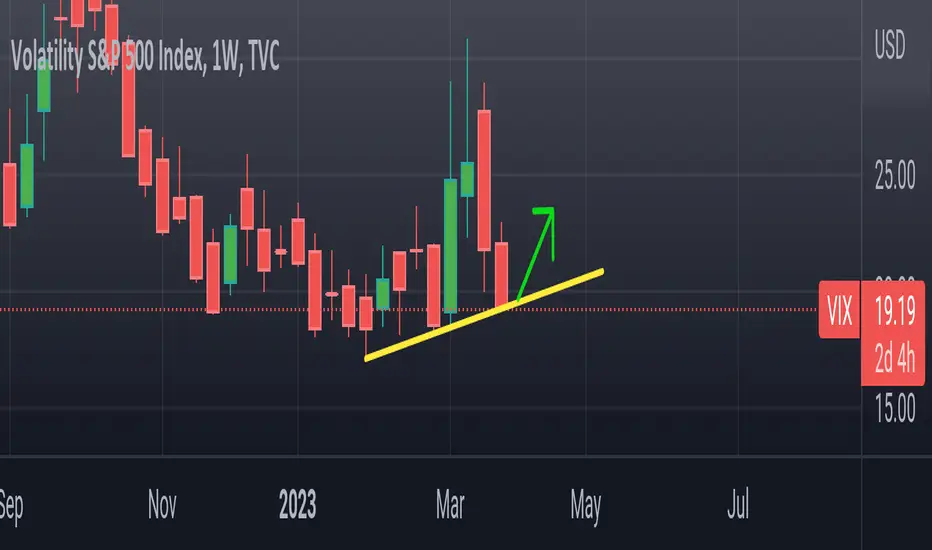
VOLX TO THE MOON!!!We are forming what looks like a DB structure in long term. This should be long-term trade all the way above the GZ to 30+.
SL below the bottom BZ.
Good luck.

VIX to $64 We can easily see a spike up to ~ $64 on the VIX if these narratives continue to worsen in Ukraine. Correlations are approaching 1? VIX will soar.

VixWedge on top of wedge..
Vix setup looks bullish here
First breakout would be to 20 or major wedge resistance sometime this week..
The real sell will come when we break over the yellow wedge
VIX Major Crisis RainbowHi all, I've stumbled upon a pattern that seems to play out when the hottest new major crisis drops.
I've color-coded the various sections on this pattern, and I'll attempt to give a breakdown of each. Let's begin.
Stealth Phase - Grey
In this phase, it seems that the market is performing some sort of rally, and so the VIX lowers a little bit. During this, the cause of the recession is known to very few. These insiders may make large selling moves into the rally, but otherwise, it's impossible to tell that anything is wrong. Lehman Brothers on the verge of collapse in 2008, the Covid virus not being taken too seriously in 2020, and today's Fed Tightening being dismissed by talking heads and the generally optimistic.
Initial Impact - Red
Once the bad news really gets broadcast and sinks in, the market drops a bit. This causes a steep incline on the VIX, signaling (of course) higher volatility. This initial impact is followed by more spikes, noted on the chart in a lighter red. In 2008 this was the Lehman Brothers collapse. In 2020, it was around the time that the first Covid case was announced in the USA. Today, this is the collapse of Silicon Valley Bank, Signature, and Credit Suisse.
Immediate Return Rally - Orange
The extremely optimistic, those in denial, and the ones wanting out, will rally the market into a higher state. This, in turn, causes the VIX to shrink back down. The VIX may in fact shrink to its previous levels, before the initial impact even came around. In 2008, this rebound came about after Lehman collapsed. In 2020, this was mid-January to mid-February. In 2020, this is where we are now. Total dismissal of the collapse of some very large banks, and a plea for higher highs.
As a side note, I do find it amusing that the past few days have seen such a large market rally. It just happens to be that the end of the quarter, when large money managers are trying to get their bonus, that we see such a severe rally. In fact, we've seen the S&P 500 seem to break out of its major resistances. While this is usually bullish behavior, I personally discredit this move as a classic pump-and-dump. While we may see the markets move higher by another couple percent, it is more likely that these managers are done calculating their bonuses and will rush to withdraw their profits. Retail traders will likely be left holding the bag as next week's conditions rapidly decline.
Back-To-Back Selloffs - Yellow
Once the rebound enthusiasm of the market wears off, the selling really kicks in. The first leg down catches unprepared traders by surprise. A fluke, they think. And so we see them catch the falling knife. But when this pressure doesn't let up as well as they thought it would, a second wave of selling proceeds.
Relief Rally - Green
After taking a major beating, the resistance of the market comes to head. We find a temporary bottom due to the oversold nature of things, and a relief rally is in order. The optimistic, once again, will see this as the bottom and even as we continue back down the move will be dismissed as a double-bottom.
Return to Panic - Turqoise
It seems that as we proceed past the double-bottom, the market becomes confused on which direction it should go. Accelerate or decelerate? This brief period seems to be different.
Crown of Despair - Cyan
Yes, finally, our journey is at an end. This is marked by not one, or two, but three distinct spikes in the VIX as it tops out. This signifies our market bottom, at least for 2008 and 2020.
Road to Recovery - Blue
The road to recovery is a bumpy one. After we've reached market bottom, the VIX seems to pop higher once more and then take a break. After this, there are three distinct pops in the VIX as we return back to normal market conditions. The middle of these three seems to be a bit more drawn out.
While this chart certainly can't predict the future, it is very interesting to see the clear similarities between 2008 and 2020. Not to mention the similarities both of those have to today's market. The psychology of the market during a large downturn is extremely hard to predict. There have been many crashes in the market that don't follow this highly specific model. 2000's Tech Bubble, for example, does come very close and appears to have all of the pieces- but things are a little more distorted, and perhaps overlap each other. The "Crown of Despair" in that case is malformed and, admittedly, just a single spike. I would have liked to test this theory on some other major crashes, but the VIX indicator was only introduced in 1993.
What are your thoughts?

Long VIX calls offer cheap portfolio insurance.With the bear market rally charging ahead full steam, VIX is now back sub 20s. Sure it can go lower still but for those of you thinking this bear market rally will end sooner rather than later picking up some vix calls isn't a bad idea. They're reasonably priced and offer good insurance should equities puke.

Potential $VIX Spike IncomingTightening Bollinger bands and bullish divergence in stochastics (weekly interval). This bear market has not seen a true ^VIX launch yet...

$VIX close to lower level, time for breather soon?Excuse my absolutely HORRIBLE art skills😄
$VIX USUALLY stays close to a "bottom" for few days
Kind of an exception = yellow
We're closing in to lower end of the symmetrical triangle
#VIX tends to bounce there
$SPX has had issues in this area, it does look better than before
Weekly volume on $SPX, see that?
#stocks

FALLING WEDGE (VIX MAY RISE)Looks like the VIX may fancy some action. I don't really trust this symbol especially how it has been broken lately. However, there seems to be a falling wedge. If it is valid this may rise in the near term.

VIX - is the sell 20, buy 30 strategy done?Throughout 2022 you would have done VERY well taking profit when the TVC:VIX hit 20 and accumulating when the VIX hit 30. But has this trend concluded? This movement and profit/accumulation opportunity is consistent with the most recent tightening from 2017 to 2018 where fed funds were rising, and the yield for 2 year treasuries in the bond market exceeded fed funds. When the yield for 2 year treasuries fell below fed funds the VIX remained below 20 until covid hit. The VIX spiked during covid and consistently descended while the market expanded. This pattern is only observed in the most recent cycle and not something that we see consistently repeated historically. If the 2 year remains below fed funds, should not expect the VIX to range between 20 to 30 or will 20 to become the ceiling?

Vix longPulled back to weekly supporting trendline here.
I like the long to 22 here, then we'll go from there.

Does You Guys Like Ramps?VIX. Swing Trade. Careful not to get too big early and get volitlity crushed as the market picks a direction over the next days and coming weeks. MAC D Crossing. High Volume at Bottoms. VIXJ2023. $VIX $UVXY $ SVIX

