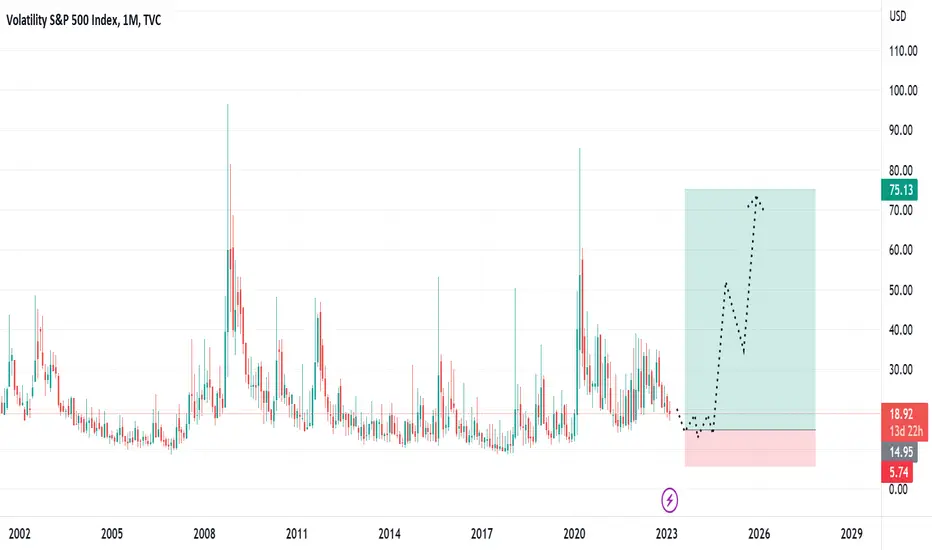
VIX - Take your time, hold your Vix LongEverything points 30, to say the least.
Just watch it push until then.
Reasons:
Descending Wedge target
Channel's Top Curve
Longest period without VIX spikes up
Fakeout to the downside - rejected breakout
VIX trade ideas

VixCup and handle formed here... should take us to 23 ..
Not 100% on this setup.
. if you go to to your smaller time frame 5-15min and look at the handle you'll see the possibility of a double top that would take vix back to 18.55.
But handle is grinding on support and has taking a broadening wedge form.. let's see what happens

WARNING: VIX IS EXPLODING TO THE UPSIDE!I cannot stress this enough: we are going to see volatility explode really soon. From what I see from the 5 mins chart, Tuesday might see a lower opening that will be the lowest the market will see in some time. Ending diagonals are significant. And they are also incredibly reliable patterns. I had traded this pattern multiple times when I was a professional trader in a proprietary trading firm and also in a hedge fund. I cannot stress this enough. Volatility is going to explode really soon.
Please be careful.
And good luck as always.

VIX 18/2/23 - time to cool off a bit.. ?Hello hope your are all well..
My Vix update.. I expect a drop.. do you see what I see?? I think you can ..
This means Futures will rise FIRST before telling us what will happen re Inflation fears.
The VIX don't lie!

Interesting phenomenon on VIX.. is WW3 possible ? if you watch this graph.. sit down.. watch ... calm down.. look around what is happening in the world .. and decide for yourself what can happen.. It is good to be prepared for everything.. Inflation this year will calm down.. interest rates will go up.. vix will go down.. The world will calm down.. but the governments will start arming more... the conflict in Ukraine will not end but will escalate.. until the point when there will be a landing and the 3rd world war will start... west against east... and then the world will be reborn and a new era of humanity will begin... war is inevitable.. the greed of governments is endless... the world must undergo a bloody change... and change is within reach..

VIX Inverse Head And Shoulders.Likely will reach 1.618. S&P500 will likely print between $3920-$3850. Always, long VIX with caution.

VIX Index Fibonacci Analysis 021623Trading Idea
1) Find a FIBO slingshot
2) Check FIBO 61.80% level
3) Entry Point > 19.3/61.80%

VIX: VOLATILITY CYCLES / PREDICTION / EXPONENTIAL MOVING AVERAGEDESCRIPTION: In the chart above I have provided a SEMI-MACRO analysis of VIX. I have decided to reduce the number of BARS that it will take for the Volatility Index to see its next price action cycle with past cycles lasting up too 250, 300, or 375 BARS to complete. With current price action trajectory and support it appears 250 BARS would be the most suitable span of time for this current cycle to complete.
POINTS:
1. Deviation of 7 Points Remains the same for SUPPLY & DEMAND POCKET PLACEMENT.
2. 8 YEAR UPTREND Line has nearly made contact & is indicative of VIX seeing a rubber band reaction to the upside.
3. Current DOWNTREND pattern is being squeezed against 8 year trend.
IMO: If price action sees a break to the upside past 21.50 it will be a sure enough bet that VIX will then be looking for 26 Points.
EMA'S: PAY CLOSE ATTENTION TO TIGHT MOMENTUM OF ALL THREE EMA'S (45,100,200) WHICH USUALLY INDICATIVE OF UPCOMING SHIFT IN TREND.
RSI: In regard to RSI crucial pivot point levels are mapped by using past positions held by RSI when VIX would eventually bottom out.
MACD: The VIX and MACD share a parallel relationship in the way that as soon as MACD touches MEDIAN and switches directions price action on VIX will come to see a shift in momentum. Currently MACD is in negative territory but should be another solid indicator for when VIX is ready to rubber band to the upside.
SCENARIO #1: In a BULLISH scenario price action continues to be supported by threshold at 19 & by March 8th it would be inevitable for PRICE ACTION to not be carried TO THE UPSIDE by the 45 EMA with current TRAJECTORY if SUPPORT OF 19 HOLDS.
SCENARIO #2: In a BEARISH scenario this setup would become invalidated if price action is to BREAK TO THE DOWNSIDE past the 19 SUPPORT LEVEL. And would depend on a future hold of of at least 16.80 to be held in order to respect 8 YEAR UPTREND.
FULL CHART LINK: www.tradingview.com
TVC:VIX

SPY Getting Ready To Break DownI have not posted in a while. My goal is to post weekly updates. I incorporate several indicators for my market sentiment model, including interest rates, EM capital flows, and gold.
All indicators are based on academic papers, most notably several by Wouter Keller.
Sentiment Model Indicators:
Interest Rates: Flipped defensive today
EM: Defensive since Feb 2nd
Gold: Defensive since Feb 2nd
We are now in a defensive regime. Financial conditions are showing signs of tightening, with HYG being the leading candidate. Markets are coming around to the idea that inflation will be higher for longer (CPI, employment, etc), and earnings compression will need to take place.
Technically, the SPY is forming a Wykoff distribution pattern. I am looking to take risk off before a breakdown lower to 380 over the next several weeks. A sustained rally above 418 will void the distribution pattern.
Comments are welcome!

VIX .... Heads UpThis market has been in a 4 1/2 month decline.
Traditionally this market moves inversely to the SPX. Although...not so much recently.
Technically this looks like it's set up for a good risk reward trade.
This scenario fits into my expected correction in the ES in the near term. See my posted SPX idea linked below..


Limit long VIX at 15 I think VIX will go down a bit more but I'd be interested in getting it long VIX at 15.
This is based on a few things, the simplest of them being the 2007/current day analysis.
Market ending the last Up leg in the QQQ SP 500 ALL INDEXES The Lack of follow through on the Sp to reach what should be the min target of 4222 with the breaking down of the vix minus 8.75% today is telling me that the final up leg ideal target was 4222 min ideal 4308 is setting up to now Break ALL THE LOWS .


VIX Is Ready To PartyThe VIX looks like its ready to party ahead of today's CPI print.
It recently touched the upward moving monthly trendline and my guess is it moves into the mid to upper twenties short term.

Vix.. The BluePrint Falling wedge.
Gapped up to resistance Friday and today, both led to rejections. Vix actually gapped outside its Bollinger bands 2 days in a row. A hold outside its Bollinger band is not sustainable with News/Catalyst.
CPI tomorrow will decide if the Vix breaks out and Equities correct or Vix heads to 17 and Equities rally.
There is a nasty double top on the hourly that will take this back to 18 quick if tomorrow turns bullish.

VIX: Short Trading Opportunity
VIX
- Classic bullish pattern
- Our team expects retracement
SUGGESTED TRADE:
Swing Trade
Long VIX
Entry - 20.80
Stop - 19.33
Take - 23.00
Our Risk - 1%
❤️ Please, support our work with like & comment! ❤️

VIX futures looking bullish ready to move upwards VIX futures looking bullish ready to move upwards . Market could move negative.

VIX Will Go UP! Buy!
Hello,Traders!
VIX broke out of the
Falling wedge so we are
Now bullish biased and
A move up is likely
Buy!
Like, comment and subscribe to boost your trading!
See other ideas below too!

✅VIX GROWTH AHEAD|LONG🚀
✅VIX was trading in a falling wedge
But now we are seeing a bullish breakout
So I am locally bullish biased
And I think that the pair will go further up
LONG🚀
✅Like and subscribe to never miss a new idea!✅

VIX LEVELS = SHORTVIX has now entered back into the range. VIX is breaking out. Shorts don't look too bad. We are in reload mode. Please like and follow for more.

You Haven't Seen Anything Yet. Warning!The trend was started in 2017. Covid crash was just a bump on the road to something really big.... Once in a lifetime crash in one the way IMO...

$SPX $VIX perfect bounce of the VIX off its long term uptrend perfect bounce of the VIX off its long term uptrend, doesn't bode well for indexes most likely
