LONG VIX: 2023 TRADE OF THE YEAR!LONG VIX:
Add/ double down 19.1, 16.5, 15. Then on any pops remove the higher bids.
Target is 40/50/55 depending on macro circumstances.
VVIX is also systemically undervalued. the vol space is primed for green dildo. volmaggedon was Q12018. i expect something similar. all we need is 0.5%mom core inflation on jan 12th or feb 15th and this will print imo.
VIX trade ideas

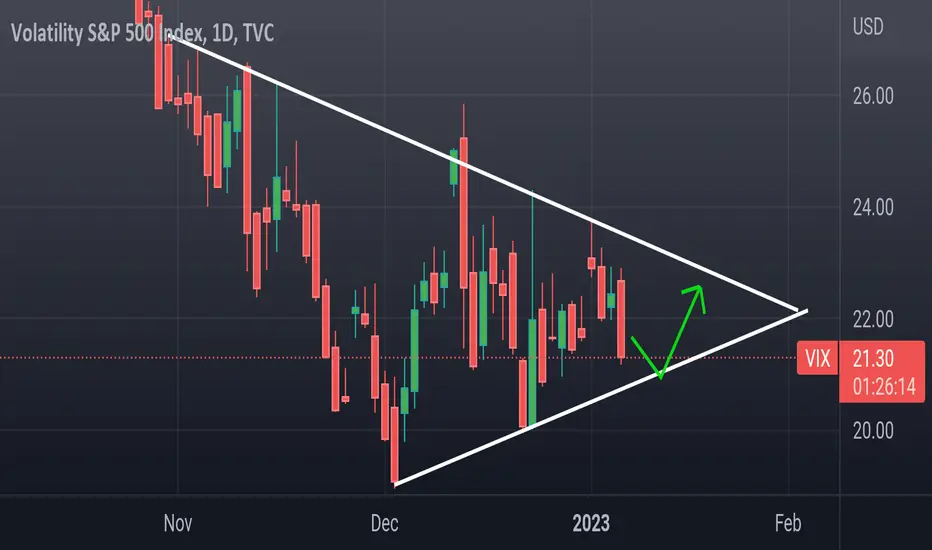
$VIX closing in on lower part of trendCOPY paste from elsewhere
Let's talk $VIX again
Different #VIX views:
1 Weekly hasn't closed above grey lines
Long term uptrend
Daily WEAK
2
In symmetrical triangle
Bottom part of trend is likely 2b tested
RSI still positive
IMO would reduce longs @ low end & see how it plays
$SPX #SPX #stocks

VIX Daily Breaking Down out of large Symmetrical trianglePretty large pattern. I wanted to draw it as a diamond reversal pattern, but it was more so because i expected the SP500 to drop not rally today. Nope... Trust the patterns. Lets see how low the VIX can go. It was in the 19's when I published this.....

Us vixUs near to support level
Support level zone at 20.56
The falling vix shows their is no fear among masses globally regards to inflation and results of corporate upcoming
Just a view ask your financial advisor before buying on my view
For educational purposes

A VIX play for newsLook what happened to VIX right after December's CPI release. Equity and bond markets reacted positively, so VIX tanked... but then bounced most of the way back by 12:30.
Traders who are long and want to hedge news could try this play:
Set stops for their longs and buy an appropriate amount of VIX.
If the markets tank, expect VIX to advance strongly, and take a profit as soon as you can.
If the markets rip, wait for VIX to dump and bounce and sell the bounce.

$VIX close to bottom part of rangeHard 2b bear, yet so much NEG DATA
Doesn't make sense, does it?😄
$VIX Long Trend being threatened?
$TNX & 2Yr #yield hovering, higher lows
Getting weirder
US #Dollar $DXY @ level we called few months ago
Things about to get interesting!
#stocks #crypto #gold #silver #bonds

VIX Melt?Wow, VIX "feels" low al;ready, but a further meld down could drive equities up. Seems Insane, but yeah......

Beware of the vix. I would love to dive into more depth here, but I'd really have to start doing a consistent video series for that. I've been watching time cycles which I've charted on the vix and the SPX for a while and there's a very important region coming up near the end of January.
Those unfamiliar with cycle analysis should go study it a bit as this post won't explain it much. All I'll say is there's a trough/cycle end region coming up near the end of January or very early February, on the vix. The vix charts are messy and cycles are *not* perfect in real life, which is why you have to find a date range and watch price action closely around that time.
My overall picture on the S&P500 is bearish long term still, even after all of this. However, that does not mean it won't still go through big relief rallies first.
In fact, the S&P500 is due for a relief rally, some individual stocks already bottomed last year, some are bottoming now, and some have not bottomed yet. That's the problem with stocks, and index funds, that various stocks, usually by market cap, bottom at different times, and some may start moving up while the big ones continue dragging indices down. In times like this, it is in my personal opinion (NOT FINANCIAL ADVICE) that it's better to pick your own basket of stocks than to go with an index fund at this time.
Watch the cycles, they are broad ranges, but something is likely brewing in the vix by early February.
***This is not financial advice, and should not be taken as such what so ever. These comments are a reflection of my personal opinions and charting and should not be used in any way to make financial decisions. Do your own DD***

VixAt support here ...
Bullish target from here is 50sma .. got rejected there 4 straight time... If CPI push this over then we are headed to one gap at 19.

VIX to hit 16..17 in Janexpect SPX to hit ~4300. Structurally, this should be the last upswing before the crash.

VIX is reapeating the patternA rule of 2 gives a perfect VIX long setup into Q1 on 2023 rally.
The markets are not over with the downside and VIX didn't get even one bottoming signal in 2022. It was intermediate bottoms, but no panic
Im going to add more VIX calls, Apr expiration this coming week.
Its in consolidation mode and should end soon with the breakout

VIX in DIAMOND BUTTOMS!!!!!On the VIX Volatility index , I have observed a diamond pattern, which suggests that the current instability in market sentiment is likely to lead to a rise in market prices. Based on this, I decided to open a long position at the entry price of USD 21.21. I have set the Stop Loss level at USD 19.53 so that if market prices turn worse than expected, I can close the position with minimal loss. And I set the Take Profit at USD 24.26 so that if the market prices reach a certain level, I can automatically close the position at the best possible price. It is important to note that this is only my own observation and does not constitute investment advice. Everyone should make decisions in the financial markets at their own risk.

SPX Long or Short VIX is on a nice support trend, if it breaks down I'm expecting to see SPX rally up to $3930.00 as my 1st TP $3960.00 2nd TP filling up the daily imbalance.

VIX Trend As we can see today the SPY bounced up from it's trendline in the morning, breaking out on a major resistance.
Two scenarios can happen tomorrow
#1
VIX bounces from the trendline causing the SPY to go down which would invalidate todays breakout and cause it to come back down. Considering that both the SPY and VIX have an opposite GAP it could go either way.
#2
VIX breaks the trendline and may come down to fill the GAP it has around the marked area. In this case we can confirm that the SPY can move up to fill it's GAP as well.
Trade safe ! I'd love to hear your input and thoughts on this.

Recession the new buzz word after today's report?For this to occur I'm assuming its a much weaker jobs report that will excite the market that inflation is largely behind us. Then earnings disappoint and the real fun begins.

Beware the sleeping VIX volatility dragonVix measures option premium levels and is associated with large fear uncertain times. Bottoms in markets often have high vix level indicating investors desire for protection and large moves in the market.

Vix update Purple line 50sma...
If we close above this, the next resistance will be trendline at 24
Starting to get overbought on the 1 hour chart and 2 hour chart...
Which means unless this is a black swan event we may cool off at 24 until FED minutes...
Personally I don't like being short equities, especially swinging when the vix becomes overbought on 1 hour..
On the day before the last CPI pop the vix was overbought on 1hour and the next day the indexes rallied 3%. Now we're going into the FED minutes overbought.. let's see what happens.
The double bottom pattern has almost fully rounded here
2 things I'll be watching
1.Qqq 260
2. Vix 24

$VIX in middle of pattern2 From $DJI recent post
While most media & people ARE RIGHT, they tagged along @ end, too much neg
I'm contrarian, this much negativity raises flags, especially when media 24/7
Still think $VIX #VIX in between pattern gives opportunity for swings before the eventual breakout
#stocks #crypto

Looking symmetricalDefinitely not an exact science, but I am bullish on VIX. FED is supposedly going for recession. I think they are, just they try to have a "soft landing". I would even argue it's smart to have soft landing, if the leverage would unwind on a single day the financial system would stop existing as we know it.

Short term VIX signalVIX might be signaling a bullish move for the index, however that is yet to be confirmed via 4 hourly close. SPX target I'm aiming for are around 3950

Synthetic Short Against the Box with TQQQ & SPXS?I created this chart to illustrate the price action of leverage ETF in relation to VIX.
The purpose is to determine whether it's possible to create synthetic version of shorting against the box, where you never short and long the shares of the same stock.
Instead someone is only ever long the shares on TQQQ with a protective PUT, and short the shares of SPXS with a call to cover.
Then using the wheel strategy as a means to generate reliable credit.
I'm very interested to so other people's observations/thoughts...

DGSTACC: VIX PREDICTION!!!!DESCRIPTION: The chart above is an analysis of the VIX and it current pattern formation of a SYMMETRICAL TRIANGLE FORMATION .
POINTS:
1. Strong Support for VIX at 19.50 with current Demand Pocket Ceiling for FIB is at 25.
2. Move should occur by the 9th of January as price action would have to compress a lot more by then.
3. Current overall trend is a down trend that we have been seeing for VIX since early October.
SCENARIO #1: If break of Symmetrical Triangle occurs towards the downside expect a bounce at 19.50 .
SCENARIO #2: If break of Symmetrical Triangle occurs towards the upside expect resistance at 25 .
*NOTE: NO RECESSION HAS EVER ENDED WITHOUT A VIX SPIKE TO 45 AT LEAST.
TVC:VIX
