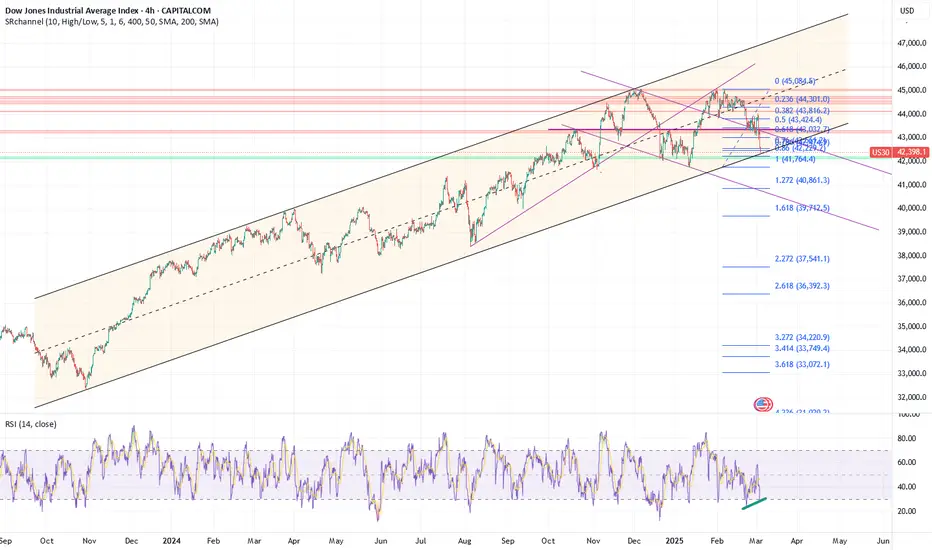
DOW JONES: 1D MA200 and Channel Up bottom. Bullish.Dow Jones is bearish on its 1D technical outlook (RSI = 36.722, MACD = -181.150, ADX = 58.438) as it is running the bearish wave of the 16 month Channel Up. Being so close to the 1D MA200 has been a buy signal since November 2nd 2023. Additionally, the price just hit the 0.382 Fibonacci level from the last consolidation phase. If that's confirmed, then the index is about to complete the new consolidation phase. The target on the previous one has been at least the 3.0 Fibonacci extension. The trade is long, TP = 50,500.
## If you like our free content follow our profile to get more daily ideas. ##
## Comments and likes are greatly appreciated. ##
US30 trade ideas

Possible bottom for Dow JonesDow Jones has made 0.786 retracement and reached the bottom of the channel. There is a positive 4h divergence on RSI. I think we will at least see a bounce from here tomorrow.
short idea on Dow Jones Industrial index us30Hi traders, this idea is based on technical analysis. As you can see, the Dow Jones has broken below the support level of 44533.5, which leads me to expect further sell-off towards 43909.8, 43593.7, and 42598. My stop-loss is at 44533.5.

DOW JONES SELLOn the last day of January, the price on the monthly chart picked up liquidity above the November and December peaks.
On the daily chart, the price does not break through the last peak, because of the range in which it is visible that buyers are losing strength and sellers are taking over. This week, buyers are making their last attempt and after that the price is making a second bearish candle in the range in which the price is, I expect the price to fall in the coming days/weeks. The first take profit zone will be the last daily demand zone. For a more precise entry, we can use the H4 chart and wait the pullback of move that started on Friday.

Analysis on Dow Jones: Much better than NASDAQDear All
unlike nasdaq which is really bearish,
DJ is still in the sideway stage
Best of luck
TraderPP

$US30 LONGSUs30 x
Longs taken here. Throwing below last low.
Trade Low risk don’t like the handles around here but do feel we can make way for a run to the upside.
First hit is on $43,640 with full tp at the shorting range that we recently came short of $44,180
Let’s see… 🤨
Bearish continuationYM is currently in a bearish trend and may likely continue this trajectory after having broken through a consolidation phase between 43700 and 43300 to the downside. As of now, price action is trying to rise and retest the break zone and its upper bound. If it remains under 43700, price action may continue in its downward direction towards support barriers below situated at 43050 and 42500.
US30 Trading Strategy That’s Been Proven to WorkThis strategy is backtested over trades and works best during the New York session (9:30 AM - 12 PM EST).
Here’s how it works:
Step 1: Identify Key Levels
These are the support & resistance areas where institutions place big orders.
Look for previous highs, lows,
Step 2: Wait for a Liquidity Grab
Banks love to trick retail traders by creating fake breakouts.
We wait for price to break a key level, trap traders, then reverse.
Step 3: Enter on Confirmation
Once we see a liquidity grab, we wait for a strong rejection candle (pin bar, engulfing, etc.).
Entry is placed at the close of the confirmation candle.
Step 4: Set Stop Loss & Take Profit
Stop loss: Just beyond the liquidity grab.
Take profit: At least 2x the stop loss distance for a 1:2 risk-reward ratio.

Dow Jones Index Analysis – Daily TimeframeThe Dow Jones Index is currently in a corrective wave, and until this range phase is over, a strong new move is unlikely. However, once the correction is completed, the index could resume its upward trend.
🔹 The key support level in the long-term timeframe is 41,600.
🔹 In the medium-term, the critical level to watch is 44,000.
🎯 The long-term target is set at 46,600.
📈 Upon completion of the corrective wave, the expected growth is approximately 12%.

Short position on the Dow Jones indexI think this is the best situation for Dow Jones, After the break of the daily trend, the price returns to the previous ceiling and the inability to break the floor, strong bearish candles, in my opinion, indicate a decline.

US3O BUY ANALYSIS POI Here on US30 price form a support and a resistance making so range but the over all trend is up which means that buyer is likely to continue pushing the price up and a trader should go for long around area of 41970.08 and target profit of about 43378.87 . Use money management

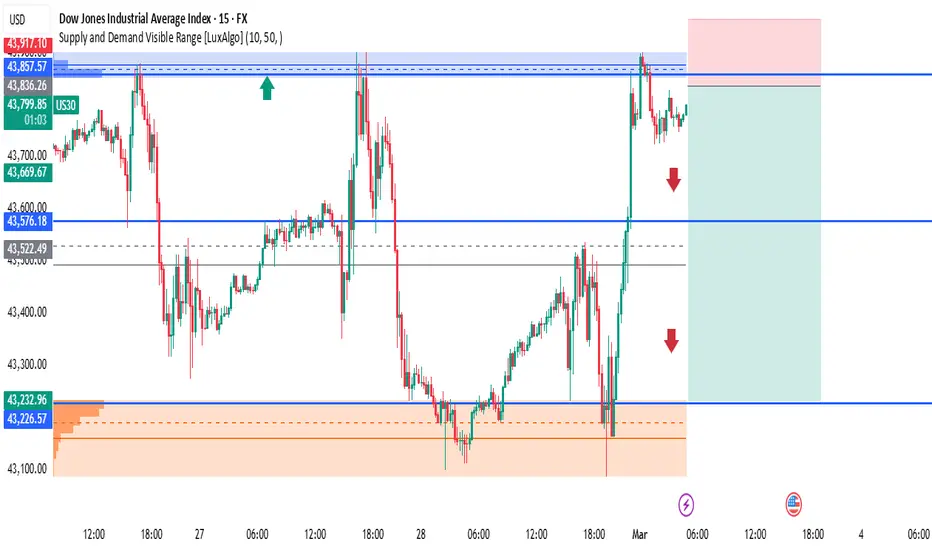
US30 SELL ANALYSIS SMART MONEY COCNEPTHere on US30 price form a supply around area of 43857.57 and is likely to continue moving down as more sellers are likely to push the price down so trader should go for short with expect profit target of 43576.18 and 43226.57 . Use money management
US30 (Dow Jones) Probability Analysis – March 4, 2025
Market Structure Across Multiple Timeframes (M15, M30, H1, H4, D1)
Key Observations (Multi-Timeframe Analysis)
1️⃣ 15-Minute (M15)
Price has dropped from the PDH (Previous Day’s High) and is now consolidating around the PWL (Previous Weak Low).
Liquidity sweep at PDH led to a sharp decline.
Equilibrium at 43,500 could act as a mid-range resistance if price retraces.
Potential bounce or breakdown from the 43,200 demand zone.
2️⃣ 30-Minute (M30)
Price has fully retraced from the premium zone near 44,300.
PDH (43,800) is confirmed as a strong resistance, leading to a bearish structure.
The next key zone is around 43,000 - 42,900 (liquidity zone).
If price holds above 43,200, a short-term rally could occur toward 43,500.
3️⃣ 1-Hour (H1)
Major bearish BOS (Break of Structure) confirms bearish sentiment.
Equilibrium at 43,500 aligns as a potential resistance zone.
If price breaks below PWL (43,100), next support sits around 42,900 - 42,850.
A retracement to 43,500 - 43,600 could give a short entry.
4️⃣ 4-Hour (H4)
Price is in the Discount Zone after a significant sell-off.
Previous premium zone (44,200) rejected price, leading to a shift in momentum.
If price holds above 43,200, a retracement could be seen towards 43,500.
If price breaks 43,100, a move to 42,850 is expected.
5️⃣ Daily (D1)
Major liquidity grab from the 44,200 supply zone confirms bearish sentiment.
Price is currently testing support around 43,200.
Failure to hold this level could lead to a further decline toward 42,900 - 42,700.
A retracement toward 43,500 - 43,800 could be a shorting opportunity.
1️⃣ Bearish Entry Plan (Short Position)
Entry Criteria (Short)
Ideal Entry Zone: 43,500 – 43,600 (Equilibrium & Lower High).
Confirmations Needed:
Rejection from 43,500 - 43,600 with strong bearish candles.
Break of structure (BOS) on M15/M5 confirming bearish intent.
Liquidity grab near equilibrium before dropping.
Entry Trigger
If price retraces to 43,500 and fails to break above, enter short.
Stop Loss (SL)
Above 43,700 (recent lower high).
Take Profit (TP)
First TP: 43,200 (current demand zone).
Final TP: 42,900 (strong demand zone).
📉 Risk-to-Reward (R:R) → 1:4 or higher.
2️⃣ Bullish Entry Plan (Long Position)
Entry Criteria (Long)
Ideal Entry Zone: 43,100 – 43,200 (PWL & Demand Zone).
Confirmations Needed:
Bullish reaction at 43,100 - 43,200 without breaking lower.
Higher low formation on M15 or M5.
Strong bullish candle confirmation.
Entry Trigger
If price rejects 43,100 and shows bullish strength, enter long.
Stop Loss (SL)
Below 42,900 (next liquidity zone).
Take Profit (TP)
First TP: 43,500 (Equilibrium retest).
Final TP: 43,800 (Bearish Breaker Level).
📈 Risk-to-Reward (R:R) → 1:3 or higher.
3️⃣ Neutral Strategy (Wait for Confirmation)
If price remains between 43,100 – 43,500, avoid trading.
Wait for either a bearish rejection (short) or a demand hold (long).
Break below 43,100 confirms shorts, while strong demand at 43,200 could give a long opportunity.
Trading Plan Summary
Setup Entry Zone SL TP1 TP2 R:R
✅ Short 43,500 – 43,600 Above 43,700 43,200 42,900 1:4+
🚨 Long 43,100 – 43,200 Below 42,900 43,500 43,800 1:3+
Final Thoughts
Bearish Bias: If price rejects 43,500 - 43,600, expect a drop to 42,900.
Bullish Bias: If price holds above 43,100 - 43,200, expect a bounce to 43,500 - 43,800.
Wait for confirmations before entering trades.

Dow Jones: Neutrality Strengthens Around 44,000 PointsThe Dow Jones Industrial Average has fluctuated within a 1% range over the past few trading sessions, encountering a neutral barrier near the 44,000-point zone.
For now, investors remain cautious as uncertainty grows amid trade and diplomatic tensions from the White House with multiple countries. This prolonged uncertainty has reinforced a neutral bias in recent price movements.
Persistent Neutrality
Currently, the Dow Jones remains trapped in a sideways range, with:
45,000 resistance at the upper boundary.
42,300 support at the lower boundary.
The price remains in the middle of this range, reinforcing the market’s indecision. As long as price action stays within this zone, the neutral structure may extend further in the coming sessions.
MACD Indicator
MACD movements confirm the current neutral market outlook. Both the MACD line and signal line remain oscillating near the 0 neutral zone.
The histogram also remains close to 0, indicating low momentum. As long as these conditions persist, price neutrality is likely to continue in the coming sessions.
Key Levels to Watch:
45,000 – Key Resistance:
Upper boundary of the sideways range.
A breakout above this level could mark new highs, potentially reviving the long-term uptrend that has been stagnant in recent weeks.
43,000 – Neutral Zone:
Converges with the 50-period and 100-period moving averages.
Also aligns with the 38.2% Fibonacci retracement level.
The most important short-term barrier that could limit any short-term bullish attempt.
If price fails to reclaim this level, bearish momentum could grow.
42,000 – Critical Support:
Lower boundary of the sideways channel. A break below this level could create a stronger bearish bias, potentially threatening the long-term uptrend that has been in place since last year.
By Julian Pineda, CFA – Market Analyst

Expanding trianglethe price has formed an expanding triangle, followed by a breakout and now we have a pullback, if the price makes a higher high, we go long
WE ONLY TRADE PULLBACKS

US30 - Short tern bearish moveBased on confluences, US30 may have a potential short-term bearish move before the bullish move taking profit at fib level -27. This is not financial advice. Trade at your own risk.

US30 Long: Bullish Outlook with Higher Targets Ahead Long Position on US30 – Targeting 43,680
1. Uptrend Confirmation
- US30 is forming higher highs and higher lows, confirming a strong bullish trend.
- A breakout above recent resistance levels suggests continued upside momentum.
2. Moving Averages Support
- The price is trading above the 50-day and 200-day moving averages, reinforcing bullish sentiment.
- A potential golden cross (50 MA crossing above 200 MA) could further support upward movement.
3. Key Support and Resistance Levels
- The index has bounced off a strong support zone, indicating buyers stepping in.
- A confirmed breakout above resistance suggests an upward push toward the 43,680 target.
4. Momentum & RSI Confirmation
- RSI remains above 50, showing bullish strength without being overbought.
- A bullish divergence in RSI and price action supports further upside.
5. Volume & Market Participation
- Increasing buying volume on rallies confirms strong bullish momentum.
- Weak selling volume during pullbacks indicates a lack of downside pressure.
6. Fibonacci & Technical Targets
- The 43,680 target aligns with Fibonacci extension levels, making it a realistic price objective.
- If momentum continues, additional upside levels may be tested beyond this zone.

possibility of uptrendIt is expected that after some fluctuation and correction, a trend change will form and we will see the beginning of the upward trend. If the previous low is broken, the continuation of the downward trend is likely.

US30 LongTarget at 45,273 have still not been met.
Price has kept collecting orders at in order to reach that target.
Two weeks ago we saw price tank heavily in an attempt to collect orders at an liquidity region.
This region seems to be at 43,100 daily liquidity level.
Price hit that daily level and then we saw a sudden surge of buy momentum, indicating that price is going high.
Price has broken structure on the daily and 4 hour timeframes, indicating that price will continue going upwards.
Due to the monthly and weekly candlestick closures, I can tell that price is due to retrace lower before going upwards.
I expect price to retrace lower forming an obvious liquidity region before I buy.

US30 Potential Buys us30 is accumulating on the 1H, keep an eye out for buying opportunities this week.

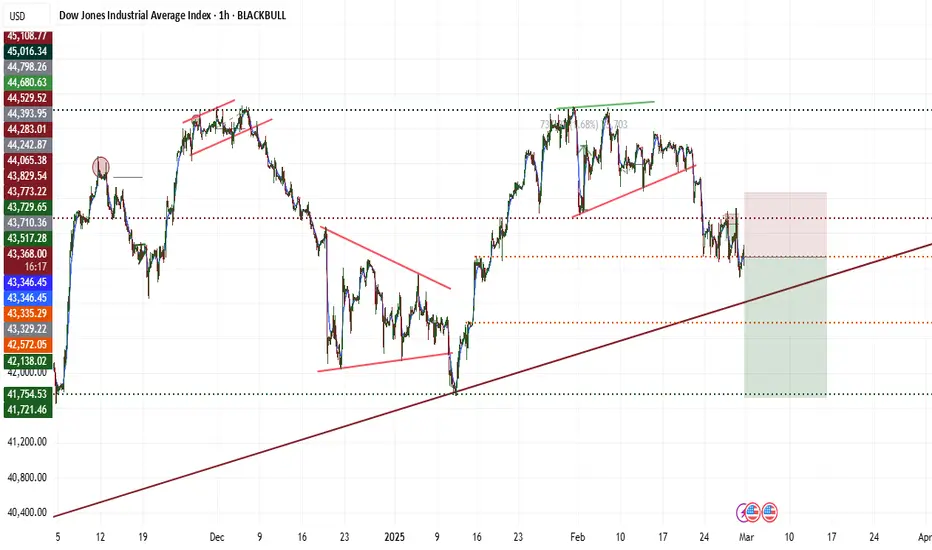
$US30 03/03 UPDATES.Busted out last time trying to short.
Pinpoint spotting on $43,496.52 mentioned on Friday.
Handle to watch here.
$44,134/180.
Stops by default automatically sits at $44,500
Until we get some closures that can confirm to tighten things up…
Rejections will send this thing straight into $43k which was the initial goal with lower end potentials of $42,500s.
LFG 🏦

BULLISH MOVEMENTUS30 has a (W) FORMATION that is in play currently. playing around 43758 that is a retest before the move upwards all the way to 44714.83 to complete the (W) formation.
N/B:
Its NFP week, SO BE CAREFUL

